Research article
Available online www.ijsrr.org
ISSN: 2279–0543
International Journal of Scientific Research and Reviews
Particle Swarm Based Optimization Algorithm for Maximum Power
Point Tracking in a Photovoltaic system
G. Mahesh
1and M. Sreenivasulu
21
PG scholar, Electrical and Electronics Engineering, Vasavi college of engineering, Hyderabad, Telangana, India.
2
Assistant Professor, Electrical and Electronics Engineering, Vasavi college of engineering, Hyderabad, Telangana, India.
[email protected],[email protected]
ABSTRACT
The Solar power mainly depends on the weather conditions. Many new algorithms have been
projected to track the maximum power point (MPPT) of the solar system. In this paper utilization of
a boost converter for control of photovoltaic power using Maximum Power Point Tracking (MPPT)
control mechanism is presented. For the main aim of the project, we use boost converter along with
the Maximum Power Point Tracking control mechanism. The MPPT is used to extract the maximum
power from the photovoltaic cell and feed it to the load through the boost converter which steps up
the voltage to required magnitude. The main aim is to track the maximum power point of the
photovoltaic module so that the maximum power can be extracted from it. The algorithms utilized
for MPPT are generalized algorithms and are easy to model or use as a code, and these are namely
Perturb and Observe algorithm, Incremental Conductance algorithm, Fuzzy Logic controller
algorithm, Particle Swarm based optimization algorithm. This paper presents these algorithms
applied to Boost converter. From the MATLAB simulation results, it can be seen that the Particle
Swarm based optimization algorithm offers better efficiency than the other methods.
KEYWORDS:
MPPT, Particle Swarm based optimization algorithm.*Corresponding author
G. Mahesh
PG scholar, Electrical and Electronics Engineering,
Vasavi college of engineering, Hyderabad, Telangana, India.
INTRODUCTION
Solar energy is becoming much popular in various applications associating to heat, light, and
electricity. It is especially attractive due to its abundance, renewability, cleanliness and the
environmentally-friendly nature. Oneof the significant technologies of solar energy isphotovoltaic
(PV) technology which changes irradiation directly to electricity with the PV effect. However, it can
be understood that the solar PV panels have some disadvantages such as low conversion efficiency
(9% to 17%) and the effects of various weather conditions. V-I characteristic of a solar cell is
non-linear, and it varies with irradiation and temperature1. Generally, there is a single point on the V-I or
V-P curve called Maximum Power Point (MPP). That means that a solar PV panel will operate with
maximum efficiency and produces maximum output power. The Maximum Power Point is known on
a V-I or V-P curve, and it can be located with the help of search algorithms such as Perturbation and
Observation (P&O) algorithms2,3,4,5,6,7, the Incremental Conductance (InC) algorithm8,9, the Fuzzy
Logic (FL) algorithm10,11, and Particle Swarm Optimization (PSO) algorithm12,13.These algorithms
have many advantages and disadvantages involving simplicity, convergence speed, extra-hardware,
and cost. This paper presents Particle Swarm Optimization algorithm for tracking an MPP on V-I
characteristic of the solar PV panel. Based on the MPPT, the solar PV panel is always guaranteed to
work in an adaptive and optimal condition.A Control strategy for a solar PV panel based on the MPP
tracker (MPPT) with the Particle Swarm Optimization algorithm is presented. The simulation results
then follow to confirm the effectiveness of the PSO algorithm.
PV CELL
Solar cells (as the name implies) are intended to convert (at least a portion of) available light
into the electrical energy. They do this conversion without the use of chemical reactions and moving
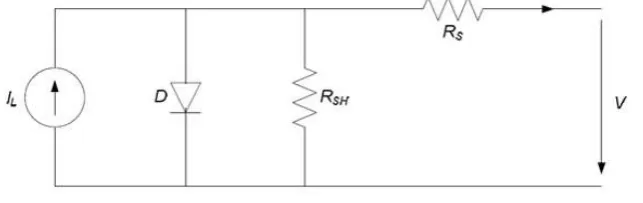
parts.The electronic arrangement of a solar cell can be inferred by building a model which is
electrically equal and is based on discrete ideal electrical components whose performance is
well-known. An ideal solar cell is modeled by a current source in parallel with a diode. As in practice, no
solar cell is ideal, so we add a shunt resistance and a series resistance component to the model.
From equivalent circuit diagram, it is evident that the electric current produced by the solar
cell is equal to that produced by the electric current source, minus that of which flows through a
diode, minus that which flows through a shunt resistor.
(1)
Where
I = output current
= photogenerated current
= diode current
= shunt current
The electric current through these elements is governed by a voltage across them
(2)
= voltage across both diode and resistor
= voltage across the output terminals
I = output current
RS =series resistance
By the Shockley diode equation, the current diverted through the diode is:
(3)
= reverse saturation current
n = Diode ideality factor (1 for ideal diode)
k =Boltzmann's Constant
T = Absolute Temperature
thermal voltage at 25° C, ≈ 0.0259
By Ohm's law, the current diverted through the shunt resistor is:
Substituting these into the first equation, that produces a characteristic equation
(5)
MAXIMUM POWER POINT TRACKING
Maximum power point tracking(MPPT) is a technique used commonly with wind turbines
and photovoltaic (PV) solar systems to maximize the power extraction under various conditions.
Although solar power is mainly related to this MPPT, the principle generally applies to the sources
with variable power. The various algorithms are reviewed followed by a description of the Particle
Swarm Optimization algorithm.
P&O algorithm
The Perturb&Observe algorithm is also known as "hill-climbing", but both refer to the same
algorithm depending on how it is implemented. Hill-climbing involves a perturbation on a duty cycle
of the power converter and P&O the perturbation in the operating voltage of a DC link between the
PV array and the power converter. In case of the Hill-climbing, perturbing the duty cycle of the
power converter implies modifying the voltage of the DC link between the PV array and the power
converter, so both names refer to the same technique.
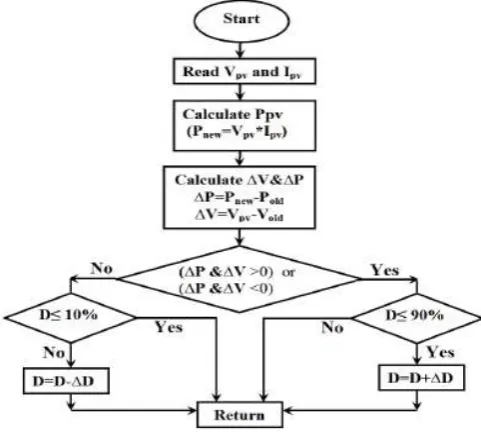
The Perturb & Observe algorithm states that when an operating voltage of the PV panel is
perturbed by a small increment if resulting change in power P is positive, then we are going in the
direction of MPP and we keep on perturbing in the same direction. If P is negative, we are going
away from the direction of MPP and the sign of perturbation supplied has to be changed.The
Fig 2:Flowchart of P & O algorithm
Incremental conductance (InC) Algorithm
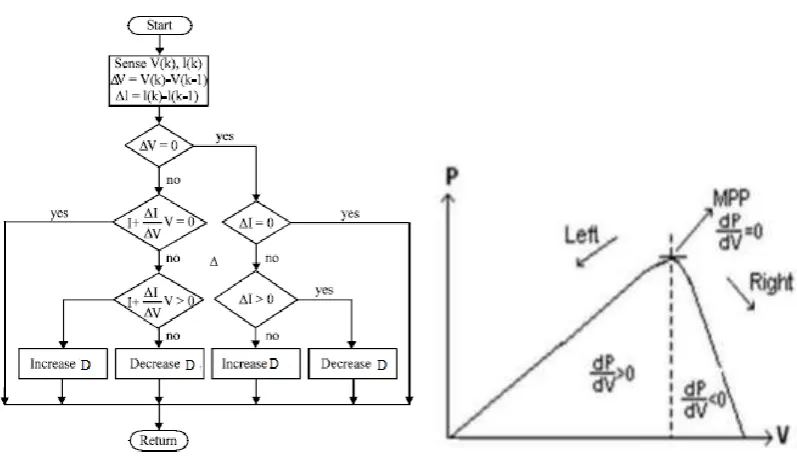
The principle of the Incremental algorithm is that the derivative of the power concerning
the voltage or current becomes zero at the Maximum Power Point, the power increases with the
voltage in the left side of the Maximum Power Point and the power decreases with the voltage in the
right side of the Maximum Power Point. This description can be written in the following simple
equations:
(6)
(7)
(8)
Fig 3: Flowchart and description of Incremental Conductance algorithm
At MPP
Right of MPP
Left of MPP
Therefore, the voltage of the Photovoltaic panels can be adjusted relative to the voltage
corresponding to MPP by measuring the incremental conductance, di/dv and the instantaneous
conductance, I/V. It can be realized that the Incremental conductance algorithm overcomes the
oscillation about the MPP when it is reached. When di/dv=- I/V is satisfied, this means that the MPP
is reached and the operating point remains. Otherwise, the operating point must be adjusted, which
can be determined using the relationship between di/dv and -I/V.
i. Fuzzification: In this stage, the crisp input variables are transformed into linguistic
variables based on the MFs. In this work, the fuzzy control MPPT method has two input variables,
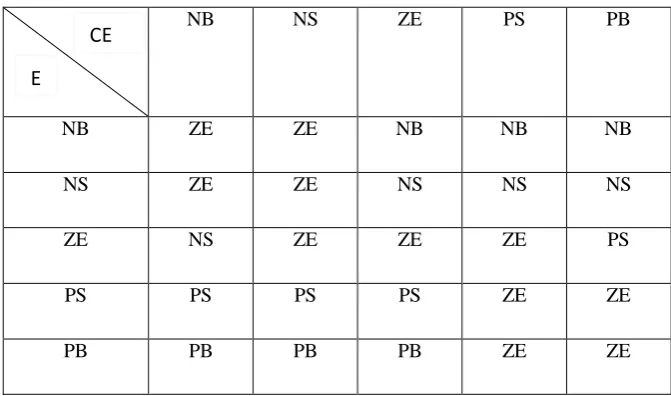
namely error (E) and change in error(CE), and one output variable, change in duty cycle(ΔD).There
are five different fuzzy levels are used for inputs and output variables [NB (negative big), NS
(negative small), ZE (zero), PS (positive small), and PB (positive big)]. Therefore, the proposed FLC
Table 1: Rule base
NB NS ZE PS PB
NB ZE ZE NB NB NB
NS ZE ZE NS NS NS
ZE NS ZE ZE ZE PS
PS PS PS PS ZE ZE
PB PB PB PB ZE ZE
The two input variables E and CE, at a sampling instant t are given by:
E(K)= (P(K)-P(K-1))/(V(K)-V(K-1)) (10)
CE(K)=E(K)-E(K-1) (11)
where P(k) and V(k) are the power and voltages of the solar system, respectively. Based on
these two inputs, FLC determines the next operating point depending on the used membership
functions and a rule table. The input E(k) provides information about how far the current operating
point is from that of the MPP, while the input CE(k) expresses how fast the operating points is
moving towards or far from the MPP. If the value of E(k) is greater than zero the controller changes
the duty cycle to increase the voltage until the power is maximum or the value (ΔP/ΔV) =0, if this
value less than zero the controller adjusts the duty cycle to reduce the voltage until the power is
maximum.
ii. Inference engine: Once E and CE are evaluated, they are transformed into linguistic
variables with five membership functions. After the classification of the values, a decision is made
based on a rule shown in Table 1(This table based on the DC-DC converter). These rules are stated
as (IF-THEN statements) and
the syntax is as follows:
IF (E is PB) AND (CE is NB)THEN (ΔD is PB).
iii. Defuzzification: The output of FLC is a fuzzy subset. As the real systems need a crisp value of
Control, defuzzification is needed. Defuzzifier is employed to transform the fuzzy linguistic sets
back into actual mathematical equivalents magnitude. This produces an analog signal that will
CE
control the DC-DC converter to the MPP. The defuzzification is carried out by using the centroid
method (weighted average method) which is expressed as:
(12)
where ΔD is the crisp value output value, Di is the center of maximum-minimum composition at the output MFs, μ(Dᵢ) is the maximum of the ith
membership function, Di is the ith
input value.
Particle swarm optimization(PSO):
Particle swarm optimization (PSO) algorithm refers to an optimization approach for the
public interest in society. It gained inspiration from the flocking behavior of birds or fish that
individuals communicate in such a manner that the entire population migrates toward the same target
in the same direction.
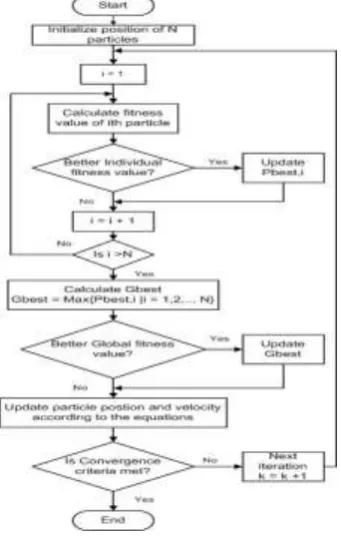
Overview of PSO algorithm:
1) N particles are initialized randomly in a search space.
2) Out of N particles, the ith particle is chosen and its fitness value (here we consider power of
each particle) is evaluated based on the objective function.
3) If individual fitness value of this solution outperforms its foregoing one, then its value
is updated.
4) Every particle is evaluated based on its present and foregoing individual fitness value.
5) values of all the individually evaluated particles are then considered and a global best
value is evaluated from them using equation (15).
6) For every particle, its position and velocity are updated using the equations (13) & (14)
respectively.
7) Iterations of this process are continued until a certain convergence criterion is reached.
Standard PSO equations are given as
Vi(K+1)=wVi(K)+C1rand1 (Pbest,i – Xi(K))+C2rand2 (Gbest – Xi(K)) (13)
Xi(K+1)=Xi(K)+Vi(K+1) (14)
Gbest=MAX {Pbest,i|i=1,2,……,N} (15)
w=0.001 = inertia weight
C1 =2= cognitive acceleration coefficient
C2 = 2= social acceleration coefficient
rand1, rand2 = random numbers between (0,1) distributeduniformly
Pbest,i= individual best fitness value(power) of ithparticle
Gbest= global best fitness value(power) of all particles
K = present iteration number
Vi(K) = ithparticle velocity in existing looping cycle
Vi(K + 1) = ithparticle velocityin next looping cycle
Xi(K) = ithparticle position in existing looping cycle
Xi(K + 1) = ithparticle position in next looping cycle.
SIMULATION AND RESULTS
Simulations are performed using MATLAB/SIMULINK software for tracking MPPs of the
solar PV array with panels, 2 in series and 4 in parallel whose specifications and parameters are in
Table 2. The solar PV panel provides a maximum output power at a MPP with VMPP and IMPP. The
MPP is defined at the standard test condition (STC) of the irradiation, 1 kW/m2 and module
temperature, 25℃ but this condition does not exist most of the time. The following simulations are
implemented to confirm the effectiveness.
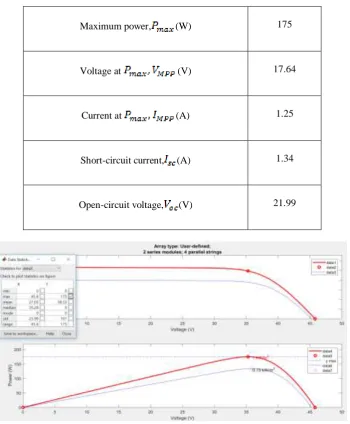
Table 2: Specifications of Solar cell
Maximum power, (W) 175
Voltage at (V) 17.64
Current at (A) 1.25
Short-circuit current, (A) 1.34
Open-circuit voltage, (V) 21.99
Fig 6: MATLAB simulation circuit of PV system
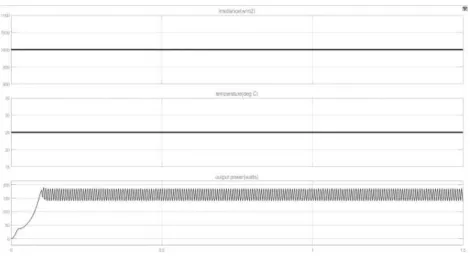
P&O result:
With various irradiances and temperatures, the output power for P & O algorithm are as
follows.
For irradiance=1000w/m2, temperature=25 deg C, the output power fluctuates between 140 watts
and 175 watts.
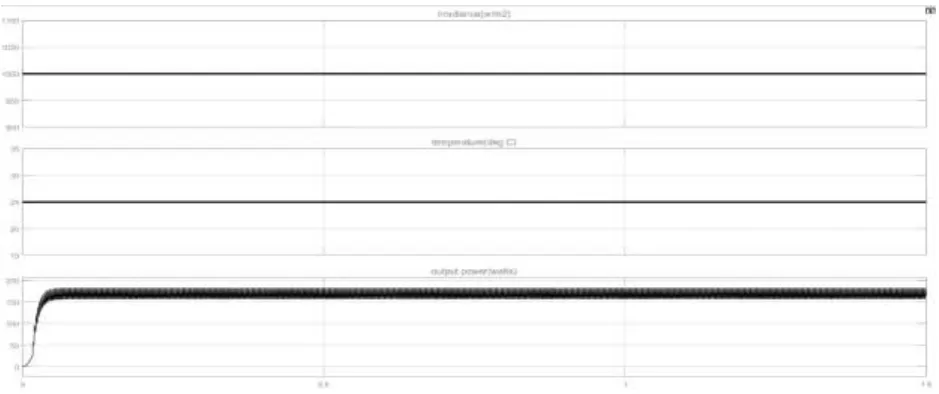
Incremental Conductance result:
With various irradiances and temperatures, the output power for Incremental Conductance
algorithm are as follows.
For irradiance=1000w/m2, temperature=25 deg C, the output power fluctuates between 155
watts and 180 watts.
Fig 8: InC algorithm Output Power with constant irradiance and constant temperature
Fuzzy logic result:
With various irradiance and temperatures, the output power for Fuzzy Logic algorithm are as
follows.
Fig 9: Fuzzy logic Controller algorithm Output Power with constant irradiance and constant temperature
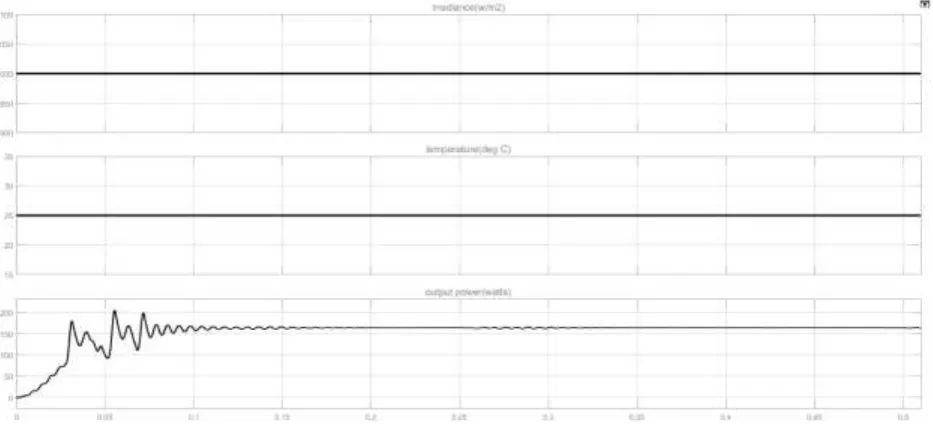
PSO result:
With various irradiance and temperatures, the output power for PSO algorithm are as follows.
For irradiance =1000w/m2, temperature = 25 deg C, the output power is 168 watts.
Fig 10: PSO algorithm Output Power with constant irradiance and constant temperature
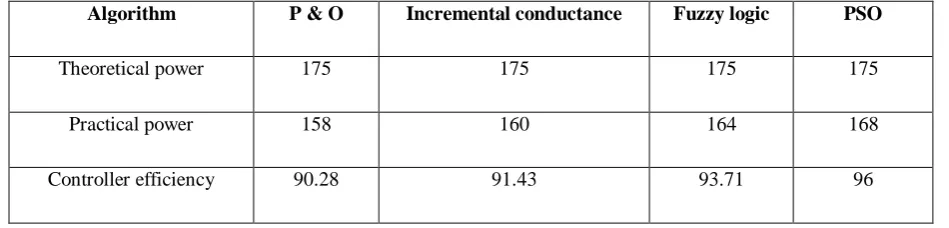
Controller efficiency = ; comparison of various algorithms at
Table 3: Comparison of Controller efficiency
Algorithm P & O Incremental conductance Fuzzy logic PSO
Theoretical power 175 175 175 175
Practical power 158 160 164 168
Controller efficiency 90.28 91.43 93.71 96
CONCLUSION
MPPT control strategy for a PV system ensure that the solar PV panel can harness the
maximum solar energy following the sun's trajectory from dawn until dusk and is always operated at
the MPPs with the MPPT algorithms. This paper presents various MPPT algorithms. They are, P &
O algorithm, Incremental conductance algorithm and Fuzzy logic algorithm and Particle Swarm
optimization algorithm. PSO algorithm gives better results compared to the previous three
algorithmswith an approximation which reduces the oscillations around MPP as well as increase the
efficiency of power extraction from PV system. This improvement overcomes the existing
drawbacksof the previous algorithms. The MATLAB simulation results confirm the effectiveness of
this control strategy in the PV system through the comparisons with other strategies.
REFERENCES
1. R. Faranda and S. Leva, “Energy comparison of MPPT techniques for PV systems,” Trans.
Power System, 2008; 3(6): 446-455.
2. R. Sridhar, S. Jeevananthan, N. T. Selvan and P. V. Sujith Chowdary, “Performance
improvement of a photovoltaic array using MPPT P&O technique,” Int. Conf. Control and
Comput. Technol., 2010;191-195,
3. N. M. Razali and N. A. Rahim, “DSP-based maximum peak power tracker using P&O
algorithm,” IEEE First Conf. Clean Energy and Technology, 2011; 34-39,.
4. L. Chun-Xia, L. Li-qun, “An improved perturbation and observation MPPT method of
photovoltaic system,” 4th IEEE Conf. Ind. Electron. and Appl., ICIEA 2009; 2966-2970.
5. Y. Jung, J. So, G. Yu and J. Choi, “Improved perturbation and observation method (IP&O) of
MPPT control for photovoltaic power systems,” 31st IEEE Photovoltaic Specialists
6. X. Liu, L. A. C. Lopes, “An improved perturbation and observation maximum power point
tracking algorithm for PV arrays,” IEEE 35th Annual Power Electron. Specialists Conf.,
2004; 2005-2010.
7. D. C. Huynh, T. A. T. Nguyen, M. W. Dunnigan and M. A. Mueller, “Maximum power point
tracking of solar photovoltaic panels using advanced perturbation and observation
algorithm,” IEEE Conf. Industrial Electronics and Applications 2013; 864-869.
8. B. Liu, S. Duan, F. Liu and P. Xu, “Analysis and improvement of maximum power point
tracking algorithm based on incremental conductance method for photovoltaic array,” 7th Int.
Conf. Power Electron. and Drive Syst., PEDS 2007; 637-641.
9. W. Ping, D. Hui, D. Changyu and Q. Shengbiao, “An improved MPPT algorithm based on
traditional incremental conductance method,” 4th Int. Conf. Power Electron. Syst. and Appl,
PESA2011; 1-4.
10.S. J. Kang, J. S. Ko, J. S. Choi, M. G. Jang, J. H. Mun, J. G. Lee and D. H. Chung, “A novel
MPPT control of photovoltaic system using FLC algorithm,” 11th Int. Conf. Contr., Autom.
and Syst., 2011; 434-439.
11.V. Padmanabhan, V. Beena and M. Jayaraju, “Fuzzy logic based maximum power point
tracker for a photovoltaic system,” Int. Conf. Power, Signals, Contr. and Comput.,
EPSCICON 2012; 1-6.
12.Md. A. Azam, S. A. A. Nahid, M. M. Alam and B. A. Plabon, “Microcontroller based high
precision PSO algorithm for maximum solar power tracking,” Conf. Electron. and Vision,
2012; 292-297.
13.K. Ishaque, Z. Salam, M. Amjad and S. Mekhilef, “An improved particle swarm optimization
(PSO)-based MPPT for PV with reduced steady-state oscillation,” IEEE Trans. Power