An Operational Framework
For Reverse Supply Chains
Rajesh Kumar Tyagi, HEC Montréal, Canada K. Kathy Dhanda, DePaul University, USA
Scott Young, DePaul University, USA
ABSTRACT
In this paper, we present a framework for reverse supply chains. We identify four managerial drivers in the reverse chain as Facilities, Handling, Ease of Access, and Information. We explore the impact of each of these drivers upon the effectiveness and performance of the overall reverse chain via a survey of supply chain managers. We present the results of the survey and conclude with managerial implications derived from the survey results. The field interviews have been supplemented with survey results. The results indicate that the firms, that have reverse supply chain as a strategic priority providing a responsive and effective transportation network and that have an easy return policy, are more likely to have the most reliable reverse supply chain. The results also indicate that reverse supply chain matters the most at the late growth stage of the product life.
Keywords: Reverse Logistics; Reverse Supply Chains; Managerial Framework
INTRODUCTION
upply chain management (SCM) research has focused upon the forward path from producer to customer. However, another important and emerging dimension of successful SCM is the reverse logistics process (Marien, 1988). Reverse Logistics (RL) is the process in which a manufacturer accepts products from consumers for possible remanufacturing (Bras and McIntosh, 1999), recycling, reuse, or disposal (Dowlatshahi, 2000, and Dowlatshahi, 2010). This would include the disposal of obsolete items, customer returns, or overstocked items. Rogers and Tibben-Lembke (2001) provided various definitions of reverse logistics, some of which were broader and included sustainability, revenue enhancement, and cost reduction as important goals. The management of the Reverse Logistics process has become especially important due to environmental concerns, cost savings, waste minimization and, ultimately, to increase revenues. Carter and Ellram (1998) state that three primary intra-organizational activities impact reverse logistics: commitment to environmental issues, ethical standards, and policy entrepreneurs who adopt an environmentally friendly philosophy. Srivastava (2007) also wrote a review on green supply chains that focused on the reverse logistics angle.
The RL process can make a profound impact on environmental efficiency through recycling, reuse, and reduction of the amounts of materials used (Carter and Ellram, 1998). RL also includes the reduction of materials in the forward system in such a way that fewer materials flow back, reuse of materials is possible, and recycling is facilitated. Reverse logistics has also been discussed in the context of recovery process for waste/byproduct stream (Pourmohammadi et al. 2008) and in terms of the logistics network and governance structure (Roy et al., 2006). In addition, reverse supply chains are increasingly being considered and prioritized as a corporate strategy to stay competitive (Marien, 1998, and Genchev, 2009).
OBJECTIVES
The objectives of this paper are three-fold: 1) to present an operational framework for reverse supply chains, 2) to develop a survey to test the validity of the managerial framework, and 3) to discover and validate managerial implications.
The managerial framework includes four drivers in the reverse chain that were extrapolated from the review of literature (Tibben-Lembke, 2002) and from in-depth field work (Tyagi et al, 2010). We shall discuss the impact of each of these four drivers upon the effectiveness and performance of the overall reverse chain. To this end, we will develop and use a reverse chain questionnaire that will address these four drivers by posing a series of questions aimed at the design (or redesign) of the new (or existing) facility.
FRAMEWORK
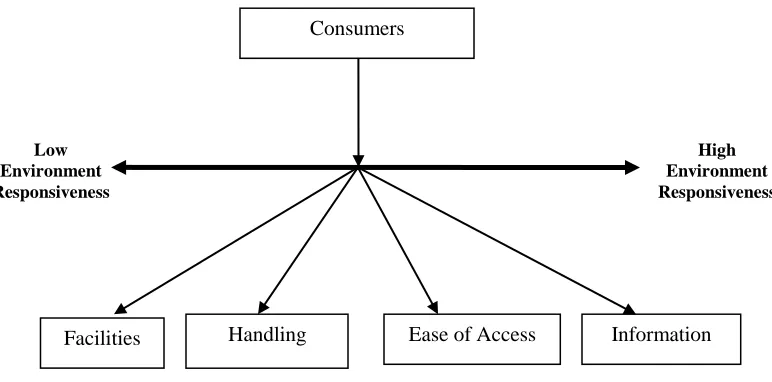
The framework provided in this article is inspired by the field work, extensive literature review, and previous work in the same area (Tyagi et al., 2010). Blackburn et al (2004) presented a framework for reverse supply chain and state that the strategic design of a reverse supply chain goes beyond facility choices. However, the framework did not incorporate key managerial operational drivers. Chouinard et al (2009) discussed reverse logistics decision-making frameworks that are mainly characterized according to the reverse logistics activities. Stock and Mulki (2009) tested hypotheses related to the importance of product returns, recovery values, and the resources expended in various stages of the product return process. We begin with a modification of the framework by adjusting the nature of the drivers as shown in Figure 1. We take the viewpoint of a company that is focusing on its reverse supply chain. The company articulates its competitive strategy, operations strategy, and supply chain strategy based on customer segments. The reverse supply chain strategy extends vertically to its partners, suppliers, and end consumers.
Figure 1: Conceptual Framework for Reverse Supply Chain Management
The four drivers that impact the reverse supply chain are: 1) facilities, 2) handling, 3) ease of access, and 4) information. The importance of these managerial drivers was validated at the interview stage and by case studies. We will describe each driver and associated questions posed by the consumers and the firm in the following section. Ease of access was considered an important driver based on the qualitative research. Ease of access describes access policies and various channels offered by the provider to end consumers for returning the product. The return could be a returnable container, a type of secondary packaging that can be used several times in the same form, as discussed by Kroon and Vrijens (1995). The handling driver replaces the transportation driver as it appears that the task of manipulating and moving (waste) material within an organization becomes key in the success of a reverse supply chain.
Consumers
Facilities Handling Ease of Access Information
Low Environment Responsiveness
Reverse logistics can be viewed as a means to reduce cost and increase revenue (Poist, 2000, and Ashayeri et al., 1996). The products that have been reclaimed by the company provide a new revenue stream through reuse, reconditioning, refurbishment, remanufacturing, and resale in secondary markets and auctions, or recycling (Mason, 2002). RL can also be viewed as a part of overall supply chain activities allowing a number of supply chain environmentally-friendly practices to be promoted and, within this viewpoint, several areas for change can be recommended to increase the impact of purchasing on environmental results (Walton, Handfield, and Melnyk, 1998). The majorities of research articles on reverse logistics focus on the study of tactical and operational aspects like production, planning, and inventory management, deriving from the implementation of a reverse logistics system. We anticipate that more research on strategic factors, such as marketing, competition, and technology, is needed in order to develop a theoretical framework for research (Rubio et al, 2008).
Interviews with supply chain managers, combined with the literature review, resulted in four research questions. The first question concerns the overall environment and the strategic significance of the reverse supply chain. We seek to examine the primary motivating factors for the adoption of RSC.
Research Question 1: Why do companies adopt reverse supply chain practices?
The next question relates to the product life cycle. At what stage of the product life cycle would one be likely to see product returns? For example, repair services (Amini et al, 2005) that require a short cycle time depend heavily on effective reverse logistic operations. We seek to examine the importance of RSC at various stages of product life cycle.
Research Question 2: What effect does the product life cycle have on the various managerial drivers, if any?
Reverse logistics has shown its potential in computer industry (Tan and Kumar, 2000), pharmaceutical industry (Krikke et al, 2004), catalog retailing (Autry and Richey, 2001), and electronics industry (Nagurney and Toyasaki, 2005). We would like to determine which type of industry seems to be more interested in reverse activities. To this end, we propose the following question:
Research Question 3: What type of industry is more likely to return, remanufacture, disassemble, and dispose of their products?
The following discussion relates to the impact of the four drivers on the effectiveness of the reverse supply chain.
Facilities
The facility driver refers to the location where returned products are collected and processed or stored. Facility decision is a long term-decision and is usually decided at the design stage, having a direct impact on the overall cost of the system. For example, Mutha and Pokharel (2009) discussed the network design from the OEM‟s point of view. In order to get maximum value from their used products, OEMs need to collect used products through a network designed for reuse, remanufacture, recycle or disposal. In addition, the products need to be designed for disassembly so that these can be reused or recycled. Furthermore, the facilities that can handle returns ought to be located at a place convenient for the customer. Some questions are:
1. How much space is available?
2. Is the facility located in-house or at a third party location?
3. Are there locations that are close to the customer for ease of returns?
Handling
Handling drivers refer to the segregation, containerization, and internal transportation of used or waste material. Handling is an important driver that helps a particular firm attain the desired effectiveness of the RS chain. The lack and importance of effective and efficient performance of distribution functions - similar to the handling driver - was identified by Giultinian and Nwokoye (1975). Jahre (1995) suggests that recycling research suffers from a lack of theory. While reviewing research on recycling and reverse logistics, Jahre (1995) stated that recycling research suffers from a lack of theory and discussed the separation of waste. With regard to where separation of waste should take place, it should be near the consumer or in a central processing facility. Some relevant questions are:
1. How are streams segregated?
2. What is the extent of the segregation?
3. How are handling practices communicated company-wide? 4. Is the product bulky or fragile or not-amenable to transport? 5. What are the primary means of Handling?
6. Are the returns sent through in-house fleet or through a third-party transportation provider?
7. Does the company use the same transportation provider for the returns as the one used for the transportation of the original product?
Ease of Access
This driver, that measures self reported perception of the customers, refers to ease of access policies for the consumer, access channels provided, and availability of information about this channel. Ease of access looks at the customer-initiated returns and measures the ease from the customers‟ perspectives. We consider this driver to be equally important and often a deciding factor in the success or failure of a reverse supply chain system. This driver was consistently mentioned in our initial interviews with the supply chain managers. However, this driver has not been explicitly included in other studies. In addition, Ease of Access also looks at the sourcing and channel management policies together. Sourcing of all products, whether for recovery, reuse, remanufacturing, or other purposes, are considered in this driver. Kaiser et al. (2001) have shown the importance of the purchasing mechanism to promote the use of environmentally preferable products in the health care industry. A firm needs to have a policy in terms of who it will use, what policies from a consumer side will guide the reverse flow, and what channels will be used for this return flow.
Morreli (2001) states that consumers will send back more products if the company makes it easier to do so. However, if the process of returns is difficult or non-existent, then there is a higher chance that the company will lose its customers. An example is from Land‟s End where a liberal policy has led to a high (30-50%) return rate (Meyer, 1999). Stock (1998) states that how companies manage their returns can also be a competitive differentiator adding that this could be a new area to exploit for increased efficiencies. The survey conducted by Rogers and Tibben-Lembke (2001) shows the importance of speed of disposition in the design of reverse logistics structures. Blumberg (1999) also identified the importance of various distribution channels for reverse logistics and repair services.
Information
In conclusion, we seek to determine whether the four key drivers have an impact on the overall reverse chain. There are other factors that should be included in the framework. However, the framework will become very complex and we leave the inclusion of additional factors for future research. One of these drivers that was considered during the interviewing stage is sourcing. The sourcing driver includes decision about supplier selection, management, and sourcing or outsourcing of the various materials and components of the reverse supply chain structure. The important questions, while designing sourcing, are:
1. How does one select suppliers?
2. Should there be a few or many suppliers? 3. How often is supplier selection reviewed?
Firms are increasingly putting an emphasis on environmental responsiveness of a supplier during the selection process.
The last research question seeks to test the overall design of the reverse supply chain.
Research Question 4: The four drivers (facilities, handling, ease of access, and information) are all positively related to the effectiveness of the reverse supply chain.
SURVEY DESIGN METHODOLOGY
A survey was designed using a two-step process. In the first step, 20 supply chain managers representing different sectors were interviewed. Interviewee titles included Supply Chain Manager, Reverse Supply Chain Manager, Operations Manager, Purchasing Manager, etc. Some interviews were conducted face-to-face and others were conducted via telephone. The second step included designing a detailed questionnaire and conducting a survey of (reverse) supply chain managers. A web-based survey was fielded using the SurveyZ instrument (www.surveyz.com). Respondents were recruited from a sample list provided by professional organizations and associations in the United States. The respondents were recruited from various industries, such as Consumer packaged goods, communications, manufacturing, technology, pharmaceuticals, and start-up firms. An initial mailing was sent out, followed up by a reminder call after a three-week period. In total, we obtained 132 valid responses for a response rate of 11%.
The survey consisted of four parts. The first part included information about the company (size, sector, and business unit size) and the product (revenue from the product, life cycle, and innovation). The second part included questions related to the drivers of reverse supply chain management organization, including facilities, handling, ease of access, and information activities. The third part covered questions related to metrics and outcome measures. This part also included questions on self-assessment of the reverse supply chain management performance of the company relative to competitors in the industry. The final part obtained demographic data about the respondent, contact information, the title of the job, the years of experience, etc.
DATA ANALYSIS
The data analysis was conducted in four simple steps. The first step included descriptive analysis of the data collected. Various descriptive variables, such as sector, annual revenue of business unit, and maturity of product portfolio, were paralyzed. The second step involved analyzing the impact of various business contexts on key managerial drivers (bi-variate analysis). In the third step of the analysis, we conducted factor analysis. Finally, the fourth and final step of analysis involved the construction of a causal regression model based on the previously presented conceptual model.
RESULTS
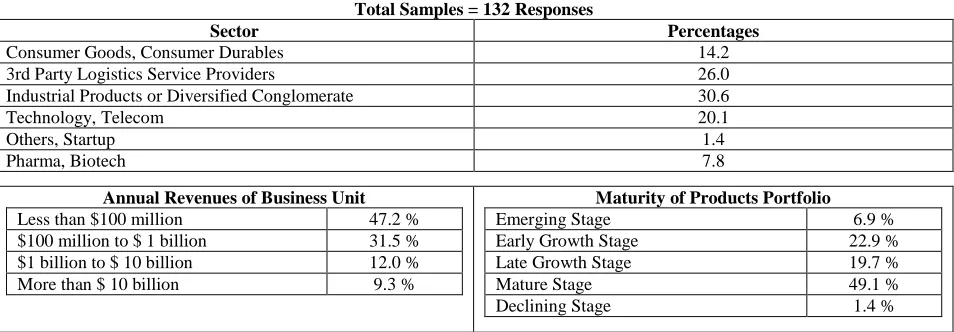
The descriptive information about the collected dataset is presented in Tables 1 and 2. Results were tested for non-response bias. Early and late responses are similar. Table 1 presents the results from 132 valid survey responses. The survey questions are based on a scale of 1-7 with 1 representing” strongly disagree” and 7 representing “strongly agree”. The Cronbach‟s Alpha value was 0.815 for survey items. The majority of the responses were from sectors of industrial products, 3rd part logistics service providers, consumer packaged goods, and technology companies. The annual revenues of about half of the firms are below $100 million and about half of the companies had their product portfolio at a maturity stage.
Table 1: Survey Data Information Total Samples = 132 Responses
Sector Percentages
Consumer Goods, Consumer Durables 14.2
3rd Party Logistics Service Providers 26.0
Industrial Products or Diversified Conglomerate 30.6
Technology, Telecom 20.1
Others, Startup 1.4
Pharma, Biotech 7.8
Annual Revenues of Business Unit
Less than $100 million 47.2 % $100 million to $ 1 billion 31.5 % $1 billion to $ 10 billion 12.0 % More than $ 10 billion 9.3 %
Maturity of Products Portfolio
Emerging Stage 6.9 %
Early Growth Stage 22.9 %
Late Growth Stage 19.7 %
Mature Stage 49.1 %
Declining Stage 1.4 %
Table 2a presents results for self-assessment and Table 2b shows performance outcome metrics. The respondents think of themselves as average. These results state that ease of access and profit are two most important metrics. Based on the field interviews, the metrics for ease of access is not commonly captured. However, managers agree on the importance of this key driver. Furthermore, even though firms are fairly good at adapting to changes in the marketplace, they are reluctant to admitting that they are a best practice firm. Table 2b also shows the importance of various metrics. Numerous indicators were used for the surveyed firms, such as financial (profit margin), efficiency (inventory turnover), and coordination (IT infrastructure).
Table 2a: Self-Assessment Results 1-Strongly Disagree – 7-Strongly Agree
Mean Std. Dev
Our company has the best people in reverse supply chain management 3.98 1.56 Our company has the best processes for reverse supply chain management. 3.89 1.53 Our company is good at adapting its reverse supply chain to changing customer needs 4.09 1.64 Our company provides a robust and reliable reverse supply chain 3.96 1.64 Overall, we are the best practice company in reverse supply chain management 3.80 1.71
Table 2b: Reverse Supply Chain - Performance Outcome Metrics 1-Strongly Disagree – 7-Strongly Agree
Mean Std. Dev
Profit (contribution) margin. 4.67 1.33
Inventory turnover 4.44 1.29
Ease of access for customers (post-service) 4.77 1.38
% Goods returned 4.31 1.31
% Goods reclaimed 4.25 1.29
Communication 4.62 1.34
The first research question posited, Why do companies adopt reverse supply chain practices? As evident from results presented in Table 3, the most important motivators for adopting a reverse supply chain are handling and information. The other key drivers seem to be environmental factors and ease of access. There is no clear winner in terms of motivator for the use of reverse logistics. Most firms rate themselves as average, as evident from the data. Also, there was no set of preferred performance metrics used to assess the performance of a reverse supply chain. Metrics, such as profit margin, inventory turnover, and communication and information technology infrastructure, are a few of the commonly used metrics.
Table 3: Survey Results for Drivers 1-Strongly Disagree – 7-Strongly Agree
Mean Std. Dev
Our company operates in a customer driven marketplace 3.82 2.13
Transportation methods are strategically selected at our company 4.71 2.05 Transportation for returned goods is managed by a third party provider 4.03 2.30 Company provides an easy way to its customer's to make return and collection 4.18 1.87 Ease of access and policies to access customers is a key strategic driver 4.28 1.98 Info is a key strategic driver for designing an effective RSC 4.53 2.04 Environmental factors and EPA (Environmental Protection Agency) regulations greatly
impact the way we operate our return supply chain
4.29 2.05
The concept of the reverse supply chain has been adopted by our firm primarily to reduce the cost of doing business
3.99 1.79
The second research questions posited, What effect does the product life cycle have on the various managerial drivers, if any? The data presented in Table 4 addresses this issue and presents how the stage of the product portfolio impacts various managerial decisions. The results indicate that companies focus more on the needs of their consumers as the product matures in its life cycle. Furthermore, companies focus more on the returns in the late growth stage of the product.
Table 4: Impact of Contextual Differences on Drivers
Our Company Operates in A Consumer/Customer-driven Marketplace where Consumers Demand that Used Goods be Returned, Remanufactured, Disassembled, and/or Disposed
1-Strongly Disagree - 7-Strongly Agree
Stage of Life Average Score (Scale 1-7)
Emerging stage 3.19
Early growth stage 4.13
Late growth stage 4.60
Mature stage 3.49
Declining stage 3.40
Our Company Provides an Easy Way for its Customers to Make Returns and Collections 1-Strongly Disagree – 7-Strongly Agree
Stage of Life Average Score (Scale 1-7)
Emerging stage 4.60
Early growth stage 3.67
Late growth stage 4.91
Mature stage 4.01
Transportation Methods (Train, Truck) are Strategically Selected at our Company 1-Strongly Disagree – 7-Strongly Agree
Stage of life Average Score (Scale 1-7)
Emerging stage 4.75
Early growth stage 4.78
Late growth stage 5.34
Mature stage 4.40
Declining stage 6.67
Our Company Operates the Most Cost Effective Transportation Network to Manage its Reverse Supply Chain 1-Strongly Disagree – 7-Strongly Agree
Stage of life Average Score (Scale 1-7)
Emerging stage 4.47
Early growth stage 3.72
Late growth stage 4.13
Mature stage 3.94
Declining stage 2.13
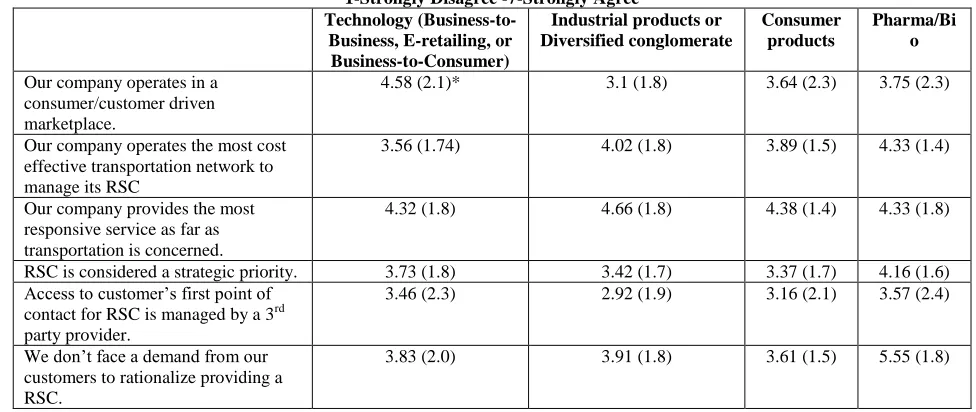
The third research question posited, What type of industry is more likely to return, remanufacture, disassemble, and dispose their products? The results from Table 5 indicate that technology companies place a higher importance on the consumer orientation of the RSC. In our survey, the technology companies included business-to-business, e-retailing, and business-to-consumers companies. The pharmaceutical/biotech firms, placing highest importance on the strategic priority on the RSC, also tend to place higher importance on the cost effectiveness of transportation network to manage the chain. On the other hand, most respondents believe that their firm provides an above average responsive service as far as transportation is concerned. Kroll et al (1995) discussed the ease of disassembly in a similar context. The life cycles in the technology sectors are considerably shorter and it is likely that more value could be extracted from returned products. On the other hand, pharmaceutical sectors, working in a business through hospital and service providers, tend to face less demand from customers to rationalize providing a RSC. Access to customer‟s first contact is more likely to be managed by a third-party provider in an industrial products sector.
Table 5: Impact of Contextual Differences on Drivers 1-Strongly Disagree -7-Strongly Agree Technology
(Business-to-Business, E-retailing, or Business-to-Consumer)
Industrial products or Diversified conglomerate
Consumer products
Pharma/Bi o
Our company operates in a consumer/customer driven marketplace.
4.58 (2.1)* 3.1 (1.8) 3.64 (2.3) 3.75 (2.3)
Our company operates the most cost effective transportation network to manage its RSC
3.56 (1.74) 4.02 (1.8) 3.89 (1.5) 4.33 (1.4)
Our company provides the most responsive service as far as transportation is concerned.
4.32 (1.8) 4.66 (1.8) 4.38 (1.4) 4.33 (1.8)
RSC is considered a strategic priority. 3.73 (1.8) 3.42 (1.7) 3.37 (1.7) 4.16 (1.6) Access to customer‟s first point of
contact for RSC is managed by a 3rd party provider.
3.46 (2.3) 2.92 (1.9) 3.16 (2.1) 3.57 (2.4)
We don‟t face a demand from our customers to rationalize providing a RSC.
3.83 (2.0) 3.91 (1.8) 3.61 (1.5) 5.55 (1.8)
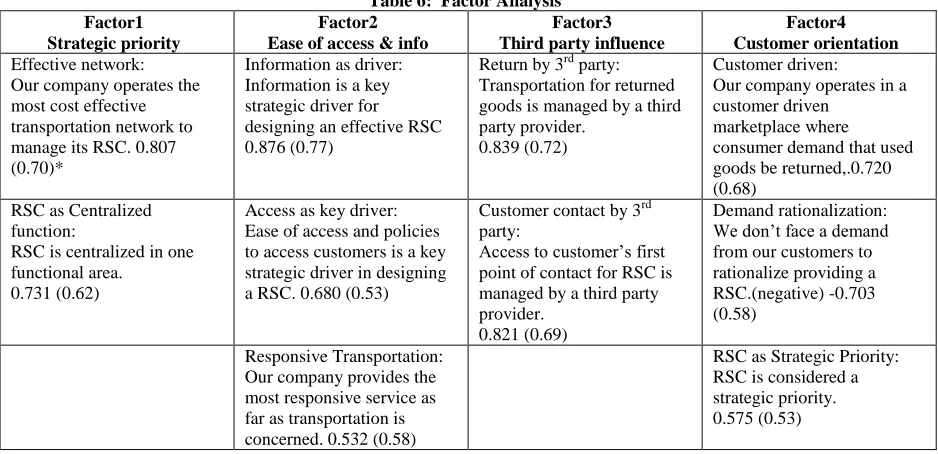
Next, a factor analysis was conducted. A confirmatory factor analysis revealed a four-factor model. We retained four factors by using a rule of thumb of eigenvalues >1.0. Varimax rotation was used to group related item questions into the appropriate factors. Four factors emerged: 1) network design 2) ease of access, 3) 3rd party logistics, and 4) consumer orientation of RSC. Table 6 provides details of loading for each factor and the uniqueness of each factor. The network design factor combines the elements of transportation network design and facility design. The ease of access factor incorporates the elements of information, responsive transportation network, and ease of access and policies. The third factor, 3rd party logistics, defines the factor leading to the use of 3rd party logistics to manage transportation and to manage customer access. The fourth factor, consumer orientation, defines the strategic priority of the RSC.
Table 6: Factor Analysis Factor1
Strategic priority
Factor2 Ease of access & info
Factor3 Third party influence
Factor4 Customer orientation
Effective network: Our company operates the most cost effective transportation network to manage its RSC. 0.807 (0.70)*
Information as driver: Information is a key strategic driver for designing an effective RSC 0.876 (0.77)
Return by 3rd party: Transportation for returned goods is managed by a third party provider.
0.839 (0.72)
Customer driven:
Our company operates in a customer driven
marketplace where consumer demand that used goods be returned,.0.720 (0.68)
RSC as Centralized function:
RSC is centralized in one functional area.
0.731 (0.62)
Access as key driver: Ease of access and policies to access customers is a key strategic driver in designing a RSC. 0.680 (0.53)
Customer contact by 3rd party:
Access to customer‟s first point of contact for RSC is managed by a third party provider.
0.821 (0.69)
Demand rationalization: We don‟t face a demand from our customers to rationalize providing a RSC.(negative) -0.703 (0.58)
Responsive Transportation: Our company provides the most responsive service as far as transportation is concerned. 0.532 (0.58)
RSC as Strategic Priority: RSC is considered a strategic priority. 0.575 (0.53)
*Factor Score (Uniqueness)
Regression Model
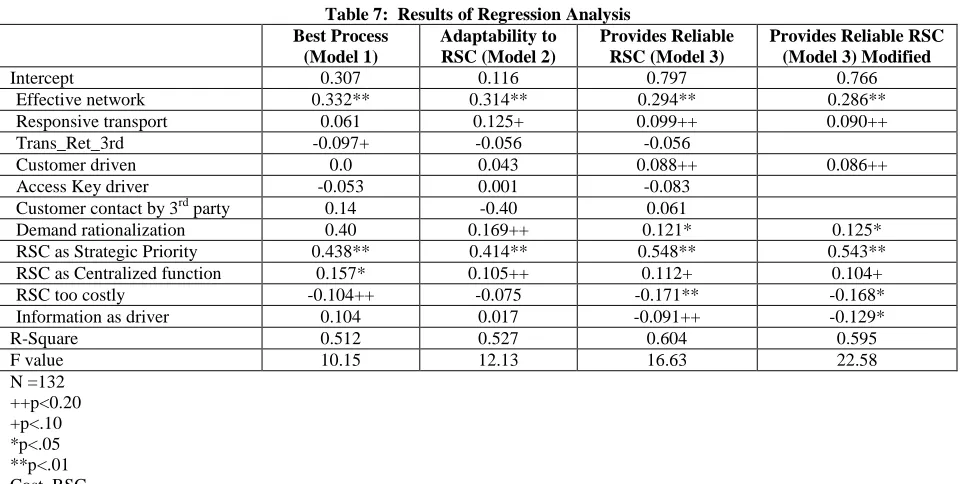
The next research question posited that the four drivers (facilities, handling, ease of access, and information) are all positively related to the effectiveness of the reverse supply chain. We tested the validity of this research question by using regression analysis and including managerial drivers as independent variables. We have included variables or managerial drivers that were significant in the factor analysis. In addition, we included dependent variables as outcome variables and independent variables as managerial drivers. The outcome measures included processes for best practices, reliability, and robustness of RSC and adaptability of RSC.
An exploratory regression indicated that few variables were non-significant. Then we ran regressions that included only the significant variables from the factor analysis. We attempt to predict the values of some of the questions mentioned in the survey: 1) Our company has the best processes for reverse supply chain management (Best practices), 2) Our company is good at adapting its reverse supply chain to changing customer needs (Adaptability), and 3) Our company provides a robust and reliable reverse supply chain (Reliable).
Table 7: Results of Regression Analysis Best Process
(Model 1)
Adaptability to RSC (Model 2)
Provides Reliable RSC (Model 3)
Provides Reliable RSC (Model 3) Modified
Intercept 0.307 0.116 0.797 0.766
Effective network 0.332** 0.314** 0.294** 0.286**
Responsive transport 0.061 0.125+ 0.099++ 0.090++
Trans_Ret_3rd -0.097+ -0.056 -0.056
Customer driven 0.0 0.043 0.088++ 0.086++
Access Key driver -0.053 0.001 -0.083
Customer contact by 3rd party 0.14 -0.40 0.061
Demand rationalization 0.40 0.169++ 0.121* 0.125*
RSC as Strategic Priority 0.438** 0.414** 0.548** 0.543**
RSC as Centralized function 0.157* 0.105++ 0.112+ 0.104+
RSC too costly -0.104++ -0.075 -0.171** -0.168*
Information as driver 0.104 0.017 -0.091++ -0.129*
R-Square 0.512 0.527 0.604 0.595
F value 10.15 12.13 16.63 22.58
N =132 ++p<0.20 +p<.10 *p<.05 **p<.01 Cost_RSC_
All three models show that the variable “reverse supply chain is considered a strategic priority at our firm” is highly significant with a p-value of lower than 0.0001. It is also the largest contributing variable with a coefficient of 0.438 (0.548 for model 3). The second important variable - “our company operates the most cost effective transportation network to manage its RSC” - is also highly significant in all three models. Variables related to “Ease of access”, “Ease of access and policies to access customers is a key strategic driver in designing a RSC”, and “Access to customer’s first point of contact for RSC is managed by a third party provider” were not significant in all three models. However, the variable, “our company provides the most responsive service as far as transportation is concerned,” was significant in models 2 and 3. “RSC as a centralized function” is significant in all three regressions at various confidence intervals. It is likely that awareness of responsiveness is considered at the back end (transportation network) and not as much on the front end (customer side). The first model has an R-Square value of 51.2% and an F Value of 10.15.
Model 2 shows the impact of various variables on the adaptability of RSC. We notice that variable “responsive transportation” becomes significant in this model. A negative sign with the coefficient of variable “RSC too costly” suggests that reverse supply chain is not considered as an added cost. The negative sign on variable “Customer contact by 3rd party” implies that a higher emphasis on 3rd party use to manage customer contact negatively impacts the adaptability or agility of the reverse supply chain. Other coefficients are similar to Model 1. This model has an R-Square value of 52.7% and an F Value of 12.13.
Model 3, presenting the impact of various drivers on the reliability of RSC, has the highest value of R-Square (60.4%). The three significant variables are “RSC as strategic priority”, “effective network”, and “RSC too costly.” A modified version of Model 3, including only significant variables, is also shown in the same table.
Looking at all three models, we observe that three variables are significant. These three variables, in the order of their importance, are RSC Strategic Priority, Effective network, and RSC too costly.
MANAGERIAL IMPLICATIONS, LIMITATIONS AND FUTURE WORK
Decide the strategic significance of the reverse supply chain: As a first step, managers need to evaluate the integration with the existing network and determine and communicate the importance of reverse logistics to all stakeholders. Yalabik et al. (2005) concluded that if a firm does not coordinate its logistics and marketing efforts to improve the overall returns system, the retailer will tend to over-invest in one of the functions and under-invest in the other.
Focus on the network design: The design of an effectivetransportation network to provide responsiveness is critical. As evidenced from the data analysis, all models included an effective network in the regression models. Firms that have reverse supply chain as a centralized function also tend to have best processes.
Late growth stage: The results indicate thatthe reverse supply chain matters the most at the late growth stage of the product life cycle.Therefore, managers need to pay extra attention to the effectiveness of RSC for mature products.
Drivers of RSC: The most important drivers for the RSC design are handling and information.
Also, there is no clear winner in terms of the motivator for the adoption of reverse supply chain.
Our field interviews support the findings of this study. To substantiate the findings in this study, we selected three hospitals in the Montreal, Quebec (Canada) region to identify the key implications for managers. The management of space and facility is a real challenge faced by these hospitals. The space requirement for reverse logistics competes with the requirement for the core business activities. The importance of handling as a driver was also identified by the managers at these hospitals. The extra handling of material could be considered a burdensome step by the employees and suggests the importance of greater ease of access to the reverse flow systems.
Our research has some limitations that deserve mention. The response rate to the survey, consistent with response rates typically obtained in similar survey research, was less than 20%. This raises the possibility of non-response bias (Siemiatycki and Campbell, 1984) and we ran a non-non-response bias tests that suggested that this does not significantly affect our study results. The low response rate is perhaps due to the fact that the survey was long and demanding and a relatively high level of expertise is required to answer the survey. The survey results rely on self-reports and the dependent variables (outcome measures) are self-reported, which could also lead to bias. Self-reported measures have several problems and issues (Podsakoff and Organ, 1986). To examine this issue, the study used a statistical procedure to control for common method variance called the Harman‟s one-factor test (Podasakoff and Organ, 1986). The results showed that one “general” factor did not account for the majority of the covariance, providing us with some evidence that self-report bias may not be an issue in our survey. Non-response bias was tested by comparing early and late survey results. No significant difference was evident.
Future research should incorporate drivers, such as sourcing, and present an integrated view of the reverse supply chain. Future research, using an extensive database, should validate the casual relationship between the drivers and the performance of the supply chain leading to improved corporate performance.
ACKNOWLEDGEMENTS
The authors would like to thank the University Research Council at DePaul University for their financial assistance with this project.
AUTHOR INFORMATION
Rajesh Kumar Tyagi is an assistant professor at HEC Montréal. He is the co-author of “Six Sigma for Transactions and Services” and authoring “Service Scorecard” book. Before moving to Montréal in 2008, Dr. Tyagi co-founded a biomedical device manufacturing company in Singapore. He obtained his PhD in Engineering at the University of Ottawa, Canada and MBA from The Kellogg School of Management, Northwestern University. E-mail: [email protected]. Corresponding author.
Texas and her doctorate in Management Science from University of Massachusetts at Amherst. E-mail: [email protected].
Scott Young is the chairman of the Department of Management at DePaul University in Chicago. He is the co-author of Managing Global Operations (1996) and the Essentials of Operations Management (2008). He obtained his ABJ at University of Georgia, his MBA at George College and State University, and his PhD at Georgia State University. Previously, he taught at University of Utah where he served as Associate Dean and Chairman of Management. E-mail: [email protected].
REFERENCES
1. Amini, M.M., Retzlaff-Roberts, D., & Bienstock, C.C. (2005). Designing a reverse logistics operation for short cycle time repair services. International Journal of Production Economics, 96 (3), 367–380.
2. Ashayeri, J., Heuts, R., & Jansen, A. (1996). Inventory management of repairable service parts for personal computers. International Journal of Operational and Production Management, 16 (12), 74–97.
3. Blackburn, J.D., Guide, V.D.R., Souza, G.C., & Van Wassenhove, L.N. (2004). Reverse Supply Chains for Commercial Returns. California Management Review, 46 (2), 6-22.
4. Blumberg, D.R. (1999). Strategic examination of reverse logistics & repair service requirements, needs, market-size and opportunities. Journal of Business Logistics, 20 (2), 141–159.
5. Bras, B., & McIntosh, M.W. (1999). Product, process, and organizational design for remanufacture – an overview of research. Robotics and Computer-Integrated Manufacturing, 15 (3), 167–178.
6. Carter, C.R., & Ellram, L.M. (1998). Reverse logistics: a review of the literature and framework for future investigation. Journal of Business Logistics, 19 (1), 85-102.
7. Chopra S., & Meindl, P. (2004). Supply Chain Management: Strategy, Planning, and Operation (2nd ed.). Upper Saddle River, NJ: Pearson Prentice Hall.
8. Chouinard, M., D‟Amours, S., & Ait-Kadi, D. (2005). Integration of reverse logistics activities within a supply chain information system. Computers in Industry, 56 (1) , 105–124.
9. Chouinard, M., Ait-Kadi, D., Van Wassenhove, L., & D‟Amours, S, (2009). Conceptual framework for the design and management of value loops – application to a wheelchair allocation context. Production Planning & Control, 20 (8), 703-723.
10. Daugherty, P.J., Richey, R.G., Genchev, S.E., & Chen, H. (2005). Reverse logistics: superior performance through focused resource commitments to information technology. Transportation Research, Part E, 41 (2), 77–92.
11. Dowlatshahi, S. (2010). A cost-benefit analysis for the design and implementation of reverse logistics systems: case studies approach. International Journal of Production Research, 48 (5), 1361-1380. 12. Dowlatshahi, S. (2000). Developing a theory of Reverse Logistics. Interfaces, 30 (3), 143-155. 13. Edwards, J.W., Lyons, A., & Kehoe, D. (2004). A web-based demand planning system (DPS) to enable
coordinated re-manufacture of automotive components. International Journal of Internet and Enterprise Management, 2 (4), 366-382.
14. Ferrer, G., & Katzenberg, M. (2004). Value of information in remanufacturing complex products. IEEE Transactions, 36 (3), 265-277.
15. Genchev, S.E. (2009). Reverse logistics program design: A company study. Business Horizons, 52 (2), 139-148.
16. Giultinian, J.P., & Nwokoye, N.G. (1975). Developing distribution channels and systems in the emerging recycling industries. International Journal of Physical Distribution, 6 (1), 28-38.
17. Hsu, H.S., Alexander, C.A., & Zhu, Z. (2009). Understanding the reverse logistics operations of a retailer: a pilot study. Industrial Management & Data Systems, 109 (4), 515-531.
18. Jahre, M. (1995). Household waste collection as a reverse channel. International Journal of Physical Distribution & Logistics Management, 25 (2), 39–55.
19. Kaiser, B., Eagan, P.D., & Shaner, H. (2001). Solutions to health care waste: life-cycle thinking and „green‟ purchasing. Environmental Health Perspectives, 109 (3), 205–207.
21. Kroon, L., & Vrijens, G. (1995). Returnable containers: an example of Reverse Logistics. International Journal of Physical Distribution and Logistics Management, 25 (2), 56-68.
22. Marien, E. J. (1988). Reverse logistics as competitive strategy. Supply Chain Management Review, 2 (1), 43-52.
23. Mason, S. (2002). Backward Progress. IIE solutions, 34 (8), 42-46.
24. Meyer, H. (1999). Many happy returns. The Journal of Business Strategy, 20 (4), 27-31.
25. Morreli, A.L. (2001). The forgotten child to the supply chain. Modern Materials Handling, 56 (6), 33-36. 26. Mutha, A., & Pokharel, S. (2009). Strategic network design for reverse logistics and remanufacturing using
new and old product modules. Computers and Industrial Engineering, 56 (1), 334-346.
27. Nagurney, A., & Toyasaki, F. (2005). Reverse supply chain management and electronic waste recycling: a multitiered network equilibrium framework for e-cycling. Transportation Research Part E: Logistics and Transportation Review, 41 (1), 1-28.
28. Podsakoff, P. M., & Organ, D.W. (1986). Self-reports in organizational research: Problems and prospects. Journal of Management, 12, 531-544.
29. Poist, R. (2000). Development and Implementation of RL Programs. Transportation Journal, 39 (2), 54. 30. Pourmohammadi, H. Rahimi, M., & Dessouky, M. (2008). Sustainable reverse logistics for distribution of
industrial waste/byproducts: A joint optimization of operation and environmental costs. Supply Chain Forum: An International Journal in Supply Chain Management, 9 (1), 2-17.
31. Reyes, P., Raisinghani, M.S., & Singh, M. (2002).Global Supply chain management in the
telecommunications industry: The role of information technology in integration of supply chain entities. Journal of Global Information Technology Management, 5 (2), 48-65.
32. Rogers, D. S., & Tibben-Lembke, R. S. (2001). An examination of reverse logistics practices. Journal of Business Logistics, 22 (2), 129-148.
33. Roy, J. Nollet, J., & Beaulieu, M. (2006). Reverse logistics networks and governance structure. Supply Chain Forum: An International Journal in Supply Chain Management, 7 (2), 58-67.
34. Rubio, S., Chamorro, A., & Miranda, F. J. Characteristics of the research on reverse logistics (1995-2005). (2008). International Journal of Production Research, 46 (4), 1099-1120.
35. Siemiatycki, J., & Campbell, S. (1984). Nonresponse bias and early versus all responders in mail and telephone surveys. American Journal of Epidemiology, 120 (2), 291-301.
36. Srivastava, S.K. (2007). Green supply-chain management: A state-of-the-art literature review. International Journal of Management Reviews, 9 (1), 53-80.
37. Stock, J.R. (1998). Development and Implementation of Reverse Logistics Programs, Council of Logistics Management, Oak Brook, IL.
38. Stock, J.R., & Mulki, J.P. (2009). Product returns processing: An examination of practices of manufacturers, wholesalers/distributors, and retailers. Journal of Business Logistics, 30 (1), 33-63. 39. Tibben-Lembke, R.S. (2002). Life after death: Reverse logistics and the product life cycle. International
Journal of Physical Distribution and Logistics Management, 32 (3), 223-244.
40. Tyagi, R.K., Vachon, S., Landry, S., & Beaulieu, M. (2010). Reverse supply chain in hospitals: Lessons from three case studies in Montreal. Chapter in Closed loop supply chains: New developments to improve the sustainability of business practices, Ed. By Ferguson, M.E., Souza, G.C., CRC Press.
41. Van Hoek, R.I. (2002). Using information Technology to leverage transport and logistics service operations in the supply chain: an empirical assessment of the interrelation between technology and operations management. International Journal of Technology Management, 23 (1/2/3), 207-220.
42. Walton, S., Handfield, R. B., & Melnyk, S. A. (1998). The green supply chain: integrating suppliers into environmental management processes. International Journal of purchasing & materials management, 34 (2), 2-11.