University of Pennsylvania
ScholarlyCommons
Publicly Accessible Penn Dissertations
Summer 8-13-2010
Quantitative Molecular MRI of Intervertebral Disc
Degeneration
Chenyang Wang
University of Pennsylvania, wangch@seas.upenn.edu
Follow this and additional works at:
http://repository.upenn.edu/edissertations
Part of the
Bioimaging and Biomedical Optics Commons
This paper is posted at ScholarlyCommons.http://repository.upenn.edu/edissertations/459 For more information, please contactlibraryrepository@pobox.upenn.edu.
Recommended Citation
Wang, Chenyang, "Quantitative Molecular MRI of Intervertebral Disc Degeneration" (2010).Publicly Accessible Penn Dissertations. 459.
Quantitative Molecular MRI of Intervertebral Disc Degeneration
Abstract
Degeneration of the intervertebral disc (IVD) is the most common cause of back-related disability among North American adults. Low-back-pain and associated disability costs the United States more than 100 billion dollars annually in health care expenditures and reduced productivity. The mechanism of IVD degeneration, especially its biomolecular aspect, is poorly understood in an in vivo setting. Thus there is increasingly a need for the non-invasive diagnosis and quantification of IVD degeneration. MRI is a non-invasive imaging modality capable of producing contrast sensitive to biomolecules. Therefore, the primary objective of this dissertation research project is to develop MRI techniques capable of non-invasive quantification of IVD biomolecular composition in vivo. We further developed three MRI techniques specifically for IVD imaging. Magnetization transfer (MT) MRI, T1ρ MRI and sodium MRI were first separately validated of their specificities for IVD biomolecular components. In doing so, we concluded that MT MRI is sensitive to IVD collagen content, T1ρ MRI is indicative of IVD osmotic pressure, and sodium MRI is sensitive to IVD proteoglycan (PG) content. Next, we applied all three techniques to human subjects in vivo. Due to the inherently low signal-to-noise ratio (SNR) efficiency of sodium MRI, we engineered a custom
radio-frequency (RF) surface coil for sodium MRI of human lumbar spine on a 7 T MRI scanner. Cross-correlation of the MT MRI, T1ρ MRI and sodium MRI data with the corresponding Pfirrmann grade revealed that the relative collagen density of IVD increases with degeneration, the IVD osmotic pressure decreases with degeneration, and the IVD PG content decreases with degeneration. By establishing that in vivo MT MRI, T1ρ MRI and sodium MRI can be used to quantify multiple IVD biomolecular characteristics non-invasively, we open up the possibility to conduct longitudinal studies on human subjects as they undergo IVD
degeneration. The combination of MT MRI, T1ρ MRI and sodium MRI provides scientists and clinicians with the diagnostic tool to improve our understanding of IVD degeneration, which could benefit future treatment and prognosis of IVD degeneration.
Degree Type
Dissertation
Degree Name
Doctor of Philosophy (PhD)
Graduate Group
Bioengineering
First Advisor
Ravinder Reddy
Keywords
Subject Categories
QUANTITATIVE MOLECULAR MRI OF
INTERVERTEBRAL DISC DEGENERATION
CHENYANG WANG
A DISSERTATION
IN
BIOENGINEERING
Presented to the Faculties of the University of Pennsylvania in Partial
Fulfillment of the Requirements for the Degree of Doctor of Philosophy
2010
Supervisor of Dissertation Graduate Group Chairperson
Signature
____________________
Signature
____________________
Ravinder Reddy, PhD Susan S. Margulies, PhD
Professor of Radiology Professor of Bioengineering
Dissertation Committee
Andrew Tsourkas, PhD, Associate Professor of Bioengineering
Beth A. Winkelstein, PhD, Associate Professor of Bioengineering
Quantitative Molecular MRI of Intervertebral
Disc Degeneration
COPYRIGHT
2010
Dedicated to my parents for their support in my pursuit for education,
iv
ACKNOWLEDGEMENTS
I would like to thank my PhD advisor - Professor Ravinder Reddy
for his unwavering intellectual support for the past five years.
He genuinely believed in my potential from day one, and he has
played an instrumental part in helping me to discover my
interests in scientific research and in medicine. I owe a big
thank you to Ari Borthakur and Mark Elliott for their mentorship
at work and outside of work, but more importantly I am indebted
to them for their friendship. I want to thank my then fellow
graduate student - Walter Witschey for showing me the virtue of a
strong work ethic. I cannot thank Susan Colleluori enough for
helping me to navigate the maze of academic bureaucracy and also
for introducing me to Philadelphia’s unique cultural scene. I
would like to offer my sincere gratitude to my dissertation
committee of Professor Andrew Tsourkas, Professor Felix Wehrli
and Professor Beth Winkelstein. Their invaluable guidance over
the course of my dissertation project was crucial in ensuring
both its quality as well as its timely completion. At last, I
would like to thank my parents for giving me the opportunities to
pursue my education and my career in science. I could not have
ABSTRACT
QUANTITATIVE MOLECULAR MRI OF INTERVERTEBRAL DISC
DEGENERATION
CHENYANG WANG
Supervisor: Ravinder Reddy
Degeneration of the intervertebral disc (IVD) is the most common
cause of back-related disability among North American adults.
Low-back-pain and associated disability costs the United States
more than 100 billion dollars annually in health care
expenditures and reduced productivity. The mechanism of IVD
degeneration, especially its biomolecular aspect, is poorly
understood in an in vivo setting. Thus there is increasingly a
need for the non-invasive diagnosis and quantification of IVD
degeneration. MRI is a non-invasive imaging modality capable of
producing contrast sensitive to biomolecules. Therefore, the
primary objective of this dissertation research project is to
develop MRI techniques capable of non-invasive quantification of
IVD biomolecular composition in vivo. We further developed three
MRI techniques specifically for IVD imaging. Magnetization
transfer (MT) MRI, T1ρ MRI and sodium MRI were first separately
validated of their specificities for IVD biomolecular components.
vi
collagen content, T1ρ MRI is indicative of IVD osmotic pressure,
and sodium MRI is sensitive to IVD proteoglycan (PG) content.
Next, we applied all three techniques to human subjects in vivo.
Due to the inherently low signal-to-noise ratio (SNR) efficiency
of sodium MRI, we engineered a custom radio-frequency (RF)
surface coil for sodium MRI of human lumbar spine on a 7 T MRI
scanner. Cross-correlation of the MT MRI, T1ρ MRI and sodium MRI
data with the corresponding Pfirrmann grade revealed that the
relative collagen density of IVD increases with degeneration, the
IVD osmotic pressure decreases with degeneration, and the IVD PG
content decreases with degeneration. By establishing that in vivo
MT MRI, T1ρ MRI and sodium MRI can be used to quantify multiple
IVD biomolecular characteristics non-invasively, we open up the
possibility to conduct longitudinal studies on human subjects as
they undergo IVD degeneration. The combination of MT MRI, T1ρ MRI
and sodium MRI provides scientists and clinicians with the
diagnostic tool to improve our understanding of IVD degeneration,
which could benefit future treatment and prognosis of IVD
TABLE OF CONTENTS
CHAPTER 1: INTRODUCTION TO MAGNETIC RESONANCE IMAGING OF THE
INTERVERTEBRAL DISCS...1
1.1 SYNOPSIS...1
1.2 PHYSIOLOGY OF INTERVERTEBRAL DISC...1
1.2.1 Intervertebral Disc in Spinal Column...1
1.2.2 Anatomy of Intervertebral Disc ...3
1.2.3 Major Macromolecular Component – PG Aggrecan...6
1.2.4 Major Macromolecular Component – Collagen...7
1.2.5 Minor Macromolecular Components...9
1.2.6 Biomechanical Property of the Intervertebral Disc...10
1.3 INTERVERTEBRAL DISC DEGENERATION...11
1.3.1 Changes in Hydration...11
1.3.2 Changes in PG Aggrecan...11
1.3.3 Changes in Collagen...12
1.4 PARADIGMS OF AGE-‐DEPENDENT DEGENERATION AND DEGENERATIVE DISC DISEASE...12
1.5 SOCIO-‐ECONOMIC SIGNIFICANCE OF INTERVERTEBRAL DISC DEGENERATION...13
1.6 CURRENT DIAGNOSTIC METHODS FOR INTERVERTEBRAL DISC DEGENERATION...14
1.6.1 T1- and T2-Weighted MRI ...14
1.6.2 Thompson and Pfirrmann Grades ...14
1.6.3 Delayed Gadolinium Enhancement MRI of Cartilage (dGEMRIC)...15
1.6.4 Discography ...16
1.7 IMAGING TECHNIQUE -‐ T1ρ (SPIN-‐LOCK) MRI ...16
1.7.1 Spin-lock Pulse Implementation...16
1.7.2 T1ρ Relaxation Mechanism in IVD...17
1.7.3 T1ρ Contrast in Biological Tissues...18
1.7.4 Quantitative T1ρ Mapping ...19
1.8 IMAGING TECHNIQUE -‐ SODIUM MRI ...19
1.8.1 Spin Dynamics of Sodium Nuclei...19
1.8.2 Sodium Biexponential T2* Relaxation ...20
1.8.3 Advantages and Disadvantages of Sodium Magnetic Resonance Imaging...22
1.9 IMAGING TECHNIQUE -‐ MAGNETIZATION TRANSFER MRI...23
1.9.1 Two Proton Spin Pools Exchange Model ...23
1.9.2 Quantification of Magnetization Transfer...24
1.9.3 Magnetization Transfer in Articular Cartilage ...26
1.10 DISSERTATION OVERVIEW...28
CHAPTER 2: VALIDATION OF SODIUM MRI’S ROLE IN NON-INVASIVE MEASUREMENT OF PROTEOGLYCAN CONTENT IN INTERVERTEBRAL DISCS ... 32
2.1 SYNOPSIS...32
2.2 INTRODUCTION...33
2.3 METHODS...34
2.3.1 Sodium MRI of Bovine Intervertebral Disc ...34
2.3.2 Mapping [Na+]...36
2.3.3 Mapping FCD ...36
2.3.4 Proteoglycan Assay ...38
viii
2.3.6 Mapping [Na+] in vivo ...40
2.4 RESULTS...41
2.5 DISCUSSION...47
2.6 SUMMARY...50
CHAPTER 3: CORRELATION OF INTERVERTEBRAL DISC FCD AND T1ρ RELAXATION TIME CONSTANTS ... 51
3.1 SYNOPSIS...51
3.2 INTRODUCTION...52
3.3 METHODS...54
3.3.1 Bovine Specimen ...54
3.3.2 Sodium Magnetic Resonance Imaging Protocol...56
3.3.3 Mapping [Na+] in Bovine Intervertebral Disc...58
3.3.4 Calculating Bovine Intervertebral Disc FCD and Osmotic Pressure...59
3.3.5 Mapping T1ρ Relaxation Rate in Bovine Intervertebral Discs ...62
3.3.6 Image Processing and Data Analysis for Bovine IVD ...63
3.3.7 Statistical Analysis ...63
3.4 RESULTS...64
3.5 DISCUSSION...68
3.6 SUMMARY...72
CHAPTER 4: MAGNETIZATION TRANSFER RATIO MAPPING OF INTERVERTEBRAL DISC IN VIVO... 73
4.1 SYNOPSIS...73
4.2 INTRODUCTION...74
4.3 METHODS...79
4.3.1 Experimental Protocol...79
4.3.2 Effects of Off-Resonance Saturation Pulse Duration and B1 on Free Water Spin...79
4.3.3 Imaging Protocol ...82
4.3.4 in vivo Z-Spectra of the AF and the NP...83
4.3.5 IVD Pfirrmann Grading...83
4.3.6 Image Processing and Data Analysis ...84
4.4 RESULTS...85
4.5 DISCUSSION...92
4.6 SUMMARY...98
CHAPTER 5: MAPPING OF INTERVERTEBRAL DISC SODIUM BIEXPONENTIAL T2* RELAXATION AT 7 T ...100
5.1 SYNOPSIS... 100
5.2 INTRODUCTION... 101
5.3 METHODS... 102
5.3.1 Bovine Specimen ... 102
5.3.2 Sodium MR Imaging Protocol for Bovine IVDs ... 103
5.3.3 Calculating Sodium Biexponential T2* Relaxation... 104
5.3.4 Data Processing and ROI Analysis... 106
5.3.5 PSF Analysis of UTE Sodium Images ... 106
5.4 RESULTS... 107
5.5 DISCUSSION... 114
5.6 SUMMARY... 117
6.1 SYNOPSIS... 119
6.2 INTRODUCTION... 119
6.3 METHODS... 121
6.3.1 Human Subject Recruitment... 121
6.3.2 Sodium MRI Protocol ... 121
6.3.3 T2 Relaxation Correction ... 123
6.3.4 B1 Inhomogeneity Correction ... 125
6.3.5 Computing [Na+] ... 128
6.3.6 Pfirrmann Grading... 129
6.3.7 Self-Coregistered Lumbar IVD MTR and T1ρ Mapping ... 130
6.3.8 Statistical Analysis ... 131
6.4 RESULTS... 132
6.5 DISCUSSION... 136
6.6 SUMMARY... 138
CHAPTER 7: DISSERTATION SUMMARY ...140
x
LIST OF TABLES
Table 5-‐1. A table of the three IVD samples’ NP ROI biexponential relaxation parameters and the squared correlation coefficients of the exponential fits for the T2l and T2s relaxations. The average
relaxation parameter values of the three IVD samples are reported in the table as well...109
Table 5-‐2. A table of the PSF FWHM measures of IVD sodium’s T2s, T2l and biexponential relaxation at
BW = 25~400 Hz/Pixel. ...113
Table 6-‐1. Table of Pearson correlation coefficients between all possible combination pairs of IVD NP MTR, T1ρ, [Na+] and Pfirrmann grades...135
LIST OF ILLUSTRATIONS
Figure 1-‐1. A graphical depiction of the IVD within a motion segment of the spine, showing both the NP and AF between the cartilaginous endplates of the vertebral bodies(Raj 2008). ...2
Figure 1-‐2. Diagram showing collagen fiber orientations within the lamellar structures of the AF. The typical dimensions of a healthy human lumbar IVD are shown in the diagram(Raj 2008). ...4
Figure 1-‐3. Diagram of the biochemical composition of the NP, showing aggregating PG monomers, type II collagen fibers, and encapsulated chondrocytes(Raj 2008)...5
Figure 1-‐4. Overall structure of the PG aggrecan showing PG monomers attached to a HA chain. The detailed structure of a single PG monomer is shown on the right(Gunzburg, Szpalski and Andersson 2004)...6
Figure 1-‐5. Diagram of the T1ρ magnetization preparation pulse cluster, which is composed of two
opposite-‐phase spin-‐lock pulses enclosed by a pair of 90o pulses... 17
Figure 1-‐6. A diagram of sodium spin-‐3/2 nuclear energy states’ Zeeman splitting pattern with nuclear quadrupole interaction averaged to zero (A) and with non-‐zero nuclear quadrupole interaction (B). Note that the presence of nuclear quadrupole interaction creates three distinct spectral peaks. ωQ is the nuclear quadrupole interaction frequency(Borthakur et al. 2006)... 21
Figure 1-‐7. A diagram of the two-‐pool model of MT. The gray volume in pool A (free protons) and B (macromolecule-‐bound protons) represents saturated spins. RA and RB represent the T1 relaxation
rates of the free... 23
Figure 1-‐8. Absorption spectra of the restricted pool proton spins (dashed line) and the free water pool proton spins (solid line). The placement of the off-‐resonance saturation pulse is marked by the solid arrow... 25
Figure 1-‐9. Diagram of the MT effect as a function of off-‐resonance frequency for a 4% agarose phantom. The graph shows both the direct saturation effect (Mdir) and the MT effect (MMT), which is
represented by the shaded region(Henkelman et al. 2001). ... 26
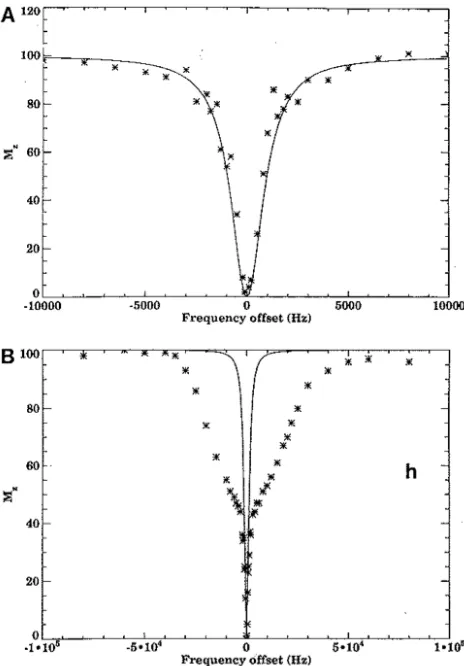
Figure 1-‐10. Diagram showing the direct saturation effect and MT effect of (A.) PG and (B.) collagen. The solid line shows the simulated direct saturation effect of the off-‐resonance pulse on the bulk water magnetization, while the crosses mark the measured bulk water magnetization of the PG and collagen phantoms with potential contribution from MT effect(Kim et al. 1993). ... 27
Figure 2-‐1. A photo of a dissected disc, with an overlay showing the numbered locations of the hole punches removed for the PG assay. The boundary between the AF and the NP compartments are marked... 38
Figure 2-‐2. A 3D rendered volumetric representation of a disc, followed by an anterior cutaway section depicting both coronal and sagittal [Na+] variation of the disc. The dashed lines show where
the cutaway section was extracted from the whole disc. ... 42
Figure 2-‐3. A series of consecutive axial [Na+] maps of a disc. Note the variation of [Na+] from high
values (>300mM) in the NP to <100mM in the AF and this is observed in all three planes... 43
Figure 2-‐4. A series of consecutive axial FCD maps of the same disc from the previous figure. Note that higher FCD (more negative) is correlated with higher [Na+], as shown in the previous figure... 44
Figure 2-‐5. Plot of [Na+] vs. [PG], the standard deviation of each ROI measurement is graphed as the
xii weight (ww). The dashed line represents the linear regression fit. The linear regression fit yielded a significant correlation (r=0.71 and p<0.05)... 45
Figure 2-‐6. The averaged disc zonal profile (averaged across all four discs) of the [Na+] measured
from PG assay and the [Na+] computed from sodium MRI in A.) the left-‐to-‐right direction and B.) the
anterior-‐to-‐posterior direction. The inter-‐disc standard deviations are graphed as the error. ... 46
Figure 2-‐7. Subject A is a 22-‐year-‐old subject with a history of lower back trauma. Subject B is a 26-‐ year-‐old asymptomatic subject. For each subject, the gray-‐scale T2–weighted MR image is shown on
the left and the colored [Na+] map is shown on the right... 47
Figure 3-‐1. Diagram of the imaging platform used for the self-‐coregistered sodium and T1ρ MRI. The
body of the platform is secured onto the MRI scanner bed using a strap. The IVDs samples are placed at the sample station at the end of imaging platform, where a Velcro strap firmly secures the IVD sample to the imaging platform. The sodium and proton birdcage RF coils can then be slipped over the IVD sample in succession, without disturbing the sample itself. Additional sandbags are placed at the base of the imaging platform to further dampen vibrations contributed by gradient activity during the imaging sessions... 55
Figure 3-‐2. An axial plane sodium image of a representative IVD, surrounded by five sodium
phantoms containing different concentration of sodium... 57
Figure 3-‐3. Four consecutive axial slices of an IVD’s [Na+] map. Note the decrease in [Na+] going from
the center of the NP toward the AF. Ventral side of the IVD faces up... 65
Figure 3-‐4. Four consecutive axial slices of an IVD’s T1ρ map. Note the decrease in T1ρ going from the
center of the NP toward the AF. Ventral side of the IVD faces up... 66
Figure 3-‐5. (A) A plot of IVD NP FCDeffective measurement vs. the corresponding T1ρ relaxation time
constant. The solid line represents the linear regression line of the scatter plot, with a correlation coefficient of 0.56 at p<0.01. (B) A plot of IVD NP osmotic pressure measurement vs. the T1ρ
relaxation time constant. A power regression fit was applied to the scatter plot, yielding a correlation coefficient of 0.72 at p<0.01... 67
Figure 4-‐1. Diagram depiction of the complete proton magnetization transfer mechanism incorporating cross dipolar relaxation, chemical exchange, and proton diffusion. The restricted protons in collagen interact with collagen-‐bound water protons via dipolar cross relaxation and chemical exchange, which contribute to the broad spectral width of the collagen-‐bound water protons. The collagen-‐bound water protons are at the same time in an exchange equilibrium with the free water protons via simple diffusion... 75
Figure 4-‐2. Frequency spectra of the collagen-‐bound protons with restricted motion (dashed line) and the free water protons (solid ... 76
Figure 4-‐3.The dependency of free proton saturation ratio on B1 field strength is illustrated in the
simulated plot in (A). The change in saturation ratio with respect to duration of the off-‐resonance saturation pulse is demonstrated in the simulated plot in (B)... 81
Figure 4-‐4. This figure shows the sagittal Mo and Ms images of the L3/L4 IVD of a representative
subject. The difference image (Mo-‐Ms) of the same L3/L4 IVD is shown on the right. Note the larger
signal saturation in the AF compared to the NP... 85
Figure 4-‐6. Sagittal MTR color maps overlaid on the grayscale Mo images of four subjects. Note the
overall clarity in demarcation between the AF and the NP compartments in the IVDs of the 30-‐year-‐ old subject when compared to those of the 69-‐year-‐old subject. Also note the elevated NP MTR measurements in the L5/S1 IVD of the 47-‐year-‐old subject and in the L4/L5 IVD of the 54-‐year-‐old subject... 87
Figure 4-‐7(A). The MTR maps of the L2/L3 IVDs overlaid on top of the grayscale Mo images for a pair
of young and old subjects. (B) The anterior-‐to-‐posterior MTR profiles of the same IVDs shown in (A), the profiles were computed along the axes denoted by the green lines in (A)... 88
Figure 4-‐8. A plot of lumbar IVD NP MTR measurements vs. Pfirrmann grades assigned by a board-‐ certified radiologist. Linear regression fit of the data is graphed as the dashed line. ... 89
Figure 4-‐9. Axial color IVD MTR maps overlaid on top of the Mo IVD images of the 47-‐year-‐old subject.
The L4/L5 IVD appears to be the healthier IVD. ... 90
Figure 4-‐10. Axial color IVD MTR maps overlaid on top of the Mo IVD images of the 54-‐year-‐old
subject. The L5/S1 IVD appears to be the healthier IVD. ... 91
Figure 5-‐1. A pulse sequence diagram of the 3D radial UTE sequence used for sodium MRI at the 7 T MRI scanner. Signal sampling is carried out during the readout gradient ramp-‐up time(Nielles-‐ Vallespin et al. 2007)...103
Figure 5-‐2. A collage of axial bovine IVD sodium images acquired at increasing TE. The anterior side of IVD face up in all images. Note the higher signal coming from the PG-‐rich center of NP. ...107
Figure 5-‐3. A logarithmic plot of the average IVD NP sodium signal at all TEs. The data points are grouped by short TEs (TE = 0.22, 0.4, 0.6, 0.8 and 1 ms) and by long TEs (TE = 3, 4, 5, 7 and 9 ms). The standard deviations of the IVD signals are shown as the error bars. The long and short T2
relaxation time constants (T2s and T2l) and the combined (T2s plus T2l) relaxation time constant (T2c)
are displayed next to their corresponding exponential fits. ...108
Figure 5-‐4. The segmented mid-‐axial IVD T2l and T2s color maps overlaid on the corresponding
grayscale TE = 220 μs sodium image. The anterior side of the IVD faces up. Note the scales of the T2l
and T2s maps are different due to the approximately ten-‐fold difference between the T2l and T2s
relaxation time constants...110
Figure 5-‐5. A representative IVD’s axial Nl and Ns color maps overlaid on the grayscale TE = 220 μs
sodium image. The anterior side of the IVD faces up...111
Figure 5-‐6. The PSFs of sodium’s T2s, T2l, and biexponential relaxations simulated using the NP
sodium relaxation parameters averaged across all three IVD samples. Each PSF is normalized to have a peak amplitude of unity, and the x-‐axis is in the unit of pixels. Therefore, each PSF’s width, as intersected by the half maximum line, represents the FWHM. The PSF FWHM values computed from T2s, T2l, and biexponential relaxations are 1.09, 0.13 and 0.15 pixels, respectively. ...112
Figure 5-‐7. Simulated PSFs with BW = 25, 50, 100, 250 and 400 Hz/Pixels for (A). T2s, (B). T2l and (C).
biexponential relaxations. Each PSF is normalized to have a peak amplitude of unity, and the x-‐axis is in the unit of pixels...113
Figure 6-‐1. Simulated normalized SNR with respect to the BW. Simulation was carried out using a T2
of 10.84 ms, which is the average IVD T2 calculated in the following section...123
Figure 6-‐2. The sagittal T2 map overlaid on top of the grayscale sodium MR image acquired at TE =
xiv Figure 6-‐3. Plot of sodium signal from a 4 mm ROI in the center of a typical IVD NP at four increasing pulse durations. The solid circular dot represents the IVD NP ROI values, while the solid line shows the result of the sine fit of the four ROI values...126
Figure 6-‐4. An overlay of the segmented sagittal flip angle map of a 28-‐year-‐old subject on top of the corresponding gray anatomical sodium image. The IVDs, spinal cord, and saline phantoms are labeled accordingly. ...127
Figure 6-‐5. Grading scheme for assessing lumbar IVD degeneration developed by Pfirrmann et al.(Pfirrmann et al. 2001)...130
Figure 6-‐6. Six consecutive 5 mm sagittal slices of the sodium MR image of a 35-‐year-‐old subject’s lumbar spine. Note the bright sodium signal coming from the subject’s spinal cord...132
Figure 6-‐7. Plot of IVD Pfirrmann grades vs. the IVD [Na+] values obtained from the in vivo sodium
MR images. The solid line represents the linear regression fit of the data pairs, which yielded a moderate but significant correlation coefficient of -‐0.610 with p<0.01...133
Figure 6-‐8. The self-‐coregistered sagittal lumbar MTR and T1ρ maps of a 54-‐year-‐old subject overlaid
Chapter 1:
Introduction to Magnetic Resonance
Imaging of the Intervertebral Discs
1.1
Synopsis
The first chapter provides background information on
intervertebral disc (IVD) physiology and pathophysiology as well
as the basis of MT MRI, T1ρ MRI and sodium MRI. This chapter also
reviews the current state of the above-mentioned MRI techniques
pertaining to IVD imaging, with discussion on the limitations of
previous studies.
1.2
Physiology of Intervertebral Disc
1.2.1 Intervertebral Disc in Spinal Column
The IVD lies between vertebral bodies in the spinal column,
acting as a mechanical linkage and anchoring adjacent vertebral
bodies (Figure 1-1). There are two distinct regions within a
healthy IVD: a gelatinous inner region called the nucleus
pulposus (NP) and a firm annulus fibrosus (AF) organized in
multiple lamellae(Beadle 1931). Between the IVD and adjacent
vertebral body is a layer of cartilage called the cartilage
endplate. In younger individuals, the cartilage endplate is thick
2 decreases to 1~2 mm in thickness by adolescence(Roberts, Menage
and Urban 1989). The IVD is secured to the cartilage endplate by
collagen fibers. Some of the outermost AF lamellae fibers in the
anterior and posterior directions go over the edges of the
vertebral bodies and connect directly to the bony tissues, and
other AF fibers merge vertically with the longitudinal ligaments
parallel with the spinal column(Coventry 1945, Beadle 1931).
Figure 1-1. A graphical depiction of the IVD within a motion segment of the spine, showing both the NP and AF between the cartilaginous endplates of the vertebral bodies(Raj 2008).
There are 33 vertebrae in human spinal column, which includes
seven cervical, 12 thoracic, five lumbar, a sacrum of five fused
vertebras, and a coccyx of four fused vertebral bodies(De Palma
and Rothman 1970). IVDs are located between two adjacent un-fused
vertebral bodies, with the exception of the first and second
cervical vertebral bodies(De Palma and Rothman 1970). IVD
functions by transmitting loads through the spinal column, and by
been shown that cervical IVDs have wide range of motion, which
includes 127 degrees for flexion and extension, 73 degrees total
inclination and 142 degrees total rotation(Ferlic 1962). In
contrast, the small size of thoracic IVDs along with their
connections to the sternum and rib cage limit their motion(De
Palma and Rothman 1970). In lumbar IVDs, flexion and extension
are permitted for up to 92 degrees between the last lumbar
vertebral body and the first sacral vertebral body(Clayson et al.
1962). Therefore, changes in the properties of IVD affect the
mechanical functioning of the entire spinal column.
Human IVDs vary in size along the spine, with the lumbar IVDs
being the largest. In total, IVDs account for approximately 25
percent of the length of the spinal column(Coventry 1945). In the
cervical region, IVDs account for 22 percent of the spinal column
length, which increases to 20 percent in the thoracic region, and
finally 33 percent in the lumbar region(De Palma and Rothman
1970).
1.2.2 Anatomy of Intervertebral Disc
A human lumbar IVD is approximately 7~10 mm thick and has a 4 cm
diameter measured along the anterior-to-posterior direction
(Figure 1-2)(Roberts et al. 1989). The NP is situated in the
center of the IVD, surrounded by the firm lamellar AF, as shown
4
Figure 1-2. Diagram showing collagen fiber orientations within the lamellar structures of the AF. The typical dimensions of a healthy human lumbar IVD are shown in the diagram(Raj 2008).
The AF is composed of 15-25 concentric lamellae(Marchand and
Ahmed 1990). Each lamellae is composed of type I collagen fibers
positioned in parallel relative to the fibers in adjacent
lamellae. Within the lamellae, the type I collagen fibers are
oriented at a 60o angle relative to the vertical axis, and the
direction of the angle alternates between adjacent lamellae,
resulting in a crisscross pattern of collagen fibers between
adjacent lamellae. The lamellae thickness increases significantly
going from the outer AF to the inner AF in the anterior
direction, and the thickness increase is much less significant in
the posterior and lateral directions(Comper 1996b). As a result,
the AF is thicker on the anterior side, which may contribute to
the predominance of posterior protrusion of NP material(De Palma
proteoglycan (PG) gel enmeshed in an extracellular matrix
composed of randomly oriented type II collagen fibers (Figure
1-3), and it occupies approximately 40% of the IVD’s cross
sectional area(De Palma and Rothman 1970).
Figure 1-3. Diagram of the biochemical composition of the NP, showing aggregating PG monomers, type II collagen fibers, and encapsulated chondrocytes(Raj 2008).
Mature IVD NP has a very low cell density of ~5000 /mm3, and the
associated intracellular volume corresponds to less than 1% of
the total NP volume(Maroudas et al. 1975). Therefore, the mature
IVD NP is considered one of the most acellular tissues in human
6
1.2.3 Major Macromolecular Component – PG Aggrecan
In a typical IVD, water containing solutes, PG and collagen make
up 90-95% of the total tissue mass(Comper 1996b). PG content is
highest in the center of the NP and it decreases radially toward
the AF, however even the outer AF has higher PG content than
ligament or tendon(Comper 1996b). Large PGs in the NP resemble
large aggregating PGs of articular cartilage known as
aggrecans(Comper 1996b), which consists of up to 100 PG monomers
attached to a hyaluronan (HA) chain via link protein molecules,
as shown in Figure 1-4.
Figure 1-4. Overall structure of the PG aggrecan showing PG monomers attached to a HA chain. The detailed structure of a single PG monomer is shown on the right(Gunzburg, Szpalski and Andersson 2004).
Each PG monomer’s central protein core is composed of up to 2000
amino acids. PG monomer contains regions of both globular and
G2 and G3 regions are globular, while the protein core between
these regions assume a linear conformation with attached keratan
sulfate (KS) and chondroitin sulfate (CS) repeating sugar
chains(Gunzburg et al. 2004). These KS and CS sugar chains are
extensively sulfated and carboxylated, making the whole molecule
highly negatively charged at physiological pH(Urban and Winlove
2007). This negative charge attracts cations (primarily Na+), in
order to maintain electroneutrality in the interstitial water.
The high sodium concentration ([Na+]) induces a high osmotic
pressure within the NP, allowing it to absorb water. As an IVD
swells with water, it produces hydrostatic pressure, which is
important to the load-resisting biomechanical property of the
IVD. In human, IVDs from the lumbar region carry the highest
compressive load, and their NPs have the highest PG content(Scott
et al. 1994).
1.2.4 Major Macromolecular Component – Collagen
Collagen is the most abundant biomolecule present in the IVD,
constituting approximately 70% of the dry weight in the AF and 6%
to 25% of the dry weight in the NP(Ghosh 1988). IVD collagen
fibers are responsible for anchoring the IVD to the vertebral
bodies, and for making up a fibrous scaffold to trap the PG
molecules within the NP(Comper 1996b). It has been documented
that there are at least seven types of collagen present in the
8 fibrillar collagens of type I (predominantly present in the AF)
and type II (predominantly present in the NP). Type II collagen
fibers have been found predominantly in tissues that support
compressive loads(Eyre and Muir 1976). The NP’s type II collagen
fibers are loosely packed compared to those of articular
cartilage, which allows these type II collagen fibers to maintain
a higher intrafibrillar water content(Grynpas, Eyre and Kirschner
1980). Other types of IVD collagen exist in much smaller
quantities, and they include types III, V, VI, IX, X, XII, and
XIV(Gunzburg et al. 2004). Although the exact roles of these
minor collagen types in IVD function are not completely
understood, evidences seem to suggest that type III and X are
involved in repair mechanism (Eyre, Matsui and Wu 2002a, Roberts
et al. 1998), type VI is involved in cell adhesion(Roberts et al.
1991), and type IX regulates the size of type II collagen
fibers(Wotton, Duance and Fryer 1988).
IVD collagen fibers are stabilized via various types of covalent
cross-linking, with the greatest cross-link density in the
NP(Comper 1996b). Type IX collagen can be covalently linked, in
an anti-parallel fashion, to two type II collagen fibers(Maroudas
1990). It has also been demonstrated that type I and type II
collagen molecules in the AF can copolymerize and form a single
1.2.5 Minor Macromolecular Components
As mentioned previously, PG aggrecans account for the vast
majority of PGs in the IVD. Another aggregating PG called
versican(Sztrolovics et al. 2002) is also present in the IVD
along with several smaller and non-aggrecating PG molecules such
as lumican, decorin, and biglycan(Johnstone et al. 1993, Inkinen
et al. 1998, Bianco et al. 1990). These minor PG molecules have
shorter core protein containing few glycoaminoglycans (GAG),
however they may contribute significantly to the physiological
function of the IVD(Gunzburg et al. 2004).
Elastin is another minor IVD biomolecule that accounts to 1% to
2% of the IVD’s dry weight(Mikawa et al. 1986). In IVD NP, the
elastin fibers are radially oriented in the randomly orientated
type II collagen network(Yu et al. 2002). In IVD AF, the elastin
fibers lie between the lamellae and connect them in a radial
pattern(Yu et al. 2002). Therefore, it is likely that elastin
fibers play a role in the mechanical deformation of IVD under
loading condition.
There are several types of glycoproteins present in the IVDs,
such as fibronectin(Oegema et al. 2000) and tenascin(Gruber,
Ingram and Hanley 2002). However, the exact functions of these
glycoproteins in IVDs are not well understood. It has been
10
and mechano-transduction in response to extracellular
stimuli(Gunzburg et al. 2004).
1.2.6 Biomechanical Property of the Intervertebral Disc
In human, IVDs are constantly under load from both the body
weight and spinal muscle activities. Therefore, the magnitude of
the load is dependent on posture and the type of activities
performed(Gunzburg et al. 2004). A relaxed individual lying in
the supine position has been shown to exert 0.1 to 0.2 MPa of
pressure on the lower lumbar IVDs, and this pressure increases to
0.6 to 0.7 MPa in a unsupported sitting position(Nachemson and
Elfström 1970). Therefore, intradiscal pressure can increase
approximately six-fold from nighttime to daytime activities. When
experiencing a vertical load, the IVD has the ability to convert
the vertical pressure into a horizontal force that acts on the
AF, which increases the radius of the IVD and brings the adjacent
vertebral endplates closer(De Palma and Rothman 1970). Horizontal
deformation of the AF is likely achieved by the movement of its
1.3
Intervertebral Disc Degeneration
1.3.1 Changes in Hydration
The biomechanical function of the IVD is heavily dependent on the
water-binding property of the IVD NP, which generates the osmotic
pressure necessary to resist the vertical load applied along the
spinal column. IVD hydration has been shown to decrease
progressively over time from up to 88% in healthy IVDs to
approximately 69% in heavily degenerated IVDs(Schlesinger 1955).
This loss of the IVD NP’s capacity to imbibe water results in a
greater fraction of the total vertical strain to be transferred
to the AF, which may cause injury to the AF(De Palma and Rothman
1970).
1.3.2 Changes in PG Aggrecan
The initial phase of IVD degeneration is primarily marked by the
breakdown and depletion of large PG aggrecans(Urban and McMullin
1988). As the aggrecans degrade into smaller fragments, they
become more likely to diffuse out of the NP extracellular matrix
and into the surrounding fluid. The loss of negatively charged
GAG side chains reduces the fixed-charge density (FCD) of the NP,
resulting in the loss of Na+. The Na+ cations function to maintain
the osmotic pressure of the IVD, therefore the loss of Na+
12 pressure. Moreover, it has also been shown that the KS content of
the GAG as well as the hyaluranon content increase with age.
1.3.3 Changes in Collagen
IVD collagen has previously been shown to either exhibit no
content change after maturation or to increase with aging(Mallen
1962, Davidson and Woodhall 1959, Naylor 1962). The NP type II
collagen fibers show increased orientation and crystallinity with
aging. The total collagen content of the NP has been shown to
increase from 15% in the first decade of an individual’s life to
20% afterward, while the AF collagen content maintains steady at
50% throughout life(Murayama 1972). Regardless of whether the
total IVD collagen content changes with aging, the relative
density of collagen is likely to increase due to reduced
hydration in degenerated IVDs.
1.4
Paradigms of Age-Dependent Degeneration and
Degenerative Disc Disease
Aging-related IVD degenerative changes are similar to the
symptoms of degenerative disc disease, thus it is difficult to
differentiate between IVD degeneration due to aging and IVD
degeneration due to pathological processes(Boos et al. 2002).
disc disease are unique processes or an identical process
occurring over different timescales.
1.5
Socio-economic Significance of Intervertebral
Disc Degeneration
Degeneration of the IVD is the most common cause of back-related
disability among North American adults(Errico 2005). IVD
degeneration has been shown to be a significant etiological
component to the onset of low-back-pain (LBP)(Jayson 1976). LBP
exacts a heavy economic toll on society in the form of rising
healthcare cost and lost work productivity, which combines to
amount to between $100 and $200 billion dollars annually(Katz
2006). LBP is also highly prevalent, with more than 80% of the
population will experience an episode of LBP in their
lifetime(Rubin 2007), and the lifetime recurrence rate is as high
as 85%(van Tulder, Koes and Bombardier 2002). Between acute and
chronic LBP cases, the prevalence of chronic LBP has been shown
to be increasing over a 14-year interval, rising from 3.9% in
1992 to 10.2% in 2006(Freburger et al. 2009). Individuals with
chronic LBP are more likely to seek out healthcare(W and Burdorf
2004) and to demand additional healthcare services(Carey et al.
14
1.6
Current Diagnostic Methods for Intervertebral
Disc Degeneration
1.6.1 T1- and T2-Weighted MRI
Previous studies have investigated T1 and T2 relaxation parameters
in IVD degeneration(Morgan and Saifuddin 1999, Khanna et al.
2002, Boos et al. 1997, Cassar-Pullicino 1998). Both T1 and T2
relaxation parameters have been shown to vary with tissue disease
state(Bottomley et al. 1987, Mathur-De Vre 1984), however the
changes are complicated in nature and therefore cannot be
attributed to single tissue parameter(Wehrli, Shaw and Kneeland
1988). T2 relaxation time constant has been shown to be sensitive
to biological changes in the articular cartilage, however the
changes in T2 relaxation time constant due to degeneration may
not be solely contributed by changes in IVD macromolecule
content(Menezes et al. 2004).
1.6.2 Thompson and Pfirrmann Grades
Current clinical classifications of IVD degeneration rely on
grading schemes such as the Pfirrmann grade(Pfirrmann et al.
2001) based on T2-weighted MR images, and the Thompson grade
assessed from photographs of surgically removed IVD sagittal
sections(Thompson et al. 1990). Both the Pfirrmann and the
Thompson grades are discontinuous scores chosen based on a
not quantitative measurements of IVD degeneration, and they are
prone to observer-bias.
1.6.3 Delayed Gadolinium Enhancement MRI of Cartilage (dGEMRIC)
dGEMRIC is a technique that involves an intravenous injection of
gadolinium (Gd) based contrast dye, and it has been previously
used to study IVD degeneration. Gd is a paramagnetic element and
a T1 shortening agent. Its principal function as a MRI contrast
dye is to increase the T1 relaxation rate of adjacent proton
nuclei. One recent study concluded a significant correlation
between IVD degeneration and increase in T1 relaxation
rate(Niinimaki et al. 2006). A separate study has concluded that
increases in IVD tissue T1 relaxation rate from dGEMRIC technique
is correlated with tissue GAG content(Vaga et al. 2008). However,
Gd-based contrast dye has been implicated as the cause of a
cutaneous and systemic fibrosis condition named nephrogenic
system fibrosis (NSF) in 2000(Cowper et al. 2000). A study has
shown that NSF affects approximately 3.5% of patients with
glomerular filtration rate <30 mL/min/1.73m2(Janus et al.).
Therefore, the clinical applicability of dGEMRIC technique is
16
1.6.4 Discography
Discography involves the injection of a radiographic contrast
into an IVD NP, in order to evaluate both its morphology and its
pain response(Anderson 2004). Discography is a painful and highly
invasive procedures, and it has been shown that the needle
puncture injury caused by discography has both immediate and
progressive mechanical and biological consequences on the
IVD(Korecki, Costi and Iatridis 2008). In addition, there is
preliminary evidence that discography also contributes to the
formation of acute Schmorl nodes(Pilet et al. 2009).
1.7
Imaging Technique - T1
ρ(Spin-lock) MRI
1.7.1 Spin-lock Pulse Implementation
T1ρ is the spin-lattice relaxation rate in the rotating frame. In
a T1ρ RF pulse sequence for MRI, T1ρ contrast is achieved using a
90o
+x 90o-x
S L+y S L-y
Figure 1-5. Diagram of the T1ρ magnetization preparation pulse cluster,
which is composed of two opposite-phase spin-lock pulses enclosed by a
pair of 90o pulses.
The first RF pulse in the cluster tips the longitudinal
magnetization into the transverse plane. Next, two RF pulses of
opposite phase are applied parallel and anti-parallel to the
transverse magnetization. During the application of the
spin-locking RF pulse, the transverse magnetization is spin-locked and
the transverse magnetization undergoes exponential relaxation in
the presence of a spin-lock field (BSL) according to an
exponential constant T1ρ instead of T2. The phase-alternating
spin-lock pulse lobes are designed to refocus the effect of an
inhomogeneous BSL fields(Charagundla et al. 2003). The last RF
pulse in the spin-lock cluster restores the magnetization to the
longitudinal axis.
1.7.2 T1ρ Relaxation Mechanism in IVD
Several types of spin-spin interactions may dominate the
transverse magnetization decay during T1ρ relaxation, depending on
18 relaxation from random fluctuations of the local magnetic fields
due to random motions of the proton magnetic dipoles. The
hydroxyl and amine groups of aggrecans carry magnetic dipoles,
and the rotational and translational motions of the aggrecans
results in the fluctuations of these magnetic dipoles. The second
spin relaxation mechanism is the proton exchange between
chemically shifted macromolecular protons and bulk water protons,
such as the proton exchange between PG’s hydroxyl and amine
groups with bulk water protons. The third spin relaxation
mechanism is the residual dipolar interaction due to motional
anisotropy of collagen-bound water protons. The motional
anisotropy may be contributed by cross-linked type II collagen
fibers in IVD NP.
1.7.3 T1ρ Contrast in Biological Tissues
Previous studies have utilized T1ρ MR spectroscopy and imaging to
study tumors, muscle, myocardium, blood flow and
cartilage(Santyr, Henkelman and Bronskill 1989, Lamminen et al.
1993, Dixon et al. 1996, Markkola et al. 1997, Charagundla et al.
1998, Mlynarik et al. 1999, Grohn et al. 2000, Poptani et al.
2001, Duvvuri et al. 2001, Borthakur et al. 2004). Previous
studies have shown that T1ρ relaxation time constant is closely
correlated to PG concentration ([PG]) in articular
cartilage(Akella et al. 2001, Borthakur et al. 2000). Another
constant and the Pfirrmann grade in asymptomatic 40-60 year old
subjects in vivo(Auerbach et al. 2006). At last, T1ρ relaxation
time constant has demonstrated a stronger correlation with [PG]
changes in bovine articular cartilage compared to T2 relaxation
time constant(Regatte et al. 2002).
1.7.4 Quantitative T1ρ Mapping
Typically a series of T1ρ-weighted images with different spin-lock
pulse duration times (TSL) are acquired. A map of T1ρ relaxation
time constants can then be computed from the T1ρ-weighted images
on a pixel-by-pixel basis according to Equation 1-1:
€
S
=
S
o⋅
e
−TSL/T1ρ Equation 1-1Where S is the image signal intensity and So is the maximum
signal intensity.
1.8
Imaging Technique - Sodium MRI
1.8.1 Spin Dynamics of Sodium Nuclei
Sodium is a spin 3/2 nucleus. When the nuclear spin is greater
than 1/2, nuclear charge distribution is not spherical. Sodium
nuclear charge contains a nuclear quadrupole moment that
20 quadrupole moment may interact strongly with the electric field
gradient generated by the surrounding electron cloud. This
quadrupole interaction could be in the order of several
MHz(Levitt 2008). Sodium’s nuclear quadrupole interaction is
dependent on the orientation, magnitude, and time scale of the
electric field gradient produced by the electron cloud
surrounding the nucleus. In an isotropic liquid system, the
nuclear quadrupolar interaction is averaged to zero due to the
rapid rotational motion of the sodium nuclei. In an anisotropic
liquid system, such as in biological tissue where sodium nuclei
may associate with macromolecular structures, the nuclear
quadrupolar interaction has a non-zero average due to motional
anisotropy. The anisotropic system most likely approximates the
environment in IVD experienced by the sodium nuclei. Nuclear
quadrupole interaction is the most significant internal nuclear
interaction of sodium nuclei, and it is partially responsible for
the rapid decay of sodium’s transverse magnetization.
1.8.2 Sodium Biexponential T2* Relaxation
The non-zero nuclear quadrupole interaction of sodium in an
anisotropic liquid system shifts its degenerate Zeeman energy
states, provided that the Zeeman interaction is greater than the
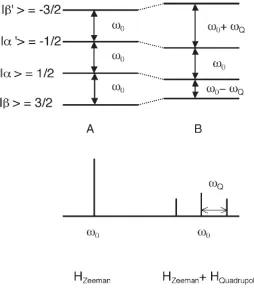
Figure 1-6. A diagram of sodium spin-3/2 nuclear energy states’ Zeeman splitting pattern with nuclear quadrupole interaction averaged to zero (A) and with non-zero nuclear quadrupole interaction (B). Note that the presence of nuclear quadrupole interaction creates three distinct
spectral peaks. ωQ is the nuclear quadrupole interaction
frequency(Borthakur et al. 2006).
The frequency differences between sodium spin-3/2 nucleus’s four
degenerate energy levels are equal when the nuclear quadrupole
interaction is averaged to zero, resulting in a single spectral
peak at the resonance frequency of ωo. However, with a non-zero
nuclear quadrupole interaction, the frequency differences between
adjacent energy levels changed and three spectral peaks (ωo,
ωo+ωQ, ωo-ωQ) are observed in return. The presence of three
spectral peaks gives rise to the biexponential T2 relaxation
characteristic of sodium spin-3/2 nucleus with non-zero nuclear
22 constitutes 60% of total sodium signal, and it represents the
combined ωo+ωQ and ωo-ωQ spectral peaks. The long T2 relaxation
component constitutes 40% of the total sodium signal, and it is
represented by the ωo spectral peak(Hubbard 1970).
1.8.3 Advantages and Disadvantages of Sodium Magnetic Resonance
Imaging
Sodium MRI has been applied to the imaging of heart infarction,
brain, and spine(Hillenbrand et al. 2005, Stobbe and Beaulieu
2005, Insko, Clayton and Elliott 2002). Sodium MRI is highly
specific to the sodium content in biological tissue, which makes
it highly sensitive to pathologies that involve changes in tissue
sodium concentration, such as IVD degeneration. A previous sodium
MRI study of bovine articular cartilage has concluded that the
FCD measurement obtained using sodium MRI correlates closely with
the FCD measurement computed using standard 1,9-dimethylmethylene
blue PG assay(Shapiro et al. 2002). However, the SNR of sodium
MRI is significantly lower when compared to the SNR of proton
MRI. This disadvantage limits sodium MRI’s role in in vivo
applications. The three primary factors contributing to sodium
MRI’s low SNR are listed as follows, in the order of importance.
The first factor is the low natural concentration of sodium in
tissue. The second factor leading to the low SNR of sodium MRI is
sodium’s lower gyromagnetic ratio (
γ
=11.26 MHz/T) compared tomagnetization. The third factor is the short T2 relaxation time
constant of sodium nuclei, which causes rapid relaxation of
sodium’s measurable transverse magnetization. In order to
compensate for the low SNR of sodium MRI, pulse sequences
typically require short echo time (TE) along with repeated signal
averaging.
1.9
Imaging Technique - Magnetization Transfer MRI
1.9.1 Two Proton Spin Pools Exchange Model
An important contrast in MRI is the enhancement of free water
proton spin relaxation via dipolar cross relaxation between
macromolecule-bound water protons and macromolecular protons
(Figure 1-7), in a process called magnetization transfer
(MT)(Wolff and Balaban 1989).
Figure 1-7. A diagram of the two-pool model of MT. The gray volume in pool A (free protons) and B (macromolecule-bound protons) represents
24
pool and the macromolecule-bound proton pool, respectively. R represents the rate of MT between the two pools(Henkelman, Stanisz and Graham 2001).
Previous studies have determined that the hydroxyl, amine, and
possibly carboxyl groups on the surface of macromolecules act as
sites for MT(Ceckler et al. 1992). The relaxation process is
facilitated by hydrogen-bonding between macromolecule protons and
bulk water protons, and it requires that the correlation time of
the macromolecule/bulk water proton interaction to be greater
than the duration required for MT(Ceckler et al. 1992). Previous
studies have concluded that a correlation time greater than 10-9 s
is necessary for MT to occur(Wolff and Balaban 1989).
1.9.2 Quantification of Magnetization Transfer
MT effect can be observed in a saturation transfer experiment, in
which an off-resonance RF pulse is applied to saturate the
equilibrium magnetization of the restricted proton spins, as
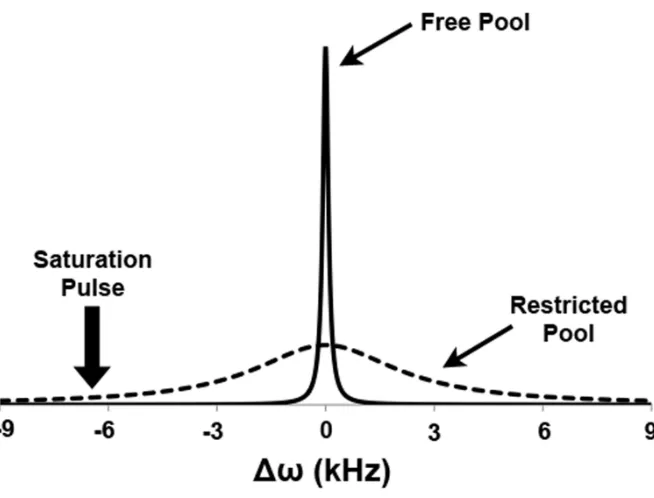
Figure 1-8. Absorption spectra of the restricted pool proton spins (dashed line) and the free water pool proton spins (solid line). The placement of the off-resonance saturation pulse is marked by the solid arrow.
The off-resonance RF pulse ideally would saturate only the 20-40
kHz broad macromolecule proton magnetization, while leaving the
magnetization of the narrow (~15 Hz) bulk water proton
magnetization relatively unchanged. However, since the
macromolecule protons are hydrogen-bonded to some bulk water
protons and undergoing dipolar cross relaxation, the detected
bulk water magnetization also decreases. MT effect is typically
quantified with magnetization transfer ratio (MTR), which is
defined by Equation 1-2:
MTR
=
M
o−
M
SATM
o=
1
−
M
dirM
o+
M
MTM
o⎛
⎝
⎜
⎞
⎠
26
In Equation 1-2, Mo is the signal measured without the
off-resonance saturation pulse, and MSAT is the signal measured with
the off-resonance saturation pulse. However, the observed MT
effect consists of two components, as shown in Figure 1-9.
Figure 1-9. Diagram of the MT effect as a function of off-resonance frequency for a 4% agarose phantom. The graph shows both the direct
saturation effect (Mdir) and the MT effect (MMT), which is represented by
the shaded region(Henkelman et al. 2001).
Mdir is the direct saturation effect that the off-resonance pulse
has on bulk water proton magnetization as a result of RF
bleed-over effect, and MMT is the actual MT effect.
1.9.3 Magnetization Transfer in Articular Cartilage
Articular cartilage belongs to the same fibrocartilage family as
IVDs. They are both composed of primarily collagen and PG. A
collagen fibers are predominantly responsible for the observed MT
effect in articular cartilage(Kim et al. 1993). The dominance of
collagen in the observed MT effect was observed in the z-spectra
of collagen and PG phantoms as shown in Figure 1-10, which
depicts the observed free water proton saturation at a range of
off-resonance saturation frequencies.
28 In Figure 1-10, the solid line shows the direct saturation effect
simulated using Bloch equation and appropriate T1 and T2 values,
assuming a Lorentzian shape for the bulk water resonance peak.
The crosses mark the bulk water proton magnetization following
the MT pulse. In the case of PG, the decrease in bulk water
magnetization is nearly completely dominated by direct saturation
effect, whereas in the case of collagen, there is a MT effect in
addition to direct saturation effect. Collagen has a large number
of hydrophilic hydroxyproline groups contributing to the MT
effect, and these hydrophilic groups are motional-restricted with
a correlation time around 10-8 s, which is sufficiently slow for
MT effect to take place(Ceckler et al. 1992). Even though PG has
hydroxyl groups, however they have been shown to be highly mobile
in a previous 13C NMR study on cartilage. The high mobility of the
PG hydroxyl groups gives it a shorter correlation time, making
them less likely to exhibit MT effect(Torchia, Hasson and Hascall
1977). A previous MT experiment of cadaveric IVDs observed
deviation in MT rate between healthy and degenerated IVDs, and
the MT rate was shown to be correlated with IVD collagen
content(Paajanen et al. 1994).
1.10
Dissertation Overview
IVD degeneration is a possible cause of LBP, which bears