www.orientjchem.org
An International Open Free Access, Peer Reviewed Research Journal
2018, Vol. 34, No.(4): Pg. 2137-2143
This is an Open Access article licensed under a Creative Commons Attribution-Non Commercial-Share Alike 4.0 International License (https://creativecommons.org/licenses/by-nc-sa/4.0/), which permits unrestricted Non Commercial use, distribution and reproduction in any medium, provided the original work is properly cited.
Estimation of Lattice Constants and Band Gaps of Group-III
Nitrides using Local and Semi Local Functionals
SANdEEp ARORA
1*, dHARAMvIR SINGH AHLAwAT
1* and dHARAMBIR SINGH
21Department of Physics, Chaudhary Devi Lal University, Sirsa (1250 55), India. 2Department of Physics, M M University, Mullana, India.
*Corresponding author E-mail: [email protected]
http://dx.doi.org/10.13005/ojc/3404055
(Received: June 08, 2018; Accepted: July 01, 2018)
ABSTRACT
We performed the optimization of lattice constants of Group-III nitrides (InN, AlN, GaN) in wurtzite and Zinc blende structures using various semilocal exchange correlation functional in generalized gradient approximations (GGA) namely PBE, WC, PBEsol in addition to local density approximation (LDA) functional. We used these optimized lattice parameters to predict the band gap values using modified Becke Johnson exchange potential with original and improved parameterization as suggested by David Koller for semiconductors having band gap values below 7eV. Among the different functionals considered, PBEsol optimize the lattice parameters with smallest mean error (0.00639 Å) relative to experimental values, while WC approximation with a slightly greater value of mean error (0.00513 Å). It is shown that mBJLDA approximation improves the band gap for the materials studied when compared with LDA and GGA results. It is also shown that LDA optimized parameters with mBJLDA approximation, which leads to mean error of 0.162 eV reproduces the experimental band gap in most efficient way.
Keywords: Group-III nitrides, Band Gap, LDA, GGA, mBJLDA.
INTROdUCTION
Group III- nitride semiconducting materials form the host material system for the fabrication of optoelectronic devices working in wide spectrum from infrared region to ultraviolet region1-3. Alloying
the other group III or V elements in host material tune the optical and structural properties for desired potential applications. There are reports, which show the nonlinear variation in structural
properties and strong shrink in band gap of InNBi alloy with composition of Bi4. For both wurtzite and
zinc blende phases, the band gap varies from 0.8 eV to 3.5 eV of InGaN alloys with Ga composition5.
synthesis. Density functional theory based methods are tools of interest to compute these properties due to their low computational cost. The standard DFT local LDA and semi local GGA exchange correlation functional suffered from self-interaction problem, which leads to the underestimation of band gaps relative to experimental values6-8. Therefore,
alternative methods are used to predict accurate band gaps of materials. Quasi particle self-consistent GW method gives best theoretical description of electronic properties of materials9-11. However due
to their large computational cost these methods usually not applied to large systems. The hybrid semi local exchange with nonlocal Fock exchange12-13
provides the band gaps comparable to GW results at a relatively low cost still much expensive as compared to standard local and semi local exchange functional. Recently Tran and Blaha proposed a multiplicative exchange potential15 modifying over
original Becke Johnson potential15 which predict the
band gap with accuracy comparable to GW method but at cost in the range of semi local functional. We used the TB-mBJ potential to calculate theoretical band gaps of Group III nitrides in wurtzite and Zinc blende structures using original and improved parameterization for empirical parameter 'c' in equation(4) of reference16.
A small deviation in lattice parameters may result in significant variation in band gaps for same semiconductor17. Therefore, while calculating band
gap the optimization of lattice parameters should be done in an efficient way, which in turn depends upon the selection of proper exchange correlation functional. TB-mBJ is an exchange potential and cannot be obtained as a derivative of exchange correlation energy. Thus, lattice parameters have to be optimizing with LDA or GGA approximation before calculating the band structure with TB-mBJ potential14. In Kohn Sham (KS) equations based
density functional theory18,19 the exact exchange
correlation functional is not known. Thus, it is of utmost importance to select a proper functional for the problem in hand.
In the present work, we performed the optimization of lattice parameters of materials under study of group-III nitrides using four approximations i.e. LDA20,21, PBE22,23, WC24 and PBEsol25. With these
lattice parameters, the band gaps were calculated
using mBJLDA exchange correlation potential with original and improved version suggested for semiconductors having band gap below 7 eV.
METHOd
All the calculations were carried out using DFT based all electron full potential linearized augmented plane wave and local orbital (FPLAPW + lo) method as implemented in wein2k code.26 Three
GGA functionals i.e. PBE, WC and PBEsol were considered for taking into account the exchange correlation effect. For improving the band gaps as obtained with local and semilocal functional, we employed mBJ exchange potential in combination with LDA correlation14. The mBJ exchange potential
is defined by equation (4) of reference16.
(1)
Where r being the electron density, t is the kinetic energy density and vxTB-mBJ is the
Becke-Russel potential and parameter c is given by
c=A+Bge (2)
(3)
In equation (2) A, B and e are the parameters whose values are fitted according to the experimental values. The parameters suggested in original and improved form of mBJ approximation are shown in Table 1.
Table 1: The values of parameters A, B and e used for calculations of 'c' in [Eq. (2)]
A B e
Poriginal -0012 1.023 0.5 Psemiconctor 0.267 0.656 1
In Table 1, Poriginal and Psemiconductor are the parameterization used for calculation of 'c' in original and improved form of mBJ approximations as suggested by Tran & Blaha14 and D. Koller
respectively16. All the calculations were converged
used: mean error (ME), mean absolute error (MAE), mean relative error (MRE, in percentage), and mean absolute relative error (MARE, in percentage).
RESULTS ANd dISCUSSION
Equilibrium Lattice constant
A t a m b i e n t c o n d i t i o n s I I I - n i t r i d e semiconductors prefer to crystallize in hexagonal structure with space group P63mc27. However, these
materials can also be grown in zinc blende structure
using experimental techniques like molecular beam epitaxy27. The wurtzite structure can be supposed
to be the interpenetration of the two hexagonal structures with relative displacement along c axis of unit cell while zinc blende structure can be imagined as the interpenetration of two face centered cubic structures with one displaced relative to other by one fourth along body diagonal of unit cell. The wurtzite structure is characterized by three parameters namely a, c/a and u while the zinc blende unit cell by only one parameter a.
Table 2: Equilibrium lattice parameters (in Å) of III-N semiconductors, calculated with LdA, pBE, wC and pBEsol along with
Experimental values28
Material LDA PBE WC PBEsol Expt.
wzInN a 3.5073 3.5852 3.5421 3.5408 3.545
c 5.6689 5.7916 5.7226 5.7191 5.703
zbInN a 4.9461 5.0545 4.9942 4.9921 4.98
wzAlN a 3.0908 3.132 3.1142 3.1151 3.112
c 4.9478 5.0219 4.9874 4.987 4.982
zbAlN a 4.3467 4.4064 4.38 4.3809 4.38
wzGaN a 3.1593 3.2219 3.1893 3.1884 3.189
c 5.1497 5.248 5.1964 5.1939 5.185
zbGaN a 4.4619 4.5512 4.5073 4.5058 4.5
ME -0.0341 0.048 0.00639 0.00513
MAE 0.0341 0.048 0.00703 0.0063
MRE(%) -0.799 1.069 0.124 0.101
MARE(%) 0.799 1.069 0.142 0.131
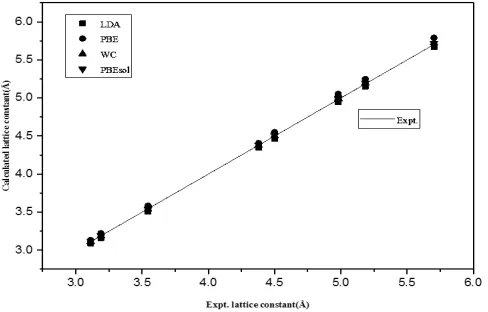
The optimized lattice parameters obtained with different approximations are shown in Table 2 with respective errors ME, MAE, MRE and MARE in various calculations written at bottom of the table.
The calculated results are also shown graphically in Fig. 1 in which the inclined straight line represents the experimental values while calculated parameters by different symbols.
The graph shows that the PBEsol lattice constants lie closest to experimental values as compared to other results. The equilibrium LDA lattice constant underestimate while PBE overestimate the experimental values with ME of -0.0341 Å and 0.048 Å respectively as reported earlier29. The
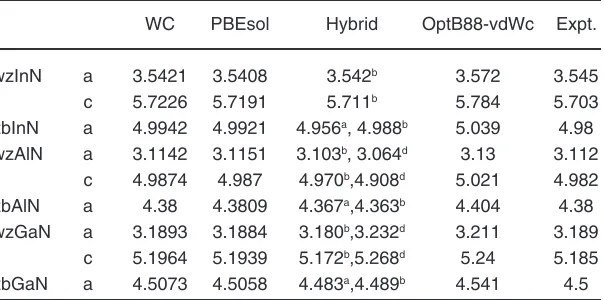
functional WC and PBEsol yields the lattice constants much closer to experimental values as suggested by lowest values of statistical quantities written at the bottom. With small differences in ME, MAE, MRE and MARE for WC and PBEsol approximations, both of these functional are equally applicable for optimization of lattice constant for Group-III nitrides. Table 3 shows a comparison of our calculated WC and PBEsol optimized lattice constants with hybrid
density functional results30,31 and lattice parameters
optimized with OPT functional as given in recently proposed database32. The comparison concludes
that PBEsol reproduces the experimental values in better way, supported by minimum values of ME and MAE of 0.0063 Å and 0.0073 Å when compared with present WC, hybrid functional used in reference31 with
ME, MAE of -0.0073 Å, 0.0091 Å and OPT functional used in reference32 with ME and MAE of 0.041 for
InN, AlN, GaN in wurtzite and zinc blende structures respectively. The hybrid functional with optimized α parameter used in reference30 underestimate the
lattice constants for III-N semiconductors in zinc blende phase with ME of -0.018 Å while the present PBEsol results overestimate with ME of 0.0063 Å.
Table 3: Comparison of wC and pBEsol optimized lattice constants (Å) with hybrid and OpT functional results
WC PBEsol Hybrid OptB88-vdWc Expt.
wzInN a 3.5421 3.5408 3.542b 3.572 3.545
c 5.7226 5.7191 5.711b 5.784 5.703
zbInN a 4.9942 4.9921 4.956a, 4.988b 5.039 4.98
wzAlN a 3.1142 3.1151 3.103b, 3.064d 3.13 3.112
c 4.9874 4.987 4.970b,4.908d 5.021 4.982
zbAlN a 4.38 4.3809 4.367a,4.363b 4.404 4.38
wzGaN a 3.1893 3.1884 3.180b,3.232d 3.211 3.189
c 5.1964 5.1939 5.172b,5.268d 5.24 5.185
zbGaN a 4.5073 4.5058 4.483a,4.489b 4.541 4.5
All the experimental values are taken from ref. 28. a from ref.30.b from ref.31.c from ref.32.d from ref.33.
Band gap
The calculated band gap values for III-nitrides in wurtzite and zinc blende structures are shown in Table 4 along with the various errors namely ME, MAE, MRE, MARE given at bottom of the Table. The results are also shown graphically in Fig. 2. All the local and semilocal functionals strongly underestimate the band gaps with mean error of about - 1.5 eV, mean relative error of about -60%. This is due to self interaction effect suffered by the respective functional used. The application of mBJ exchange potential in association with LDA correlation as suggested by Tran Blaha14
improves the band gaps leading to a decrease in ME and MARE to values of order of -0.2eV and 10% respectively. A further slight improvement in band
gap is obtained with improved version16 of mBJLDA
Table 4: Calcalated band gap (ev) with local, semilocal functional, original mBJLdA and improved mBJLdA (mBJLdASC) for semiconductors. Experimental values are taken from reference28
LDA mBJ mBJ PBE mBJ mBJ WC mBJ mBJ PBEsol mBJ mBJ Expt.
LDA LDA LDA LDA LDA LDA LDA LDA
(SC) (SC) (SC) (SC)
wzInN 0 0.978 1.169 0 0.739 0.913 0 0.866 1.05 0 0.87 1.052 0.78 zbInN 0 0.758 0.939 0 0.535 0.696 0 0.657 0.827 0 0.67 0.839 0.78 wzAlN 4.397 5.759 5.926 4.029 5.391 5.544 4.104 5.55 5.715 4.096 5.546 5.705 6.19 zbAlN 3.242 4.913 5.104 3.311 4.846 5.016 3.22 4.871 5.05 3.188 4.851 5.03 4.9 wzGaN 2.089 3.337 3.566 1.707 2.954 3.171 1.825 3.152 3.376 1.857 3.162 3.386 3.503 zbGaN 1.93 3.148 3.36 1.546 2.768 2.975 1.654 2.952 3.163 1.682 2.959 3.168 3.29 ME -1.297 0.092 0.104 -1.475 -0.368 -0.188 -1.44 0.232 -0.0437 1.437 -0.231 0.0438 MAE 1.297 0.162 0.192 1.475 0.368 0.271 1.44 0.261 0.199 1.437 0.261 0.198 MRE -57.42 -7.33 12.33 -61.94 -13.7 -3.47 -60.94 -5.99 4.76 -60.77 -0.925 6.15 (%)
MARE 57.42 7.41 13.75 61.94 13.7 9.95 60.94 9.67 9.81 60.77 9.47 9.997 (%)
Fig. 2. Calculated versus Experimental band gaps of III-N (InN, AlN, GaN) using mBJLdA and mBJLdA (pSC) at various optimizations
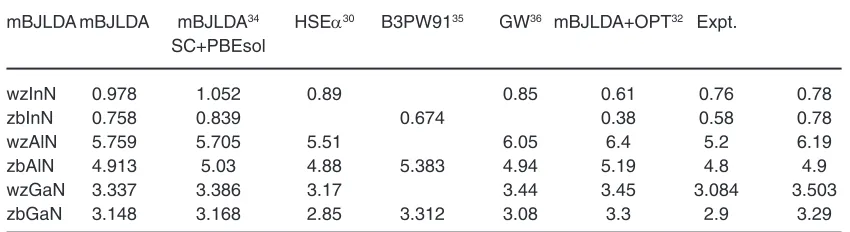
On comparing our results with other mBJLDA band gaps we found an improvement as shown in Table 5, this is due to the reason that the reported calculations were performed at experimental lattice constants while our calculations are at optimized parameters which is obvious as suggested by J.A. Camargo that the band gaps calculated with experimental lattice constants show greater deviation from experimental band gap values using mBJLDA potential14.
As GW and hybrid density functional methods are known for the best theoretical methods to describe the electronic structure of solids so it is necessary to compare our results with above said
methods, in addition, the band gaps calculated at OPT optimized lattice parameters as given in recently launched database32 are also shown in
Table 5 for comparison. The MAE of 0.198eV for mBJLDA band gaps suggest that this approximation have the accuracy of the order of hybrid density functional and GW methods having the MAE of 0.105 eV and 0.189 eV respectively as implemented in references35,36 respectively
Table 5: Comparison of band gap (ev) with other reported results
mBJLDA mBJLDA mBJLDA34 HSEα30 B3PW9135 GW36 mBJLDA+OPT32 Expt.
SC+PBEsol
wzInN 0.978 1.052 0.89 0.85 0.61 0.76 0.78
zbInN 0.758 0.839 0.674 0.38 0.58 0.78
wzAlN 5.759 5.705 5.51 6.05 6.4 5.2 6.19
zbAlN 4.913 5.03 4.88 5.383 4.94 5.19 4.8 4.9
wzGaN 3.337 3.386 3.17 3.44 3.45 3.084 3.503
zbGaN 3.148 3.168 2.85 3.312 3.08 3.3 2.9 3.29
calculated with hybrid density functional method as reported in reference30 by Bastos et. al., The
band gaps of III-N semiconductors, reported in JARVIS-DFT database calculated with mBJ exchange potential at optB88vdW functional (OPT) are found to underestimate the experimental gaps
with ME, MAE, MRE and MARE -0.353eV, 0.353eV, -11.65%, 11.65% respectively32. While our calculated
mBJLDA band gaps at PBEsol optimized lattice parameters predict the band gaps with respective values of statistical quantities as 0.0438eV, 0.198eV, 6.15%, 10%.
CONCLUSION
We have made a systematic investigation, by the use of various local and semi local functionals, for optimization of lattice constants and prediction of band gaps of group-III nitrides (InN, AlN, GaN) in wurtzite and zinc blende structures. Importantly, the PBEsol exchange correlation functional is found to provide lattice constant closest to experimental values shown by smallest M(A)E, M(A)RE of 0.00513 Å (0.0063 Å ) and 0.101%( 0.131%) with WC approximation also competing it with corresponding errors 0.00639 Å (0.00703 Å )
and 0.124% (0.142%) for the materials studied. Further, these approximations have also predicted the band gap values closer to their experimental values when combined with mBJLDA potential with parameterization suggested for semiconductors. However, the best agreement for band gap values with experiment is obtained with mBJLDA +LDA approximation.
ACKNOLEdGEMENT
The authors thank Fabien Tran for valuable discussion through wien2k official mailing list.
REFERENCES
1. Jani, O.; Ferguson, I.; Honsberg, C. & Kurtz, S. Appl. Phys. Lett., 2007, 91, 132117. 2. Dahal, R., Pantha, B., Li, J., Lin, J. & Jiang,
H. Appl.Phys. Lett., 2009, 94, 063505. 3. Nakamura, S. & Fasol, G. Springer 1997
(ed. Nakamura, S. & Fasol, G.)50.
4. Lu ,P.; Liang,D.; Chen,Y.; Zhang, C.; Quhe, R.; Wang S. Scientific Reports 2008, Article number : 10594.
5. Gan, C. K.; Feng, Y. P.; Srolovitz D. J. Phys. Rev. B., 2006, 73, 235214.
6. Perdew, J. P.; Zunger, A.; Phys. Rev., B 1981, 23, 5048.
7. Perdew, J..P.; Levy, M.; Phys. Rev. Lett., 1983, 51, 1884.
8. Jones, R.O.; Gunnarsson, O. Rev. Mod. Phys.,
1989, 61, 689.
9. Hedin, L. Phys. Rev., 1965, 139, A796. 10. Hybersten, M. S.; Louie, S. G. Phys. Rev. B :
Condens. Matter Mater. Phys., 1986, 34, 5390. 11. Shishkin, M. S.; Marsman, M.; Kreese, G.
Phys. Rev. Lett., 2007, 99, 246403.
12. Perdew, J. P.; Erhzerhof, Burke, K. J. Chem. Phys., 1996, 105, 9982.
13. Adamo, C.; Barone, V. J. Chem. Phys., 1999, 110, 6158.
14. Tran, F.; Blaha, P. Phys. Rev. Lett., 2009, 102, 226401.
15. Becke, A. D.; Johnson, E. R. J. Chem. Phys.,
16. Koller. D.; Tran, F.; Blaha, P. Phys. Rev., B
2012, 85, 155109.
17. Camargo, J. A.; Martinez, Baquero, R. Phys. Rev., B 2012, 86, 195106.
18. Hohnberg, P.; Kohn, W. Phys. Rev., 1964, 136, B864.
19. Kohn, W.; Sham, L. J. Phys. Rev., 1965, 140, A1133.
20. Dirac, P. A. M. Proc. Camb. Philos. Soc., 1930, 26, 376.
21. Perdew, J. P.; Wang, Y. Phys. Rev., B 1992, 45, 13244.
22. Perdew, J. P.; Chevary, J. A.; Vosko, S. H.; Jackson, K.A.; Pederson, M. R.; Singh, D. J.; Fiolhais, C. Phys. Rev., B 1992, 46, 6671. 23. Perdew, J. P.; Burke, K.; Ernzerhof, M. Phys,
Rev. Lett., 1996, 77, 3865.
24. Wu, Z.; Cohen, R. E. Phys. Rev., B 2006, 73, 235116.
25 Perdew, J. P.; Ruzsinszky, A.; Csonka, G. I.; Vydrov, O. A.; Scuseria, G. E.; Constantin, L.A.; Zhou, X.; Burke, K. Phys. Rev. Lett.,
2008, 100, 136406.
26 Blaha, P.; Schwarz, K.; Madsen, G. K. H.; Kvasnicka, D.; Lnitz, J. Vienna University of
Technology, Austria, 2001.
27. M o r k o c , H . H a n d b o o k o f N i t r i d e Semiconductors and Devices, WILEX-VCH Verleg, GmbH & Co. KGaA, Weinhein.,
2008,1, 2047.
28. Vurgaftman, I.; Meyer, J. R. J. Appl. Phys.,
2003, 94, 3675.
29. Hass, P.; Tran, F.; Blaha, P. Phys. Rev., B 2009, 79, 085104.
30. Bastos, C. M. O.; Sabino, F. P.; Sipehi, G. M.; Da Silva, L. F. J. Appl. Phys., 2018, 123, 065702. 31. Caro, M. A.; Schulz, S.; O'Reilly, E. P. Phys.
Rev., B 2012, 86, 014117.
32. Choudhary, K.; Zhang, Q.; Reid, A. C. E.; Chowdhary, S.; Nguyan, N. V.; Trautt, Z.; Newrock, M. W.; Congo, F. X.; Tavazza, F. Scientific Data., 2018, 05.
33. Qin, L.; Duan, Y.; Shi, H,; Shi, l.; Tang, G. J. Phys. : Condens. Matter., 2013, 25, 045801. 34 Tran, F.; Blaha, P. J. Phys. Chem., 2017, A121,
3318.
35. Crowley, J. M.; Tahir Kheli, J.; Goddard, W. A. J. Phys. Chem. Lett., 2016, 7, 1198.
![Table 1: The values of parameters A, B and e used for calculations of 'c' in [Eq. (2)]](https://thumb-us.123doks.com/thumbv2/123dok_us/9081948.1443229/2.576.293.497.544.590/table-values-parameters-b-e-used-calculations-eq.webp)