WWJMRD 2017; 3(10): 81-85 www.wwjmrd.com
International Journal Peer Reviewed Journal Refereed Journal Indexed Journal UGC Approved Journal Impact Factor MJIF: 4.25 e-ISSN: 2454-6615
Turnea Marius
University of Medicine and Pharmacy “Grigore T. Popa”, Department of Medical Biosciences, Iasi, Romania
Ilea Mihai
University of Medicine and Pharmacy “Grigore T. Popa”, Department of Medical Biosciences, Iasi, Romania
Arotaritei Dragos University of Medicine and Pharmacy “Grigore T. Popa”, Department of Medical Biosciences, Iasi, Romania
Rotariu Mariana
University of Medicine and Pharmacy “Grigore T. Popa”, Department of Medical Biosciences, Iasi, Romania
Gheorghita Andrei Polytechnic University of Bucharest, Splaiul Independentei, Bucharest, Romania
Correspondence: Ilea Mihai
University of Medicine and Pharmacy “Grigore T. Popa”, Department of Medical Biosciences, Iasi, Romania
Modeling and Simulation Aortic Vascular
Architecture
Turnea Marius, Ilea Mihai, Arotaritei Dragos, Rotariu Mariana,
Gheorghita Andrei
Abstract
The application of general systems theory in the complex study of the blood circulation in the terminal branches of the aorta is determined by the need to deepen the research of the arteries in this field to a superior level than the morphological one and especially, by the desire to find new correlations between the morphological disposal and functional characteristics. Lower limb arteries may be considered as belonging to the terminal arterial system, which consists of many subsystems. The detailed knowledge of organizational and structural features of each subsystem will determine the procedural character of general systems theory in the sense that the entire terminal arterial system possesses superior characteristics to those of the subsystems that enables it to ensure a sufficient and effective blood supply in the lower limb arteries. The modeling and simulation of vascular architecture aims at the localization of potential vascular pathologies that cannot be observed by direct visualization of the angiography. The purposed modeling and simulation tool has graphical user interfaces (GUI), that show all the information and actions available for a user (for example, icons or visual indicators), in this case a bioengineer, as opposed to text-based interfaces, which provide only commands that need to be typed. Graphical user interface is a tool for processing and simulation of imaging data and is composed of a main menu, through which you can select the desired type of activity: angiography image processing; mathematical modeling and simulation of vascular architecture Image processing used to enhance the quality of the images is a way of assessing the performance of the algorithms employed in the modification of the grey contrast, adjustment of the histogram, elimination of the blurring effect and image segmentation. The user has the possibility of adjusting different parameters and then tries several options by creating experimental skills used to decide on the optimum level of image processing when working with blood vessels. Mathematical modeling and simulation of the terminal arteries based on image processing arteriography (on iliac artery and femoral artery trajectory) while using polynomial regression, makes this tool useful not only in training, but also in research.
Keywords: Angiography processing, Mathematical modeling, vascular architecture; Matlab
Introduction
The implementation of the general theory of the systems in the complex study of blood circulation in the aortic terminal area is determined by the need to deepen the research of arteries in this territory on a higher scale than to the purely morphological one and especially, the desire to find new correlations between morphological disposal and functional characteristics. Lower limb arteries may be considered as belonging to the terminal aortic arterial system constituted, in turn, of several subsystems. Understanding the organizational and structural aspects of each subsystem will determine the procedural character of the systems’ general theory in the sense that the whole terminal aortic arterial system possesses higher qualities to those of the component subsystems which enable it to ensure a sufficient and effective vascularization in the arteries of the lower limbs. Modeling and simulation of vascular architecture aim to locate some potential vascular pathology which cannot be observed by the direct visualization of angiography. Vascularization in the terminal aortic arterial system is determined by two basic functions: a distributive function by which the system reaches the lower limb and the second function is a hemodynamic function by which
~ 82 ~
the system decreases blood flow velocity to a level low enough to allow the exchange of metabolic products between the bloodstream and tissue cells. Terminal aortic arterial vascular tree is designed to perform both functions, but it is very important to distinguish between these two, since they serve different parts of arterial vascular structures. While the distributive function refers strictly to the geometric appearance of the vascular tree, the hemodynamic one refers to blood flow dynamics. Modeling and simulation of vascular architecture at the level of the aortic terminal territory is a component of the biomedical education from the educational curricula of a biomedical engineer. The proposed approach involves dimensional analysis and a method to analyze the crotch. The property of successive crotch of the vascular system determines a fractal character at a fairly primitive level, which can be exploited using fractal analysis (Falcone: 2003 and Chen: 1989). Fractal analysis can offer important information about the vascular system, its functionality or diseases that affect the human body. The correlation between the homodynamic in microcirculatory network with an exponent of crotch equal to 3.0 gives information about the coefficient of shear walls of arteries and veins system. The blood flow in the cardiovascular system is evaluated using Darcy’s law, Reynold’s number and Poiseuille’s equation in (Jayalalitha : 2008 ). The authors proposed different formulas for normal and abnormal patients but no fractal analysis is exemplified numerically for these both cases (Jayalalitha : 2008 ) . After a review over fractal analysis of healthy vascular networks, the consequences for vascular morphogenesis are discussed along with implications in pathological conditions. Morphogenesis seems to be efficient area of application for fractal analysis ( Lorthois : 2010) . The fractal dynamic is modified with aging and disease but a combination of but is not very well studied yet (Goldberger: 2002). The fractals can play an important role in pathology that is, in identification of several human diseases (Cross: 1997). The fractal correlation between human retinal vessels and specific disease as diabetic pathology are present in literature in few papers (Stošić: 2006 and Avakian: 2002). A multifractal dimension is proposed in (Stošić: 2006). The authors used STARE database and 20 retinal images from this database with half of them with different pathological states. The author found that the images corresponding to pathological states has a tendency had lower generalized dimensions as against normal states (Stošić: 2006). Retinal vasculature analysis could be used in fractals diabetic retinopathy classification, but this is in stage of investigation without general valuable results published in literature yet. Pulmonary (bronchial capillaries) arboricity are analyzed by fractal perspective in (Anderson: 2005). The fractal pathology in vascular disease in literature is very well studied but the actually are premising. Graphical interfaces, user friendly help student to understood better the signification and effect of proposed method by visual inspection and analysis. (Arotaritei: 2015 and Rotariu: 2013).
Materials and methods
Computerized calculation of pressure and flow profile may be used as part of the diagnostic tool. For example, for a given topic, the measuring of the pathological flow profile can be compared to values calculated for normal physiological flow. Studies related on how the parameters
of the model have to modify in order to boost the measured pathological flow profile can lead to a better understanding of the pathology. In addition, the calculation of flow and pressure profiles can be used in conjunction with simulation, for example, in surgery or anesthesia simulators. Mathematical modeling of such geometries will have to take into account two aspects: great arteries in which the blood flow and pressure are predictable at any point along its length and small arteries, in which the relationship between flow and pressure involve the condition of conjunctive external flow for small arteries. Blood flow and pressure in the systemic arteries (large and small) are determined using incompressible asymmetrical Navier - Stokes equations for a Newtonian fluid. The one-dimensional model is obtained by integrating these equations in the cross-sectional area of the vessels. The geometry (length, RADIUS, RADIUS on exit) of the vessel can be determined by processing data resulted from measurements on a topic and artery properties (primarily the elasticity of the walls and peripheral resistance), but having the parameters adjusted, comparable to the measurements. The simulation of blood flow and pressure in compliant vessels require the definition of three differential equations: two equations will preserve the volume and time and an equation will describe the influence of the fluid on the vascular wall and its compliance. A typical vase is shaped in the form of an asymmetrical compliant cylinder. The speed of the fluid shut inside the cylinder is described by the relationship
u
r
x
t
u
r
x
t
u
r,
,
,
x,
,
(1)The vascular wall is supposed to be waterproof. Hence, non-sliding conditions are met only if the flow velocity at the level of the wall is equal to the speed of the wall. Density δ and viscosity μ are considered constant. We
consider p (x, t) as the pressure of the fluid and p0 (which is
constant) diastolic pressure. Assuming that the pressure does not vary greatly along the cross-sectional area of the vase, p can be considered independent in relation to r. Considering R (x, t) as the radius of the vessel and A( x, t
)=πR2( x , t ) as the corresponding cross-sectional area, the
vase is supposed to tighten exponentially, so the balance beam is:
log 10 x r r t t b
r
x
r
(2)Where p(x,t) = p0. Here rt and rb describe the radius at the entrance and exit of the vessel, and l is the length of the vessel. In the end, it is assumed that the vascular wall is subjected only to one radial movement, and the vessel is longwise locked. The scanned images are preprocessed (filter, contrast enhancement, equalization of the histogram) and skeletonized for subsequent calculations. A brief module of informing on the used formulae can be found in two forms - as help from the applications window and as a user manual.
Results & Discussion
Modeling and simulation program is divided into two main modules: Imaging and Processing of angiographies and Mathematical modeling and simulation of vascular
architecture. The first module loads and processes
are represented by the lengths and diameters of the blood vessels, measured on the studied angiographies. The second module simulates the trajectory of vascular architecture starting from the abdominal aorta artery up to the 5th generation of its crotch. The obtained data will be represented by corresponding graphics to each arterial subsystem. The main modules and activities are illustrated in pictures from the figures 1-.6, with possibilities to save and store the data in files of time ASCII or .xls for any subsequent processing with EXCEL.
Fig. 1: Modeling and simulation of vascular architecture
The Load the imagebutton allows us to select the image
and load into the desktop included in the program. By selecting the button, we have access to a new window that allows us to browse through the database available, in order to choose the image file type that we want to load into the desktop (figure 2).
Fig. 2: Loading the image into the desktop
The control panel Modify the contrast, is equipped with two tools which allow us to make fundamental operations of contrast changing in images with shades of gray (grayscale images), specific images to medical imagistic explorations based on Roentgen rays (radiography, CT, angiography, etc.). Image adjust button allows us to modify the contrast of the image by adjusting the specific histogram that represents the relative frequency of gray levels in the image. Changing the contrast of gray and adjusting the specific histogram (figure 3) help the student to visualize the effects of histogram equalization on image quality improvement.
Fig. 3: Unprocessed angiography histogram
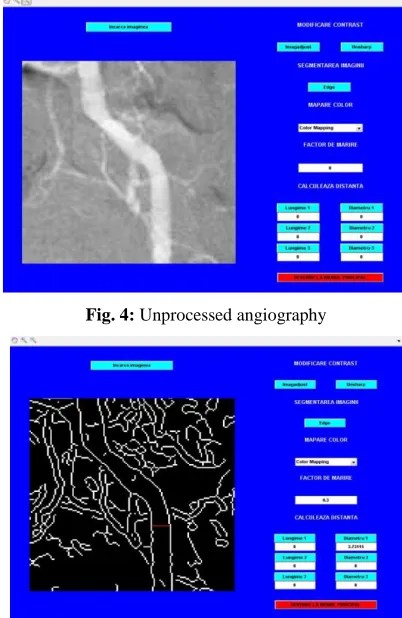
Unsharp button allows us to eliminate the blur effect present in the image, using the process called unsharp masking. During this process, we extract from the original image the blur type noise, resulting in an improved image. The control panel Image segmentation is a tool that carries out the division of the image into areas of interest, after certain criteria. Each pixel will be assigned a value, 0 or 1, representing its membership to a specific area or region of interest. As a rule, segmentation seeks the removal, identification or the recognition of a particular object in an
image (figures 4 and 5). Edge button performs the
segmentation of the image based on canny detection. This procedure aims to recognize the limits between the object and the background, in order to delineate the contours of interest areas. When referring to the unprocessed angiographies, image segmentation is used to determine the outline of vascular architecture. By using this process, we can also reach a more accurate measurement of the vessels’ diameters.
Fig. 4: Unprocessed angiography
~ 84 ~
The control panel Color Mapping is provided with a pop-up menu that allows us to select the desired type of color mapping. Color mapping is a process achieved by turning the contrast from shades of gray, in a contrast color, in order to facilitate the recognition of subtle details from the image. Depending on the details of interest and the quality of the angiography, you can choose two types of color mapping, respectively Jet type, usually used in systems characterized by fluid dynamics and winter type (figure 6).
Fig.6: Color mapping (fluid dynamics type)
Fig. 7: Image processing of the aortic trunk terminal system
Fig.8: Mathematical modeling of common left femoral arterial subsystem trajectory, of its trajectory and the origin of its
collateral branches
Fig..9: Image processing of the deep left femoral artery subsystem
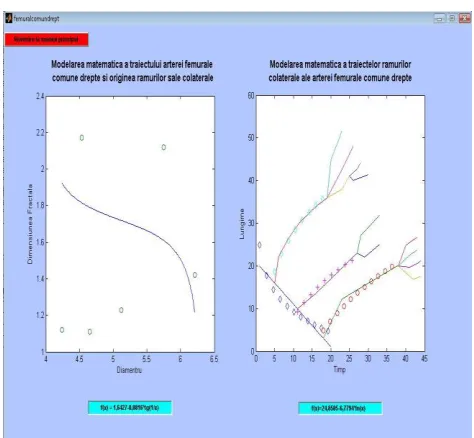
Fig.10: Mathematical modeling of common right femoral arterial subsystem trajectory, of its trajectory and the origin of its
collateral branches
The aim of this work was the development of a model based on physiological principles, which can predict the blood flow in the terminal aortic arterial system. This was achieved by building a program able to process peripheral arteriography in order to measure the required parameters for modeling and simulating vascular architecture and their graphic reconstruction. Modeling and simulation of the arteries and their branches was achieved by solving some
nonlinear one-dimension equations Navier-Stockes,
that were carried out allow us to build a mathematical model of the regression type represented by the equation.
. (3)
As a result, it can be observed that the terminal aorta will be split into two main branches represented by the primitive iliac arteries and a thinner branch represented by the middle sacral artery. This branching occurs at a diameter of 10,83U (measured through arteriography), which is an average of the values obtained from the measurement of arteriographic images. Also, it should be noted that along the terminal aorta there are a series of lateral branches whose diameter varies between 1, 05 – 1, 64 U (circles from figure.9), located on both sides of the aorta. These branches appear at approximately 1, 1949 DF obtained after the quantification of the arteriographic images.
Conclusions
Because of simulation, it was deducted that the fractal dimension is a useful tool in the approximation of the blood flow. Thus, it was observed that for the fractal dimension values smaller than 1DF, blood flow is laminar, while in the case of fractal dimension values between 1 and 1,5DF there is a blood flow in transient regime and at fractal dimension values greater than 1,5DF, the blood flow will be turbulent. The model tree is built systematically, the limitation being made by watching the performance of the invariance condition for pressure and flow border. The development structure is based on the target function of minimizing the volume contained by the blood vessel, which causes the arterial tree using a constructive optimization with constraints. The limitation of the mathematical model is noticeable once with the rise of
trajectory deviation based on the ideal model.
Experimentally, it has been found that starting from the simulation of the 5th crotch generation; the deviations are characterized by high values, limiting the model in making the quantification of the following vascular crotch generations. For further improvement of the model is necessary to impose some new sets of constraints related to the characteristics of the vascular walls, which will take us to a better approximation of the fractal dimension, in the sight of ongoing simulation for generations of high rank vascular crotch.
References
1. Falcone, F., Fractal Geometry: Mathematical
Foundations and Applications, 2003, Wiley.
2. Chen, C.C, Daponte, J.S., Fox, M.D., Fractal feature
analysis and classification in medical imaging , 1989
,IEEE Trans. Med. Imaging. 8(2): 133-142.
3. Jayalalitha, G., Deviha, V.S., Uthayakumar, R., 2008.
Fractal model for blood flowing cardiovascular system, 2008, Computers in Biology and Medicine, 38: 684 – 693.
4. Lorthois, S., Cassot, F., Fractal analysis of vascular
networks: Insights from morphogenesis, 2010, Journal of Theoretical Biology, 262: 614–633.
5. Goldberger, A. L., Fractal dynamics in physiology:
Alterations with disease and aging, 2002, PNAS, 99 (l): 2466–2472.
6. Cross, S.S., Fractals in pathology, 1997, J Pathol,
182(1): 1-8.
7. Stošić, T., Stošić, B. D., Multifractal Analysis of
Human Retinal Vessels, IEEE Transaction on Medical Imaging, 2006 , 25( 8) : 1101-1107
8. Avakian, A., Fractal analysis of region-based vascular
change in the normal and non-proliferative diabetic retina, Curr Eye Res., 2002, 24(4): 274-80
9. Anderson, J.C., Babb, A.L., Hlastala, M.. P., A fractal
analysis of the radial distribution of bronchial capillaries around large airways, J. Appl Physiol , 2005 ,98 : 850–855 .
10. Arotaritei, D., Turnea, M., Filep, R., Ilea, M., Rotariu,
M., Gheorghita, A., Graphical Interface for Analyze of Temperature of Skin at Skin-Liner Interface, 2015,The 4th IEEE International Conference on E-Health and
Bioengineering – EHB, 1:1-4
11. Rotariu, M., Turnea, M., Arotaritei, D., Ilea,
M.,Graphical Interface that Interprets the Moments Collected from the Contact between the Stump and Socket , 2013 ,The 8th International Symposium on Advenced Topics in Electrical Engineering, 1 : 1-4 .