Vocal Tract Area Function Estimation Using
Particle Swarm
Mahmoud A. Ismail
Faculty of Computers and Information, Cairo University, Giza, Egypt [email protected]
Abstract — The problem of estimating the Vocal Tract Area
Functions (VTAF) from speech signals arise in many applications. However, the existing methods for solving this problem were designed for small subset of speech sounds. This research presents a novel method for estimating VTAF from speech signal based on Particle Swarm Optimization (PSO). This method is general and can be applied for large classes of speech sounds. The proposed method was tested and the results positively verified the effectiveness of using the particle swarm approach in estimating VTAF.
Index Terms— Particle swarm optimization, Speech
modeling, Inverse problem.
I. INTRODUCTION
The speech production process can be represented by a set of time-varying articulatory parameters [18,28]. The extraction of the articulatory parameters from the speech signal is usually called inverse problems [16]. The estimation of VTAF from speech sounds is belongs to this class of problems. VTAFs are needed in many applications, such as articulatory speech synthesizer, speech recognition, language training, etc. The difficulty in the estimation of the VTAFs arises from the fact that it has the property of one-to-many nonlinear mapping [24]. The one-to-many characteristic arises from the fact that a given segment of speech signal can be generated by an infinite number of vocal tract configurations.
To solve the inverse problem, a number of constraints were introduced in previous studies [16]. These constraints can be roughly classified as morphological (spatial) and dynamic (temporal) constraints. The former is a static constraint, which ensures that the estimated vocal tract configuration is a reasonable vocal tract shape. The latter involves the continuity of vocal tract motion and the effects of co-articulation, such as anticipation and retention.
For a long time, the problem of estimating the area function of the vocal tract has been under investigation. Many studies have focused on this issue, and tried to find a better solution for the inverse problem [16]. An approach based on the acoustic measurements such as formants and acoustic impedance at the lips was proposed to determine the geometry (log-area) of the human vocal tract [10,19]. The lowest three (log) formant frequencies and the amplitudes of the vocal tract transfer function has been used to obtain log-areas with 20 sections [24].
Another approach based on using articulatory codebook to estimate vocal tract shapes from speech signals was proposed [6,7,16]. In contrast to the previous estimation approaches, an approach based on employing a statistical articulatory model to estimate articulatory parameters from speech waves was proposed [17]. It related the acoustic parameters to the articulatory movements of the speech organs. An articulatory–acoustic phonemic codebook consisted of flesh-point articulatory movements and speech acoustics were used to retrieve the articulatory movements from the acoustics [27]. An analytical methods to recover the vocal tract configurations was given in [25,26]. Preliminary studies on recovering VTAF using genetic algorithms were proposed [11,23]. More recent research recur to control points experimentally measured to a group of speakers, and inversion minimizes the distance between the articulatory model and the referred points, by using quadratic approximations [3,29].
Among the previous approaches, the method employing articulatory–acoustic codebooks seems advantageous with respect to accuracy. However, this method lacks flexibility in recovering vocal tract shapes because it is limited by the codebook, which is usually based on data only from a few speakers. Another problem is that it requires a large database and great mappings. In addition, almost all the existing acoustic-to-articulatory mapping methods are not valid for all classes of speech sounds [16]. Adequate mappings exist for small subsets, for example, for voiced speech only, or for "simple" consonant-vowel transitions. No good mappings exist at the present time for fricatives, stops, and nasals. So, one can safely say that the only accurate and reliable method for finding the area function of the vocal tract is manually defining the VTAF from the images captured in X-ray films or by magnetic resonance [1,8,12]. However, these approaches require considerable effort and domain data.
large class of speech sounds. The general applicability of the proposed method has been tested, and the obtained results are encouragement.
Section II, provides a general review about the speech production and modeling. In section III, a general overview about PSO and their uses are given. In section IV, we discuss the new technique for estimating the vocal tract configuration. Experimental results are given in section V. Comments and notes about the proposed system and experimental results are given in section VI.
II. SPEECH PRODUCTION AND MODELING
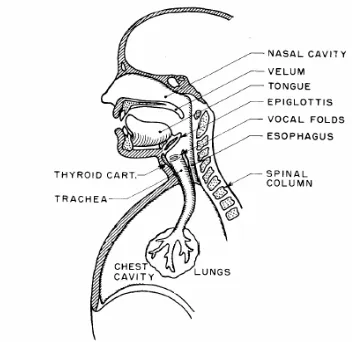
Figure 1 portrays a medium saggital section of the speech system in which we view the anatomy midway through the upper torso as we look on from the left side [18,28].
Figure1: Schematic view of human speech production mechanism (see [18]).
The gross components of the system are the lungs, trachea, larynx, pharyngeal cavity, oral or cavity, and nasal cavity. The pharyngeal and oral cavities are usually grouped into one unit referred to as the vocal tract, and the nasal cavity is often called the nasal tract. Accordingly, the vocal tract begins at the output of the larynx (vocal cords, or glottis) and terminates at the input to the lips. It acts like an acoustic tube running from the glottis to the lips. When the brain changes the articulators’ position and shape, then also the shape and acoustical resonance properties of the non-uniform tube are modified, yielding distinct sounds [18]. The total length of the vocal is about 17-14 cm for male and for female, and its cross-sectional area is uneven and variable from 0 - 20 cm2. The nasal tract begins at the velum and
ends at the nostrils. When the velum is lowered, the nasal tract is acoustically coupled to the vocal tract to produce the nasal sounds of speech. Air enters the lungs via the normal breathing mechanism. As air is expelled from the lungs through the trachea, the tensed vocal cords within the larynx are caused to vibrate by the air flow. The air flow is chopped into quasi-periodic pulses which are then modulated in frequency in passing through the throat, the oral cavity, and possibly nasal cavity. Depending on the
positions of the various articulators (i.e., jaw, tongue, velum, lips, mouth), different sounds are produced.
The lungs and the associated muscles act as the source of air for exciting the vocal mechanism. The muscle force pushes air out of the lungs and through the trachea. When the vocal cords are tensed, the air flow causes them to vibrate, producing so-called voiced speech sounds. When the vocal cords are relaxed, in order to produce a sound, the air flow either must pass through a constriction in the vocal tract and thereby become turbulent, producing so-called unvoiced sounds, or it can build up pressure behind a point of the total closure within the vocal tract, and when the closure is opened, the pressure is suddenly and abruptly release, causing a brief transient sound called stop sounds.
It is so hard to model the speech production system as the complete theory of speech production is not yet available [18,20]. However, there is an approximated model called source–filter model [18]. This simplified model based on a theory states that the human vocal system is described as a linearly connected two-part system: a source and a filter (Figure 2).
Figure 2: Source–Filter model of speech production.
As air from the lungs passes through the vocal folds within the larynx, a pitched or un-pitched phonation occurs. This sound is seen as the source entering into the vocal tract. The vocal tract acts as a filter and alters the frequency content of the source sound, depending on the configuration of the vocal tract. The configuration of the vocal tract can be represented by the VTAF, A(x), which is the cross-sectional area of the vocal tract as a function of distance measure from the glottis (see Figure 3). So, according to the source filter model, the speech modeling problem is how to recover area functions automatically from target speech signals.
Figure 3: Example of a vocal tract area function (see [18]) Sound
Source
Time-Varying Filter Glottal
The vocal tract can be modeled as a multi-sectional cylindrical tube, with each section having the same length and a different cross-sectional area [15,18], as shown in Figure 4, where Sm is the cross-sectional area of section
m.
Figure 4: The tube model of the vocal tract.
The resonance frequencies of vocal tract defined in the case of the vowel sounds are called formants [18]. They indicated by the emphasis regions in the spectrums of vowel sounds. Intuitively, the positions of the formants depend upon the shape and physical dimensions of the vocal tract. Formally, the formants are the poles of the acoustic transfer function determined by a vocal tract configuration. The quantity
k k
k k k
S S
S S r
+ − =
+ +
1
1 is called the
reflection coefficient number k [18]. This quantity is important and is usually used in measuring many of the speech parameters [18,28]. Under certain assumption, the reflection coefficient of the multi-sectional tube can be related to the autocorrelation coefficient of the impulse response of the vocal tract [9].
III . PARTICLE SWARM OPTIMIZATION
PSO (PSO) is an evolutionary computation technique (a search method based on a natural system) developed by Kennedy and Eberhart [13,14,31,32]. PSO, like a Generic Algorithm (GA), is a population based optimization tool. However, unlike GA, PSO has no evolution operators such as crossover and mutation, and moreover, PSO has less parameters. PSO is an evolutionary algorithm that does not implement survival of the fittest, and unlike other evolutionary algorithms where an evolutionary operator is manipulated, the velocity is dynamically adjusted.
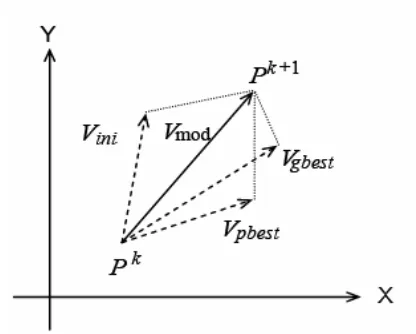
The system initially has a population of random solutions. Each potential solution, called a particle, is given a random velocity and is flown through the problem space. The particles have memory and each particle keeps track of its previous best position (called the pbest) and its corresponding fitness. There exist a number of pbest for the respective particles in the swarm and the particle with greatest fitness is called the global best (gbest) of the swarm. The basic concept of the PSO technique lies in accelerating each particle towards its pbest and gbest locations, with a random weighted acceleration at each time step and this is illustrated in Figure 5, where Pk is the current position of a particle,
Pk+1 is its modified position, Vini is its initial velocity,
Vmod is its modified velocity, Vpbest is the velocity
considering its pbest location and Vgbest is the velocity
considering its gbest location.
Figure 5: Concept of a swarm particle’s position.
The main steps in the PSO process are described as follows:
(i) Initialize a population of particles with random positions and velocities in d dimensions of the problem space and fly them.
(ii) Evaluate the fitness of each particle in the swarm. (iii) For every iteration compare each particle’s
fitness with its previous best fitness (pbest) obtained. If the current value is better than pbest, then set pbest equal to the current value and the pbest location equal to the current location in the d-dimensional space.
(iv) Compare pbest of particles with each other and update the swarm global best location with the greatest fitness (gbest).
(v) Change the velocity and position of the particle according to equations (1) and (2) respectively. Vid and Xid represent the velocity and position of
the ith particle with d dimensions, respectively,
rand1 and rand2 are two uniform random
functions, and Wt is the inertia weight at
iteration t, which is chosen beforehand [33].
) X (P rand c2
) X (P rand c1 V W V
id gd 2
id id 1 id
t id
− ×
+
− × × + × =
(1) Xid =Xid +Vid (2) (vi) Repeat steps (ii) to (v) until convergence is reached based on some desired single or multiple criteria.
PSO has many parameters and these are described as follows: W called the inertia weight controls the exploration and exploitation of the search space because it dynamically adjusts velocity. Local minima are avoided by small local neighborhoods, but faster convergence is obtained by a larger global neighborhood, and in general a global neighborhood is preferred. Synchronous updates are more costly than the asynchronous updates. Vmax is
the maximum allowable velocity for the particles (i.e. in the case where the velocity of the particle exceeds Vmax,
then it is limited to Vmax). Thus, resolution and fitness of
search depends on Vmax. If Vmax is too high, then particles
particles will be trapped in local minima. The constants c1 and c2 in (1) and (2), termed as cognition and social components, respectively, are the acceleration constants which changes the velocity of a particle towards pbest and gbest (generally, somewhere between pbest and gbest). The velocities of the particles determine the tension in the swarm. A swarm of particles can be used locally or globally in a search space. In the local version of the PSO, gbest is replaced with lbest and the entire process is the same.
In general, all the real optimization problems are subject to a number of constraints. These constraints determine which areas of the search space are feasible and which are infeasible. However, the PSO was originally developed for unconstrained optimization and hence the algorithm described in previous must be modified to be able to handle with constraints. There are many contraint handling approaches such as repair algorithm, penalty function, feasibility preservation, and feasibility tournament [2,5,30]
IV. ESTIMATING THE VOCAL TRACT AREA FUNCTIONS USING PARTICLE SWARM OPTIMIZATION
As mentioned in section 1, the existing methods for estimating the vocal tract shapes from the speech signals suffer from the limiting in use problem. That they are only valid for a small subset of the speech sounds. Due to this main shortcoming, we need a new technique for estimating VTAF from speech signals which overcomes this serious problem associated with the existing methods.
A. Formulation of VTAF estimation problem
The complete specification of vocal tract requires specification of the change VTAF with time, A(x,t). Using the multi-sectional cylindrical tube approximation given in section 2, we can say that finding A(x) is equivalent to find the values of Si, where Si is the cross
section area of the section number i.
In general, estimating VTAF is done through minimizing a cost function [16]. The cost function usually consists of two components. One of these components represents the acoustic difference between the original speech and that synthesized from the estimated vocal tract. The other component represents continuity cost of the estimated Vocal tract. Many forms for the cost function are given in literature [6,7,11,16]. However we have suggested the following cost function:
∑ − − ∑ ∑ − − + ∑ + ∑ − ∑ ∑ − + ∑ + ∑ − = = = = = = − = = − = = T t i i i M i T t i i i M i M i i i i T t M i i i i T t T
t s o
t l t l t l t S t S t S t l t l t l t S t S t S t c t c C 2 1 2 1 2 1 1 2 1 1 1 | ) ( ) 1 ( ) ( | | ) ( ) 1 ( ) ( | | ) ( ) ( ) ( | | ) ( ) ( ) ( | | ) ( ) ( | (3)
Where, T is the number of frames in the speech portion under investigation. M is the number of sections used in modeling the vocal tract. co(t) and cs(t) are the spectral vectors of the frame t of the observed and synthesized speech signals. li(t) and Si(t) are the length and the
cross section area of section number i of the vocal of frame t.
The first component gives the acoustic cost: the difference between the observed speech spectral vector,co(t), and the synthesized speech spectral vector,
) (t
cs given the estimated vocal tract shape at time t. The other four terms measures the continuity cost of the estimated vocal tract shape. The advantage of the suggested cost function is that it measures both the spatial and the temporal variations of the vocal tract continuity. This gives a better performance than dealing individually with each frame in the speech segment especially for non-stationary sounds. As it takes into account the relations between vocal tract configurations that produced the different frames within the speech segment, minimizing this cost function will yield to the optimal vocal tract shape of the whole segment rather than the optimal vocal tract shape of each individual frame in the speech segment.
We must note that any algorithm for estimating the VTAF must find
S
i(
t
)
andl
i(
t
)
in such a way that the constraints about the vocal shape given in section 2 must be satisfied. So, the estimation of the vocal tract shape based on minimizing the cost function criteria can be viewed as an optimization problem with linear constrained in the form:Minimize: The cost function C Subject to:
Si(t) ≤ Smax ∀ i,t
li(t) ≤ Lmax ∀ i,t
∑ = ≤ ≤ M i t i l
1 () VT_length_max
min
VT_length_ ∀t
li(t) ≥ 0, Si(t) ≥ 0, ∀ i, t
Where Lmax and Smax are the maximum allowable length
and cross section area of the sections used in modeling the vocal tract, VT_length_max and VT_length_min are the maximum and minimum length of the vocal tract.
Hence, this idea can be used in proposing an algorithm for estimating the vocal tract configuration by solving this optimization problem.
In section 3, we have pointed out that the PSO algorithm is simple and provides an alternative to solve complex optimization problems. Each element of PSO such as the particle position coding scheme and parameters is specifically designed based upon the characteristics of the problem before the PSO can be applied to solve a particular problem. The main techniques of PSO-VTAF estimating approach are described as the following.
B. Encoding Scheme
In PSO-VTAF estimating approach, the speech portion is firstly divided into a number of frames with fixed size and the vocal tract configuration of each speech frame is encoded into a string as shown in Figure 6. Then, these encoded strings are grouped together into one string of length 2*M*T. This vector represents the “position” vector of a particle. The degree of “optimality” of each particle is evaluated at the kth iteration by computing its
cost using equation (3)
Figure 6: A string of real values represents vocal tract configuration.
V. EXPERIMENTAL RESULTS
In all the following experiments, we have used the cepstrum analysis to measure the acoustic cost part appears in the cost function given in equation (3) [18]. In this case, both co(t)and cs(t) are vectors of cepstrum coefficients which are driven from the campestral analysis of the frame t from both the observed speech and the synthesized speech [18].
Also, in all the following experiments, the vocal tract parameters Smax, VT_length_max, and VT_length_min
were set as 20, 19 and 15 respectively. These bounds constrain the space of VT configurations, driving out some unnatural solutions. Also, the M and Lmax
parameters were set as 50 and 1.5.
Concerning the characteristic parameters of the PSO, all the following experiments have been performed with the following set of parameters vales [33]:
1) The population size was set as 50 instead of using the recommended values (20 to 30). Because the VTAF is a high dimensional problem space, increasing the particle number in the algorithm can increase the chance for finding the optimal solution.
2) The inertia weight W was initially set as 0.75 and it was reduced by 1% at each generation to ensure good convergence
3) The acceleration coefficient constants c1 and c2 were set as 2.
4) The maximum number of iteration was set as 3000. Several experiments have been performed to test the performance of the proposed PSO-VTAF estimating system outlined in the previous section. Firstly, the applicability of the method was tested using a data set, in which all the sound, corresponding vocal tract shape and articulatory parameters are known. For this purpose, a set of articulatory targets was selected for 10 English vowels to drive the articulatory model to produce vocal tract shapes, and then synthetic sounds were generated based on the vocal tract shapes. The synthetic sounds were used as an input for the inverse estimation. The synthetic sounds have been created using VocalTractLab synthesizer [21]. The speech signal of each vowel is
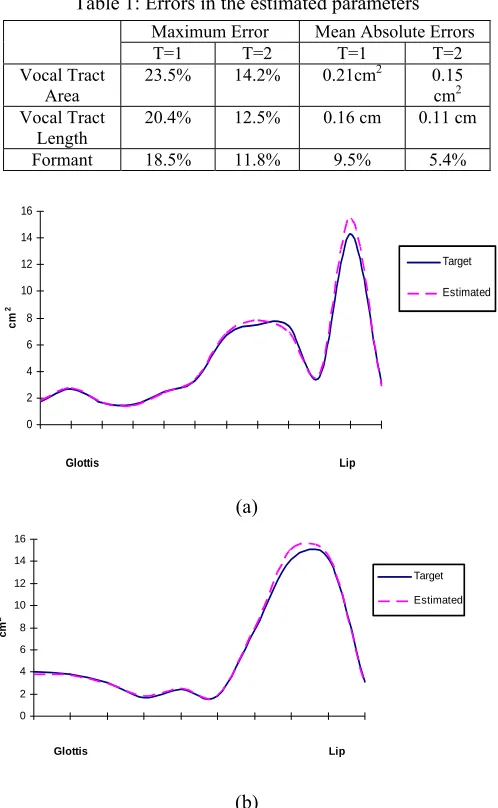
divided into frames using hamming window of length 20 ms. The accuracy of the method was evaluated by comparing the estimated vocal tract shapes and the given targets. The estimation method was also examined using acoustic parameters. In this case, the estimation error was defined as the average value of the difference between input sound and synthetic sound for the four lower formants. Using this synthetic data set, two experiments were performed. The objective of these experiments is showing the effect of representing both the spatial and the temporal variations of the vocal tract continuity in the cost function. In the first experiment the proposed system deal with each frame in the testing data individually during the estimation process (i.e. T=1 in the cost function). In this case, there is no representation for the temporal variations of the vocal tract continuity in the cost. In the second experiment, the proposed system deal with every two consecutive frames in the testing data together during the estimation process (i.e. T=2 in the cost function). Table 1 summarizes the results of these experiments. Examples of the target and the estimated VTAFs from the second experiment are shown in Figure 7.
Table 1: Errors in the estimated parameters Maximum Error Mean Absolute Errors T=1 T=2 T=1 T=2 Vocal Tract
Area 23.5% 14.2% 0.21cm
2 0.15
cm2
Vocal Tract Length
20.4% 12.5% 0.16 cm 0.11 cm
Formant 18.5% 11.8% 9.5% 5.4%
0 2 4 6 8 10 12 14 16
1 2 3 4 5 6 7 8 9 10 11 12
Glottis Lip
cm
2
Target
Estimated
(a)
0 2 4 6 8 10 12 14 16
1 2 3 4 5 6 7 8 9 10
Glottis Lip
cm
2
Target Estimated
(b)
Figure 7:The VTAFs: (a) vowel /AE/, (b) vowel /AO/ Area Length
1
The results demonstrated the validity of the proposed system for the inverse estimation. The PSO was able to derive anatomically consistent VT configurations, respect to shape of the area functions. That is a highly satisfactory result, considering the simple heuristics embodied in the cost function C. Also, it is clear that representing both the spatial and the temporal variations of the vocal tract continuity in the cost function gives a better performance than representing the spatial variations only.
Another set of experiments have been performed using actual speech corpus. This corpus included data extracted from MOCHA (Multi-CHannel Articulatory) database [4]. It consists of data from two speakers. Each speaker pronounced 460 sentences. Also, it includes parallel acoustic-articulatory information. The sampling rate of the acoustic waveform is 16 kHz. Number of sections was extracted from this database such that they contained various excitation modes. These selected sections consisted of vowel sequences and vowel–consonant– vowel sequences. Each section is divided into frames using hamming window of length 20 ms and every 2 consecutive frames constitute a testing portion of speech signal. The total number of frames was 2200 frame (1200 voiced frames and 1000 unvoiced frames). In this set of experiment, the accuracy of the method was evaluated using a subjective measure. Perceptual tests were performed in order to assess the quality of the synthetic speech. In this test, the synthetic signals were played and two listeners were asked to write what they heard. An error was counted if a listener wrote a sound distinct to the played one. The first listener was a male of age 45 and the second one was female of age 34. The global mean error (ratios of not recognized sounds divided by total number of sounds) was about 0.23. This recorded result is fairly good and demonstrate the validity of the proposed system for the inverse estimation for different kinds of speech sounds.
VI. CONCLUSIONS
We presented a new approach based on PSO to the problem of finding a close-to-natural area function of the vocal tract from the speech signal. This system is reliable and general, and can be applied in estimating the for vocal tract parameters for many classes of speech sounds. Both objective and subjective evaluations positively verify the feasibility of the developed PSO for retrieving the parametric model underlying natural utterances.
The experimental results of the proposed system are promising. However, the reported experiments are preliminary and further studies should be directed to enhance the performance of the system. These may include: encoding more knowledge into the objective function such as formants, and use another way to measure acoustic difference in the cost function such as MFC.
REFERENCES
[1] A Moore, “The Correspondence of the Vocal Tract Resonance with Volumes Obtained from Magnetic Resonance Image”, Journal of Speech and Hearing Research, vol. 35, pp. 1009-1023, 1992.
[2] A. El-Gallad, M. El-Hawary and A. Sallam, “Swarming of Intelligent Particle for Solving the Nonlinear Constrained Optimization Problem”, International Journal of Engineering Intelligent Systems for Electrical Engineering and Communications, vol. 9, no. 3, pp. 155-163 , 2001.
[3] A. S. Leonov, and V. Sorokin, “Optimality Criteria in Inverse Problems for Tongue-Jaw”, In Proc. EuroSpeech. Genova, pp. 2353-2356, Italy, 2003.
[4] A. Wrench, “A New Resource for Production Modeling in Speech Technology”, in Proc. Workshop on Innovations in Speech Processing, Stratford-upon-Avon, 2001.
[5] G. Coath and S. Halgamuge, “A comparison of Constraint-Handling Methods for the Application of Particle Swarm Optimization to Constrained Nonlinear Optimization Problems”, Proc. of the 2003 Congress on Evolutionary Computation, vol. 4, pp. 2419 – 2425 Canberra- Australia, December 2003
[6] H. B. Richardst, J. S. Mason, M. J. Hunt and J. S. Bridls, “Deriving Articulatory Representations from speech with Various Excitation Modes”, Proc. of ICSLP '96, vol. 2, pp. 1233-1236, Philadelphia- USA
[7] H. B. Richardst, J. S. Mason, M. J. Hunt and J. S. Bridls, “Vocal Tract Shape Trajectory Estimation Using MLP Analysis-by-Synthesis”, Proc. of ICASSP, vol. 2, pp. 1287, Munich - Germany, 1997
[8] H. Story, I. R. Titze, and E. A Hoffman, “Vocal Tract Area Functions from Magnetic Resonance Imaging”, J.Acoustic Soc. Am., vol. 100, no. 1, pp. 537-54, July, 1996.
[9] H. Wakita, “Direct Estimation of the Vocal Tract Shape by Inverse Filtering of Acoustic Speech Waveforms”, IEEE Trans. Audio Electroacoust. vol. 21, pp. 417- 427, 1973
[10] H. Yehia, and F. Itakura, “A Method to Combine Acoustic and Morphological Constraints in the Speech Production Inverse Problem”, Speech Communication vol. 18, pp. 151 - 174, 1996.
[11] J. Brito, “Genetic Learning of Vocal Tract Area Functions for Articulatory Synthesis of Spanish Vowels”, Applied Soft Computing, vol. 7, pp. 1035-1043, 2007.
[12] J. Dang and K. Honda, “Estimation of Vocal Tract Shapes from Speech Sounds with a Physiological Articulatory Model”, Journal of Phonetics, vol. 30, pp. 511-532, 2002.
[13] J. Kennedy and R. Eberhart, “Particle Swarm Optimization”, Proc. IEEE International Conf. on Neural Networks, vol. 4, pp. 1942-1948, Australia, 1995 [14] J. Kennedy, R. Eberhart and Y. Shi, Swarm Intelligence,
Morgan Kaufmann Publishers, 2001.
[15] J. L. Jr. Kelly, and C. C. Lochbaum, “Speech Synthesis”, Fourth International Congress on Acoustics, Copenhagen, 1962.
[18] L.R. Rabiner, R.W. Schafer, Digital Processing of Speech Signals, Prentice-Hall, 1978.
[19] M. R. Schroeder, “Determination of the Geometry of the Human Vocal Tract by Acoustic Measurement”, Journal of the Acoustical Society of America, vol. 4, no. 2, pp. 1002-1010, 1967.
[20] M. Sondhi, “ Model for Wave Propagation in Lossy Vocal Tract”, Journal of the Acoustical Society of America, vol. 55, pp. 1070, 1974
[21] P. Birkholz, “VocalTractLab”,
http://www.vocaltractlab.de/
[22] R. Eberhart and Y Shi, “Particle Swarm Optimization: Developments, Applications and Resources”, Proc. of the 2001 Congress on Evolutionary Computation, vol. 1, pp. 81 – 86,2001.
[23] R.S. McGowan, “Recovering Articulatory Movement from Formant Frequency Trajectories using Task Dynamics and a Genetic Algorithm: Preliminary Model Tests”, Speech Communication, vol. 14, pp. 19- 48, 1994.
[24] S. Atal, J. Chang, J. Mathews, and W. Tukey, “Inversion of Articulatory-to-Acoustic Transformation in the Vocal Tract by a Computer-Sorting Technique”, Journal of the Acoustical Society of America, vol. 63, pp. 1535-1555 1978.
[25] S. Dusan, and L. Deng, “Acoustic-to-Articulatory Inversion using Dynamic and Phonological Constraints”, Proc. of the Fifth Speech Production Seminar, Germany, 2000.
[26] S. Dusan, and L. Deng, “Recovering Vocal Tract Shapes from MFCC Parameters”, In Proc. of the International Conference of Spoken Language Processing, vol. 7, pp. 3087–3090, 1998.
[27] T. Okadome, S. Suzuki, and M. Honda, “Recovering of Articulatory Movements from Acoustic with Phonemic
Information”, In the 5th Speech Production Seminar,
Munich- Germany, 2000.
[28] T. Quatieri, Discrete-time Speech Signal Processing, Prentice-Hall, New Jersey - USA, 2002.
[29] V. Sorokin, A.S. Leonov, I. Makarov, and A. Tsyplikhin, “Speech Inversion and Resynthesis”, In Proc. of Interspeech. pp. 3209-3212, Lisboa- Portugal, 2005. [30] X.Hu and R. C. Eberhart, “Solving Constrained
Nonlinear Optimization Problems with Particle Swarm Optimization”, Proc. of the Sixth World Multiconference on Systems, Cybernetics and Informatics, Orlando-USA, 2002
[31] Y. Shi and R. Eberhart, "A Modified Particle Swarm Optimizer", IEEE International Conf. on Evolutionary Computation, pp. 69 – 73, 1998.
[32] Y. Shi and R. Eberhart, "Empirical Study of Particle Swarm Optimization", Proc. of the 1999 Congress on Evolutionary Computation, vol. 3, pp. 1950, 1999. [33] Y. Shi and R. Eberhart, "Parameter Selection in Particle
Swarm Optimization", Proc. Seventh Annual Conf. on Evolutionary Programming, pp. 591 – 600, 1998.
Mahmoud A. Ismael received the B.Sc. degree (honors)