Pharmacophore 2014, Vol. 5 (2), 202-218 USA CODEN: PHARM7 ISSN 2229-5402
Pharmacophore
(An International Research Journal)
Available online at http://www.pharmacophorejournal.com/
Original Research Paper
BIOANALYTICAL METHOD DEVELOPMENT AND VALIDATION FOR
SIMULTANEOUS DETERMINATION OF LINAGLIPTIN AND METFORMIN
DRUGS IN HUMAN PLASMA BY RP-HPLC METHOD
Rutvik H Pandya
*
,Rajeshwari Rathod and Dilip G. Maheswari
L. J. Institute of Pharmacy, Sarkhej Circle & Katariya Motors, S.G. Road,Ahmedabad,
Gujarat-382210, India
ABSTRACT
A simple, rapid, precise and accurate high performance liquid chromatography method was developed for simultaneous determination of linagliptin and metformin in human plasma. The analytes were extracted by protein precipitation technique and chromatograph using a mobile phase consisting of acetonitrile and 0.01M di-potassium hydrogen phosphate buffer in ratio of 75:25 and adjusting pH 7.0 with orthophosphoric acid using Grace vyadyec genesis CN (150 × 4.6 mm, 4 µm) column. The flow rate 1.0 mL min-1 and UV detection at 237 nm was employed. The retention time for linagliptin and metformin and internal standard (phenformin) was 4.95, 15.41 min and 11.06 min respectively. Linearity for linagliptin and metformin was found to be in the range of 1-32 ng/mL for both drugs respectively. The method was validated as per the USFDA guidelines and the results were within the acceptance criteria for selectivity, sensitivity, linearity, precision, accuracy, recovery stability of solution, stability of solution in plasma and dilution integrity.
Keywords:
Linagliptin, Metformin, Phenformin, Protein precipitation, Human plasma, RP-HPLC, Simultaneous determination.INTRODUCTION
The combination of linagliptin and metformin is available as tablets formulation for oral use in diabetes. metformin
(1-carbamimidamido-N,N-Dimethylmethanimidamide is biguanides
introduced in 1950 as glucose-lowering agents to treat non-insulin-dependent diabetes mellitus (NIDDM).It reduces elevated blood glucose concentration in diabetic patients, but it does not increase insulin secretion. Biguanide is used alone or in combination with insulin or chlorpropamide. It is reported in pharmacopoeias such as BP1 and USP2. Linagliptin (8-[(3R)-3-aminopiperidin-1-yl]-7-(but-2-yn-1-yl)-3-methyl-1[(4methylquina- zolin -2-yl) methyl]-2, 3, 6, 7-tetrahydro-1H-purine-2, 6-Dione) linagliptin is not extensively metabolized, 90% of dose is excreted unchanged.
MATERIAL AND METHODS
Instrumentation
The HPLC system used was HPLC Shimadzu LC-2010C HT, series equipped with a 0.1 to 100 µL sample loop, and LC-100 UV Detector. The output signal was monitored and integrated using Lab Solution version software. Grace vyadyec genesis CN (150 × 4.6 mm, 4 µm) column was used for the separation.
Materials
The drug sample of linagliptin obtained from Manus Aktteva Bio Pharma, Ahmedabad and
metformin was obtained from Intas
Pharmaceuticals Ltd, Ahmedabad and phenformin was obtained from Cadila Pharmaceuticals Ltd, Ahmedabad. Acetonitrile HPLC Grade (Fisher Scientific, India), HPLC Grade water (Fisher Scientific, India), HPLC Grade methanol, dichloromethane (DCM), diethyl ether (DEE), tertiary butyl methyl ether (TBME), (ethyl acetate)EA, trichloro acetic acid (TCA), and perchloric acid (PCA) from (Fisher Scientific, India) are used in the study.
Chromatographic Conditions
The analysis was carried out on HPLC Shimadzu LC-2010C HT system using a Grace vyadyec genesis CN (150 × 4.6 mm, 4 µm) column as a stationary phase with UV detection at 237 nm at ambient room temperatures using a 10 µL injection volume.
Mobile Phase
A mixture of acetonitrile and 0.01M di-potassium hydrogen phosphate buffer in ratio of (75:25) and adjusted to pH 7.0 using o-phosphoric acid, filtered, degassed and used. 0.01M Di-potassium hydrogen phosphate buffer (pH 7.0) prepared in 100 ml volumetric flask, add 17.41 gm of di-potassium hydrogen phosphate and dissolve it in some of amount of HPLC grade water, and make up to volume with HPLC grade water. Adjust the pH 7.0 of resultant buffer by orthophosphoric acid, as required.13-16
Preparation of Solution
Stock solution of linagliptin was prepared by, linagliptin 5 mg is accurately weighed on analytical precision balance and transferred in 50
ml of volumetric flask and dissolve in some amount of HPLC grade methanol, shake it until it dissolve and than make up to mark with HPLC grade methanol which was labeled as stock-1 solution (100 µg/ml). From that stock-1 solution, 1 ml was transferred by means of pipette in 10 ml of volumetric flask which was than make up to mark with HPLC grade methanol which was finally labelled as Stock-2 solution (10 µg/ml). Stock solution of metformin was prepared by, metformin 10 mg was accurately weighed on analytical precision balance and transferred in 50 ml of volumetric flask and dissolve in some amount of HPLC grade methanol, shake it until it dissolve and than make up to mark with HPLC grade methanol which was labelled as Stock-1 solution (200 µg/ml). From that Stock-1 solution, 0.5 ml was transferred by means of pipette in 10 ml of volumetric flask which was than make up to mark with HPLC grade methanol which was finally labelled as Stock-2 solution (10 µg/ml). Working standard solution-1 (WS-1) of was prepared by, using a calibrated micropipette, 100 µl of each LNG and MET Stock-2 solutions were added to 10 ml volumetric flask and volume made up to 10 ml with methanol which have 100 ng/ml of LNG and MET respectively.
Working standard solution-2 (WS-2) of was prepared by using a calibrated pipette, 1 ml of WS-1 was added to 10 ml volumetric flask and volume made up to 10 ml with methanol which have 10 ng/ml of LNG and MET respectively. All the solutions were stored in a refrigerator at 2-8 o
C until use
Sample Preparation
Protein precipitation with acid: Drug+ 200μl spiked plasma + 50 μl IS + 50 μl of 2% perchloric acid + 1000 μl acetonitrile and vortex to mix. Centrifuged for 07-10 minutes at 8000 rpm at 4ºC and supernatant was collected. Supernatant was evaporated to dryness using nitrogen gas and reconstituted with 50 μl of mobile phase, and 10μl sample was analysed.
Preparation of Plasma Calibration Curve Standards and Quality Control Standards
control standards, take volume as mentioned in
table, evaporate solvent using nitrogen
evaporator.17 Add 200 µl Human plasma which
had been checked for specificity and vortex for 30 sec. then follow sample preparation method:
Details Vol. pipette from Vol. pipette (µl) Concentration (ng/ml) Concentration (ng/ml)
Linagliptin Metformin
S1 WS-1 320 32 32
S2 WS-1 160 16 16
S3 WS-1 100 10 10
S4 WS-1 80 8 8
S5 WS-2 400 4 4
S6 WS-2 200 2 2
S7 WS-2 100 1 1
LLOQ WS-2 100 1 1
HQC WS-1 200 20 20
MQC WS-1 90 9 9
LQC WS-2 300 3 3
Method Development
The mobile phase consisting of acetonitrile and 0.01M Di-potassium hydrogen phosphate buffer in varying proportions and change in pH was tried and finally ratio of 75:25 (pH-7.0 adjusted with orthophosphoric acid) was selected because it was found to give good separation for the peaks of linagliptin (Rt-5.55 min) and metformin (Rt-7.48
min) and IS (Rt-7.48 min) respectively as shown in
the figure 1. In addition to this, UV spectra of individual drugs were recorded at the wavelength range from 200 to 400 nm and the response for optimization was compared. The choice of wavelength 237 nm was considered satisfactory, permitting the detection of drugs with adequate sensitivity.
Method Validation
The method was validated in accordance with USFDA guidelines and EMEA guidelines.18-20 System Suitability
System suitability experiment was performed by injecting six consecutive injections using aqueous standard mixture equivalent to MQC (Mid quality control sample) concentration of the calibration curve for all analytes and 1000 ng/ml for IS. System suitability was performed at the start of the
method validation and on each day as a first experiment.
Selectivity
The selectivity of HPLC Method was established by screening the standards blanks of different lots of Human Plasma. Six different lots of plasma were screened for the Experiment. All six lots were found to be free of Significant interferences at the Retention time of all analytes in standard blank samples was ≤ 20.00% of the area of the drug in the Extracted LLOQ (Lower Limit of Quantification) Samples; area of peak at the Retention time of IS in the standard blank samples was ≤ 5.00% of the area of the IS in the Extracted LLOQ Sample as per acceptance limit.
Sensitivity
The sensitivity of the method was evaluated by analyzing 6 LLOQ at 1ng/ml for LNG and MET respectively.
Calibration Curve/Linearity
standard concentration ranging from 1-32 ng/ml range for LNG and MET.
Precision
The precision of the HPLC-UV method was evaluated by the %CV at different concentration levels corresponding to LLOQ, LQC, MQC and HQC during the course of validation.
Within-batch precision
The %CV of back calculated concentrations for all quality control samples at LLOQ, LQC, MQC and HQC concentration levels with four replicates for LNG and MET were spiked combined with plasma sample and were being analyzed by HPLC.
Between-batch precision
The %CV of back calculated concentrations for all quality control samples at LLOQ, LQC, MQC and HQC concentration levels from three different batches of four replicates at each QC levels for LNG and MET were spiked combined with plasma sample and were being analyzed by HPLC.
Accuracy
The accuracy of the HPLC-UV method was evaluated by the % nominal concentration at different concentration levels corresponding to LLOQ, LQC, MQC and HQC during the course of validation.
Within-batch accuracy
The percentage nominal of back calculated concentrations for all quality control samples of LLOQ, LQC, MQC and HQC concentration levels with four replicates for LNG and MET were spiked combined with plasma sample and were being analyzed by HPLC.
Between-batch accuracy
The percentage nominal of back calculated concentrations for all quality control samples at LLOQ, LQC, MQC and HQC concentration levels from three different batches of four replicates at each QC levels for LNG and MET were spiked combined with plasma sample and were being analyzed by HPLC.
Recovery
The percentage mean recoveries were determined by measuring the responses of the quality control samples spiked into plasma against respective
aqueous quality control samples at LQC, MQC and HQC levels. Three samples at each level were analyzed after extraction of each individual drug in separate solvent and % Nominal concentration of the sample was calculated.
Short Term Stock Solutions Stability of Analytes and Internal Standard
Short term stock solution stability for the LNG, MET and IS at concentration 100 µg/ml were determined by using stock solution dilution equivalent to concentration of 1000 ng/ml for LNG, MET and IS respectively, after storage of stock solution over a period of 6 hours at room temperature. Stability was assessed by comparing against the freshly prepared stock. The % mean stability was calculated.
Long Term Stock Solutions Stability of Analytes and Internal Standard
Long term stock solution stability for the LNG, MET and IS at concentration 100 µg/ml were determined by using stock solution dilution equivalent to concentration of 1000 ng/ml for LNG, MET and IS respectively, after storage of primary stock solution over a period of 20 days at 2-8°C. Stability was assessed by comparing against the freshly prepared stock. The % mean stability was calculated.
Bench Top Stability
Bench top stability of the spiked quality control samples was determined for a period of 6 hr. stored at room temperature. Stability was assessed by comparing them against the freshly spiked calibration standards.
Auto Sampler Stability
Auto sampler stability of the processed quality control samples was determined for a period of 24 hours by storing them in auto sampler maintained at 15°C. Stability was assessed by comparing processed sample against the freshly spiked calibration standards
Freeze Thaw Stability
calibration standards.
Long Term Stability
Long term stability of the spiked quality control samples was determined after stored at -80 °C for 14 days. Stability was assessed by comparing them against the freshly spiked calibration standards.
Dilution Integrity
The dilution integrity of the method was evaluated by diluting the stock concentration sample as spiked standard at concentration 1000 ng/ml for LNG & MET, 1000 ng/ml conc. samples were diluted to 500 ng/ml (2 times) and 1000 ng/ml samples were diluted to 250 ng/ml (4 times) in blank plasma. The precision and accuracy for dilution integrity standards at 1/2 and 1/4 dilution were determined by analyzing the samples against calibration curve standards
RESULTS AND DISCUSSION
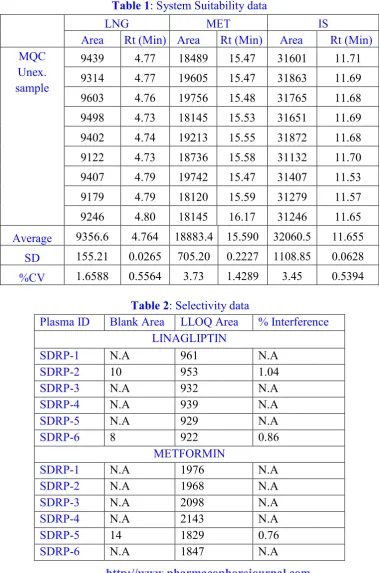
System Suitability
The %CV of the retention times was found to be ≤ 1.42 for all analytes and IS. The %CV of the peak area was found to be ≤ 3.7 for all analytes and IS. Acceptance limit for retention time (Rt) deviation and area deviation 2% and 5%CV respectively were passed. The results are summarized in Table-1.
Selectivity
All six lots were found to be free of Significant interferences at the Retention time of all analytes in standard blank samples was ≤ 20.00% of the area of the drug in the Extracted LLOQ (Lower Limit of Quantification) Samples; area of peak at the Retention time of IS in the standard blank samples was ≤ 5.00% of the area of the IS in the Extracted LLOQ Sample as per acceptance limit. In optimization trials we choose such method where plasma lots were found to be free of significant interferences at the Retention time of all analytes in standard blank samples The Result is summarized in Table-2.
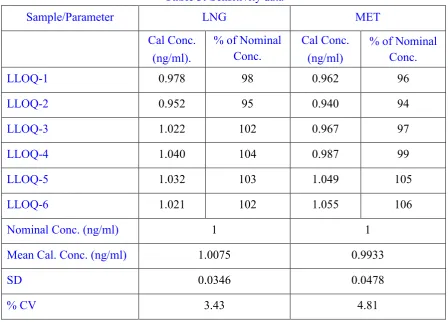
Sensitivity
The precision and accuracy for MET at LLOQ level were found to be 4.81 %CV and 96 to 106% nominal respectively. Acceptance criteria is at least 67% of the sample should be within 80-120%
of nominal and precision should be <20 %CV. The results are summarized in the Table-3.
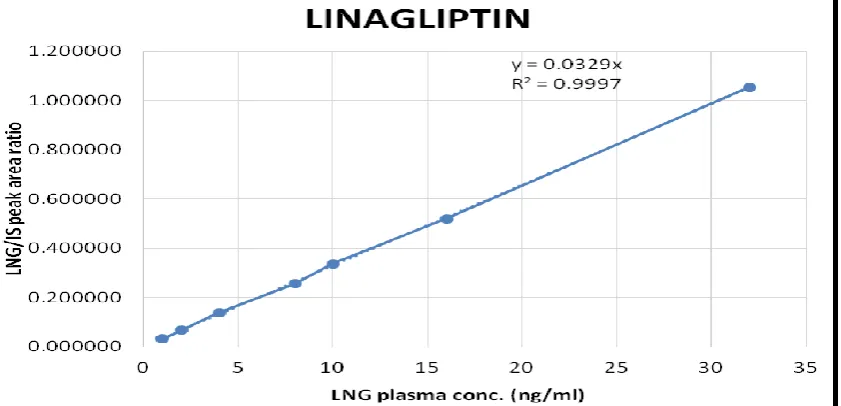
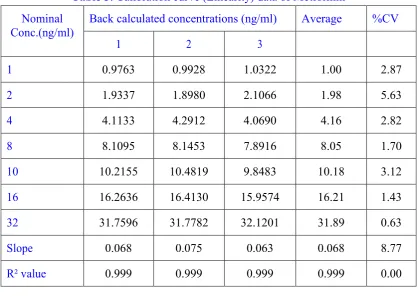
Calibration Curve/Linearity
Representative calibration curve is shown in figures which are obtained during the precision and accuracy batch. The average correlation coefficient (R²) was ≥ 0.99 during the course of validation.
Data of calculated calibration standard
concentration are shown in Table-4 and Table-5 respectively
Precision
Within batch precision
The %CV of back calculated concentrations for all quality control samples of LLOQ, LQC, MQC and HQC concentration levels with four replicates for LNG and MET were within 1.325 to 9.823% and 0.248 to 3.382% respectively. Acceptances criteria are that at least 67% of QC samples must be within 15% except LLOQ where limit is within 20%. Between batch precision
The %CV of back calculated concentrations for all quality control samples at LLOQ, LQC, MQC and HQC concentration levels from three different batches of four replicate at each QC levels were found within 1.632 to 7.708% and 0.784 to 2.883% for LNG and MET respectively. Acceptances criteria are that at least 67% of QC samples must be within 15% except LLOQ where limit is within 20%. The results are shown in Table-7,8 and 9 summarized in the Table-6.
Accuracy
Within batch accuracy
The percentage nominal of back calculated concentrations for all quality control samples of LLOQ, LQC, MQC and HQC concentration levels with four replicates for LNG and MET respectively were within 97-103% and 99-104% respectively. Acceptance criteria are that at least 67% of QC samples must be within 85-115%. Between batch accuracy
99-102% respectively. Acceptances criteria are that at least 67% of QC samples must be within 85-115%. The results are shown in Table-7,8 and 9 summarized in the Table-6.
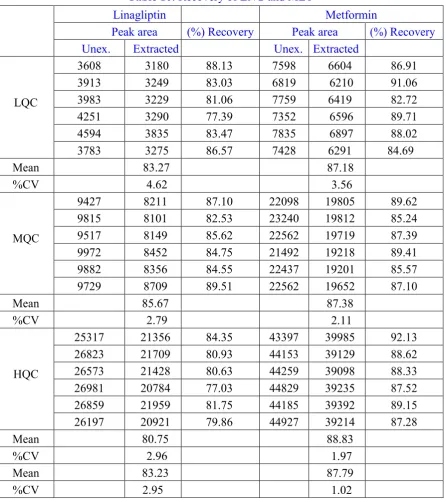
Recovery
The % mean recovery of drugs acceptable limit was % CV of 15 and that of IS was % CV of 20.The results are shown in Table-10 and 11.
Short Term Stock Solution Stability of Analytes and Internal Standard
Short term stock solution stability for the LNG, MET and IS at concentration 100µg/ml were determined by using stock solution dilution equivalent to concentration of 1000ng/ml for LNG, MET and IS respectively, after storage of stock solution over a period of 6 hours at room temperature. Stability was assessed by comparing against the freshly prepared stock. The % mean stability was found to be 96.88, 97.07 and 97.88% for LNG, MET, and IS respectively which is within the acceptance limit of 90.00 – 110.00%. The results are summarized in the Table-12.
Long Term Stock Solution Stability of Analytes and Internal Standard
Long term stock solution stability for the LNG, MET and IS at concentration 100µg/ml were determined by using stock solution dilution equivalent to concentration of 1000ng/ml for LNG, MET and IS respectively, after storage of primary stock solution over a period of 20 days at 2-8°C. Stability was assessed by comparing against the freshly prepared stock. The % mean stability was found to be 91.68, 90.14, and 95.87% for LNG, MET, and IS respectively which is within the acceptance limit of 90.00 – 110.00%. The results are summarized in the Table-12.
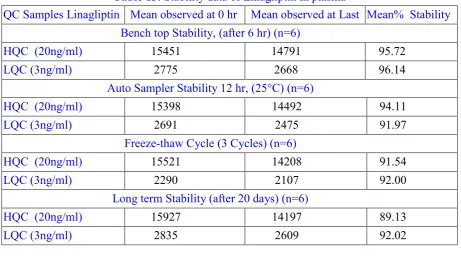
Bench Top Stability
Bench top stability of the spiked quality control samples was determined for a period of 6 hr. stored at room temperature. Stability was assessed by comparing them against the freshly spiked calibration standards. The % mean stability for LQC & HQC was found to be 96.14% & 95.72% and 98.13% & 97.69% for LNG and MET respectively. This is within the acceptance limit. Acceptance Criteria is at least 67% QC samples
should pass acceptance limit of 85-115% and more than 50% at each QC level should fail. Results are summarized in Table-13 and 14 for LNG and MET respectively.
Auto Sampler Stability
Auto sampler stability of the processed quality control samples was determined for a period of 24 hours by storing them in auto sampler maintained at 15°C. Stability was assessed by comparing processed sample against the freshly spiked calibration standards. The % mean stability for LQC & HQC was found to be 91.97% & 94.11% and 97.66% & 98.38% for LNG and MET respectively. This is within the acceptance limit. Acceptance Criteria is at least 67% QC samples should pass acceptance limit of 85-115% and more than 50% at each QC level should fail. Results are summarized in Table-13 and 14 for LNG and MET respectively.
Freeze Thaw Stability
Freeze thaw stability of the spiked quality control samples was determined after three freeze thaw cycles stored at -80 °C. Stability was assessed by comparing them against the freshly spiked calibration standards. The % mean stability for LQC & HQC was found to be 92.00% & 91.54% and 98.95% & 96.91% for LNG and MET respectively. This is within the acceptance limit. Acceptance Criteria is at least 67% QC samples should pass acceptance limit of 85-115% and more than 50% at each QC level should fail. Results are summarized in Table-13 and 14 for LNG and MET respectively.
Long Term Stability
Dilution Integrity
The dilution integrity of the method was evaluated by diluting the stock concentration sample as spiked standard at concentration 1000ng/ml for LNG & MET, 1000ng/ml conc. samples were diluted to 500ng/ml (2 times) in blank plasma and The precision and accuracy for dilution integrity standards at 1/2 dilution were determined by analyzing the samples against calibration curve standards. The precision for dilution integrity of 1/2 was found to be 4.94 and 6.57% for LNG and Met respectively which is within the acceptance limit of <15%. The % mean accuracy for dilution integrity of 1/2 was found to be within 93.46-107.48% and 93.68-110.02% for LNG and MET respectively which is within acceptance limit 85.00-115.00%. The results are summarized in
Table-15.
CONCLUSION
A Simple, Rapid and Economic RP-HPLC method for simultaneous determination of Linagliptin and Metformin from human plasma was developed and validated. All the analytes and internal standard (Phenformin) were chromatographed on reverse phase CN column-grace vyadec genesis (150 mm × 4.6 mm × 4 μm) using Acetonitrile : di-potassium hydrogen phosphate buffer (0.01M, pH=7) 75:25 mobile phase at flow rate 1 ml/min over 18 min run time. Detection of analysis was performed at their specific wavelength by UV
detector. Linagliptin and Metformin were extracted from human plasma using different solvents and analyzed by RP-HPLC method. Developed method was optimized prior to validation studies in terms of optimization of extraction procedure, mobile phase composition, flow rate, etc. The total chromatographic run time was 18 min with retention time for Linagliptin, Metformin and Internal Standard (Phenformin) as 4.95 min, 15.41 min and 11.06 min respectively. The developed method was validated in human plasma matrix, with a range of 1 to 32 ng/ml for Linagliptin and Metformin which is at very sensitive level even using simple mobile phase. The method was validated for all the parameter such as specificity, sensitivity, linearity, accuracy, precision, recovery, dilution integrity, stability as per USFDA and EMEA guidelines on bioanalytical method validation
ACKNOWLEDGEMENT
The authors are thankful to Dr. Manish Nivsarkar, Director of B. V. Patel Pharmaceutical Education and Research Development Centre (PERD), Ahmedabad, India for providing all the facilities to carry out the work. The authors are thankful to Manus Aktteva Bio Pharma Pvt. Ltd. Ahmedabad, India, Intas Pharma, Ahmedabad, India and Cadila pharmaceuticals Ltd, Ahmedabad, India. for providing reference standard and sample of
Linagliptin, Metformin and Phenformin
respectively.
Figure1: Chromatogram of unextracted sample
Figure 2: Chromatogram of blank plasma sample
Figure 3: Chromatogram of extracted plasma sample
Chromatogram of Extracted sample, LNG (Rt-4.9min), PHEN (Rt-11min) and MET (15.4min)
Figure 5: Linearity plot of Metformin
Table 1: System Suitability data
LNG MET IS
Area Rt (Min) Area Rt (Min) Area Rt (Min)
MQC Unex. sample
9439 4.77 18489 15.47 31601 11.71
9314 4.77 19605 15.47 31863 11.69
9603 4.76 19756 15.48 31765 11.68
9498 4.73 18145 15.53 31651 11.69
9402 4.74 19213 15.55 31872 11.68
9122 4.73 18736 15.58 31132 11.70
9407 4.79 19742 15.47 31407 11.53
9179 4.79 18120 15.59 31279 11.57
9246 4.80 18145 16.17 31246 11.65
Average 9356.6 4.764 18883.4 15.590 32060.5 11.655
SD 155.21 0.0265 705.20 0.2227 1108.85 0.0628
%CV 1.6588 0.5564 3.73 1.4289 3.45 0.5394
Table 2: Selectivity data
Plasma ID Blank Area LLOQ Area % Interference LINAGLIPTIN
SDRP-1 N.A 961 N.A
SDRP-2 10 953 1.04
SDRP-3 N.A 932 N.A
SDRP-4 N.A 939 N.A
SDRP-5 N.A 929 N.A
SDRP-6 8 922 0.86
METFORMIN
SDRP-1 N.A 1976 N.A
SDRP-2 N.A 1968 N.A
SDRP-3 N.A 2098 N.A
SDRP-4 N.A 2143 N.A
SDRP-5 14 1829 0.76
Table 3: Sensitivity data
Sample/Parameter LNG MET
Cal Conc. (ng/ml).
% of Nominal Conc.
Cal Conc. (ng/ml)
% of Nominal Conc.
LLOQ-1 0.978 98 0.962 96
LLOQ-2 0.952 95 0.940 94
LLOQ-3 1.022 102 0.967 97
LLOQ-4 1.040 104 0.987 99
LLOQ-5 1.032 103 1.049 105
LLOQ-6 1.021 102 1.055 106
Nominal Conc. (ng/ml) 1 1
Mean Cal. Conc. (ng/ml) 1.0075 0.9933
SD 0.0346 0.0478
% CV 3.43 4.81
Table 4: Calibration curve (Linearity) data of Linagliptin
Nominal Conc.(ng/ml)
Back calculated concentrations (ng/ml) Average %CV
1 2 3
1 1.0089 0.9819 1.0206 1.00 1.97
2 2.1849 2.0953 2.1878 2.16 2.43
4 3.9828 4.3525 3.8776 4.07 6.12
8 8.5371 7.9852 8.0253 8.18 3.76
10 10.6170 10.5297 10.2210 10.46 1.98
16 16.6976 16.2477 15.9596 16.30 2.28
32 32.2265 32.9610 33.1235 32.77 1.45
Slope 0.032 0.032 0.037 0.033 8.57
Table 5: Calibration curve (Linearity) data of Metformin
Nominal Conc.(ng/ml)
Back calculated concentrations (ng/ml) Average %CV
1 2 3
1 0.9763 0.9928 1.0322 1.00 2.87
2 1.9337 1.8980 2.1066 1.98 5.63
4 4.1133 4.2912 4.0690 4.16 2.82
8 8.1095 8.1453 7.8916 8.05 1.70
10 10.2155 10.4819 9.8483 10.18 3.12
16 16.2636 16.4130 15.9574 16.21 1.43
32 31.7596 31.7782 32.1201 31.89 0.63
Slope 0.068 0.075 0.063 0.068 8.77
R² value 0.999 0.999 0.999 0.999 0.00
Table 6: Summary of precision and accuracy data
Sample ID Precision (% CV) Accuracy (% of nominal Conc.)
Linagliptin Metformin Linagliptin Metformin
a Intra-day (n = 4)
LLOQ 2.715 3.382 104 102
LQC 9.823 3.341 97 99
MQC 1.983 1.944 103 102
HQC 1.325 0.248 103 104
b Inter-day (n = 12)
LLOQ 1.632 2.883 102 99
LQC 7.708 2.398 85 99
MQC 2.391 1.613 89 101
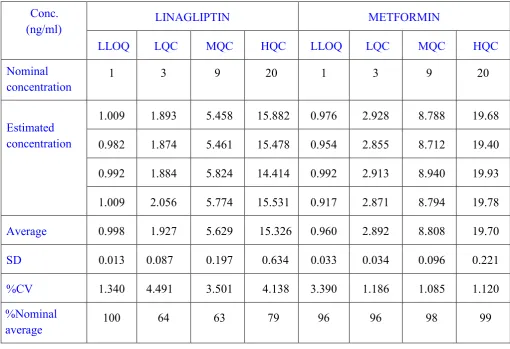
Table 7: Precision and Accuracy batch no-1 Conc.
(ng/ml) LINAGLIPTIN METFORMIN
LLOQ LQC MQC HQC LLOQ LQC MQC HQC
Nominal concentration
1 3 9 20 1 3 9 20
Estimated concentration
1.009 1.893 5.458 15.882 0.976 2.928 8.788 19.68
0.982 1.874 5.461 15.478 0.954 2.855 8.712 19.40
0.992 1.884 5.824 14.414 0.992 2.913 8.940 19.93
1.009 2.056 5.774 15.531 0.917 2.871 8.794 19.78
Average 0.998 1.927 5.629 15.326 0.960 2.892 8.808 19.70
SD 0.013 0.087 0.197 0.634 0.033 0.034 0.096 0.221
%CV 1.340 4.491 3.501 4.138 3.390 1.186 1.085 1.120
%Nominal
average 100 64 63 79 96 96 98 99
Table 8: Precision and Accuracy batch no-2
Conc. (ng/ml)
LINAGLIPTIN METFORMIN
LLOQ LQC MQC HQC LLOQ LQC MQC HQC
Nominal
concentration 1 3 9 20 1 3 9 20
Estimated concentration
1.022 3.090 9.079 20.333 1.030 3.091 9.341 20.789
1.022 2.652 8.911 20.178 0.993 2.925 9.289 20.304
1.040 3.027 9.082 20.092 1.013 2.951 9.377 20.514
1.029 2.605 9.286 20.457 0.989 3.057 9.009 20.457
Average 1.028 2.843 9.089 20.265 1.006 3.006 9.254 20.516
SD 0.009 0.251 0.154 0.162 0.019 0.080 0.168 0.202
%CV 0.842 8.811 1.689 0.802 1.878 2.666 1.810 0.985
%Nominal average
Table 9: Precision and Accuracy batch no-3 Concentration
(ng/ml) LLOQ LQC Linagliptin MQC HQC LLOQ LQC Metformin MQC HQC
Nominal Conc. 1 3 9 20 1 3 9 20
Estimated Conc. 1.032 2.952 9.464 20.305 1.032 3.106 9.279 20.799
1.021 3.101 9.424 20.422 1.039 3.006 9.395 20.913
1.038 3.074 9.061 20.515 1.035 2.901 8.972 20.819
1.085 2.487 9.247 20.930 0.967 2.896 9.247 20.873
Average 1.044 2.904 9.299 20.543 1.018 2.977 9.223 20.851
SD 0.028 0.285 0.184 0.272 0.034 0.099 0.179 0.052
%CV 2.715 9.823 1.983 1.325 3.382 3.341 1.944 0.248
%Nominal
average 104 97 103 103 102 99 102 104
Table 10: Recovery of LNG and MET
Linagliptin Metformin
Peak area (%) Recovery Peak area (%) Recovery
Unex. Extracted Unex. Extracted
LQC
3608 3180 88.13 7598 6604 86.91
3913 3249 83.03 6819 6210 91.06
3983 3229 81.06 7759 6419 82.72
4251 3290 77.39 7352 6596 89.71
4594 3835 83.47 7835 6897 88.02
3783 3275 86.57 7428 6291 84.69
Mean 83.27 87.18
%CV 4.62 3.56
MQC
9427 8211 87.10 22098 19805 89.62
9815 8101 82.53 23240 19812 85.24
9517 8149 85.62 22562 19719 87.39
9972 8452 84.75 21492 19218 89.41
9882 8356 84.55 22437 19201 85.57
9729 8709 89.51 22562 19652 87.10
Mean 85.67 87.38
%CV 2.79 2.11
HQC
25317 21356 84.35 43397 39985 92.13
26823 21709 80.93 44153 39129 88.62
26573 21428 80.63 44259 39098 88.33
26981 20784 77.03 44829 39235 87.52
26859 21959 81.75 44185 39392 89.15
26197 20921 79.86 44927 39214 87.28
Mean 80.75 88.83
%CV 2.96 1.97
Mean 83.23 87.79
Table 11: Recovery of Internal Standard (Phenformin) IS (Phenformin)
Sample ID
Peak Area Extracted
Peak Area Unextracted
Recovery (%)
1 30998 30129 97.19
2 31489 30236 96.02
3 31998 29761 93.00
4 31211 25026 80.18
5 31771 28991 91.24
6 31039 29328 94.48
7 32356 29764 91.98
8 31817 29808 93.68
9 31402 29031 92.44
10 31596 29924 94.70
11 31719 29197 92.04
12 31985 29768 93.06
13 31492 28489 90.46
14 31190 28761 92.21
15 31411 28398 90.40
16 31175 28259 90.64
17 31271 28565 91.34
18 31306 28481 90.97
Mean Recovery
92.00
%CV 3.82
Table 12: Stock solution stability
Drug Mean fresh Mean old stock Mean % stability
Stock area Area
Short term stock solution stability (after 6 h) (n=3)
Linagliptin 1043600 1011064 96.88
Metformin 1976500 1918606 97.07
IS 55714 54537 97.88
Long term stock solution stability (after 20 days) (n=3)
Linagliptin 1016278 931739 91.68
Metformin 1752129 1579421 90.14
Table 13: Stability data of Linagliptin in plasma
QC Samples Linagliptin Mean observed at 0 hr Mean observed at Last Mean% Stability Bench top Stability, (after 6 hr) (n=6)
HQC (20ng/ml) 15451 14791 95.72
LQC (3ng/ml) 2775 2668 96.14
Auto Sampler Stability 12 hr, (25°C) (n=6)
HQC (20ng/ml) 15398 14492 94.11
LQC (3ng/ml) 2691 2475 91.97
Freeze-thaw Cycle (3 Cycles) (n=6)
HQC (20ng/ml) 15521 14208 91.54
LQC (3ng/ml) 2290 2107 92.00
Long term Stability (after 20 days) (n=6)
HQC (20ng/ml) 15927 14197 89.13
LQC (3ng/ml) 2835 2609 92.02
Table 14: Stability data of Metformin in plasma
QC Samples Metformin Mean observed at 0 hr Mean observed at Last Mean% Stability Bench top Stability, (after 6 hr) (n=6)
HQC (20ng/ml) 37215 36358 97.69
LQC (3ng/ml) 5410 5309 98.13
Auto Sampler Stability 12 hr, (25°C) (n=6)
HQC (20ng/ml) 37519 36913 98.38
LQC (3ng/ml) 5257 5134 97.66
Freeze-thaw Cycle (3 Cycles) (n=6)
HQC (20ng/ml) 37113 35969 96.91
LQC (3ng/ml) 5721 5661 98.95
Long term Stability (after 20 days) (n=6)
HQC (20ng/ml) 36492 36298 99.46
LQC (3ng/ml) 5574 5413 97.11
Table 15: Dilution integrity data
Specified conc. (ng/ml) 2 Times
Calculated
conc.(ng/ml) % Nominal Linagliptin
481.63 96.33
510.75 105.15
517.38 107.48
487.50 97.50
467.30 93.46
532.67 106.53
%CV 4.94
Metformin
500 ng/ml
469.37 93.87
497.03 99.40
469.61 93.92
468.43 93.68
550.14 110.02
507.25 101.45
Avg. conc. 493.63
%CV 6.57
REFERENCE
1. (2010), “Indian Pharmacopoeia”, Govt. of India Ministry of Health & Family Welfare, The Controller of Publication, Vol. 2, 340, 1657-1660.
2. Goodman & Gilman “The Pharmacological Basis of Therapeutics”, 10th Ed., Mc Grow Hill Publication, 1686, 1687, 1700.
3. Rang, HP; Dale, MM; Ritter, JM and Moore,
PK (2007), “Pharmacology”, 7th Ed., Elsevier Publication, 372.
4. Lakshmi, B and Reddy, TV (2012), “A Noval
RP-HPLC Method for the Quantification of Linagliptin in Formulations”, International Journal of Atoms and Molecules, 2 (2), 155-164.
5. Badugu, LR (2012), “A Validated RP-HPLC Method for determination of Linagliptin”,
American Jorunal of Pharmtech Research, 12, 133-137.
6. Sekhar, CK and Sudhakar, P (2013), “A New
UV Method for determination of Linagliptin in Bulk and Pharmaceutical dosage Form”,
International Journal of Universal Pharmacy and Biosciences,2, 54-56.
7. Balasubramanian, J and Azhagesh, RK
(2012), “A Review of chromatographic techniques used in the Analysis of anti diabetic Drugs, Discovery Biotechnology, 1, 05-17.
8. Ramzia, I; Bagary, El and Elkady, EF (2012), “Liquid Chromatographic determination of Linagliptin in Bulk and in Plasma and its Pharmaceutical Preparation”, International
Journal of Biomedical Sciences, 8 (3), 209-214.
9. Khan, G; Sahu, D and Agrawal, YP (2011), “An HPLC method for the determination of Linagliptin in bulk drug and tablets”, Asian Journal of biochemical and Pharmaceutical Research, 1, 352-358.
10.Stefan, B and Schwellinger, E (2010), “The Metabolism and Disposition of the Oral Dipeptidyl Peptidase-4 Inhibitor, Linagliptin,
in Humans”, American Society for
Pharmacology and Experimental Therapeutics, 38, 667-678.
11.Sahoo, PK; Sharma, R and Chaturvedi, SC
(2008), “Simultaneous estimation of
metformin hydrochloride and pioglitazone hydrochloride by RPHPLC method from
combined tablet Dosage form” , Indian
Journal of Pharmaceutical Sciences,70, 383-386.
12.Wanjari, MM and Umathe, SN (2005), “Rapid
and Simple RPHPLC Method for the Estimation of Metformin in Rat Plasma”,
Indian Journal of Pharmaceutical Sciences,
70 (2),198-202.
13.Koseki, N and Kawasita, H (2007),
“Development and validation for high selective quantitative determination of metformin in human plasma by cation exchanging with normal-phase LC/MS/MS”,
14.Xing, J; Chunfeng, X and Hongxiang, L (2007),” Recent Applications of Liquid
Chromatography-Mass Spectrometry in
Natural Products Bio analysis”, Journal of Pharmaceutical and Biomedical Analysis, 44, 368-378.
15.Kataoka, H (2005), Curr. Pharm. Anal, 65-84.
16.Hopfgartner, G and Bourgogne, E (2003), “Quantitative high-throughput analysis of biological matrices by mass spectrometry”,
Journal of Mass Spectrom, 22, 195-214.
17.Snyder, LR and Joseph, JK (2002),
“Practical HPLC Method Development, 2nd
Ed., John Wiley & Sons Publication, 48-69,175-229,234-265,654-660.
18.Niessen, WMA (2006), “Liquid
Chromatography-Mass Spectrometry”, 3rd Ed., Taylor & Francis, New York, 290-306. 19.http://www.fda.gov/downloads/Drugs/Guidan
ceComplianceRegulatoryInformation/Guidanc es/UCM368107.pdf
20.http://www.ema.europa.eu/docs/en_GB/docu ment_library/Scientific_guideline/2011/08/W C500109686.pdf
Correspondence Author:
Rutvik H Pandya
L. J. Institute of Pharmacy, Sarkhej Circle & Katariya Motors, S.G. Road,Ahmedabad, Gujarat-382210, India