Relations of diet and physical
activity to bone mass and
height in black and white
adolescents
Bernard Gutin,1
Inger S. Stallmann-Jorgensen,1 Anh H. Le,2Maribeth H. Johnson,3 Yanbin Dong1
1Georgia Prevention Institute, Georgia Health Sciences University, Augusta, Georgia; 2Department of Biostatistics, University of Alabama at Birmingham, Birmingham, Alabama; 3Department of Biostatistics, Georgia Health Sciences University, Augusta, Georgia, USA
Abstract
Because the development of healthy bodies during the years of growth has life-long health consequences, it is important to understand the early influences of diet and physical activity (PA). One way to generate hypotheses concern-ing such influences is to conduct cross-section-al studies of how diet and PA are related to dif-ferent components of body composition. The subjects were 660 black and white adolescents. Total body bone mineral content (BMC) was measured with dual-energy X-ray absorptiome-try; free-living diet and PA were assessed with 4-7 separate 24-h recalls. The main dietary vari-ables investigated were: total energy intake, macronutrient distribution (%), dairy servings, vitamin D, and calcium. The main PA variables were hours of moderate PA (3-6 METs) and vig-orous PA (>6 METs). BMC was higher in blacks than in whites (P<0.01) and it increased more in boys than in girls (age by sex interaction) as age increased (P<0.01). After adjustment for age, race and sex, higher levels of BMC were associated with higher levels of energy intake, dairy servings, calcium, vitamin D, and vigorous PA (all P 's<0.05). In the multivariable model, significant and independent proportions of the variance in BMC were explained by race, the age by sex interaction, calcium, and vigorous PA (all P 's<0.01). When height was used as the outcome variable, similar diet results were obtained; however, there was a sex by vigorous PA interaction, such that vigorous PA was asso-ciated with height only in the girls. These data are consistent with the hypothesis that the bone mass and height of growing youths are positive-ly influenced by higher dietary intake of energy and dairy foods, along with sufficient amounts of vigorous PA. This hypothesis needs to be test-ed in randomiztest-ed controlltest-ed trials.
Introduction
Body composition develops during the early years of life and tends to track into later years.1 Therefore, understanding the effects of lifestyle factors such as diet and physical activ-ity (PA) can guide the implementation of social policies and interventions that can help youths to develop healthy bodies. One way to gain insight into these influences is to conduct cross-sectional investigations in order to gen-erate hypotheses concerning how diet and PA influence body composition; these hypotheses can then be tested in randomized controlled trials to arrive at causal conclusions.
The current paper is based on data collected in a project conducted at the Georgia Health Sciences University (formerly the Medical College of Georgia) entitled Lifestyle, adiposity and cardiovascular health of youths. Earlier publications from this project found that ado-lescents who engage in more vigorous PA and ingest more dietary energy than their age-mates tend to have relatively low levels of body fatness,2thus putting them at lower risk for cardiometabolic diseases.3In a similar man-ner, prevention of osteoporosis probably begins in childhood. Thus, it is important to determine if the relations of diet and PA to lower adiposity levels are mirrored by their relations to higher bone mass.
The skeletal benefits of physical activity in adolescents are maintained into young adult-hood and youths who develop high levels of bone mass early in life are less likely to decline to osteoporotic levels later in life.4It has been shown retrospectively that women who had the highest levels of bone mass in their post-menopausal years had engaged in the most PA during their teen years.5
There is evidence that blacks and boys have higher levels of bone mass than whites and girls, respectively.6Moreover, there is evidence that higher levels of bone mass are associated with dietary factors such as intake of dairy foods,7 along with weight-bearing PA.5 However, little is known about the interactions of diet and PA with age, race or sex, and it is unclear if bone mass is more closely associat-ed with vigorous PA than with moderate PA. Because bone mineral content (BMC) is the index of bone mass that is most clearly related to bone strength in growing youths,8the pri-mary purpose of this study was to determine the relations and potential interactions of free-living diet and PA to BMC in a relatively large bi-racial sample of 660 boys and girls.
A secondary purpose of this study was to explore the relations of diet and PA to standing height, which is potentially influenced by diet and PA in ways that are similar to how diet and PA influence bone mass. For example, one study found that children who avoided
drink-ing milk had relatively low BMC and were rela-tively short,9 another found that vitamin D insufficiency was associated with decreased height,10and secular changes in growth of chil-dren are often attributed to nutritional fac-tors.11 Randomized controlled trials have shown that vigorous PA has a positive influ-ence on bone mass.12However, little is known about whether normal variations in diet and PA within one country have a measurable influence on linear growth, or whether diet and PA interact with each other, or with race and sex, in their relations to bone mass and growth.
A lifestyle that includes large amounts of PA can allow youths to ingest relatively large amounts of dietary energy without accumulat-ing excessive amounts of fat mass.2Moreover, a diet high in energy may allow youths to ingest sufficient amounts of bone- and growth-enhancing nutrients. Therefore, we hypothesized that higher levels of BMC and height would be related to daily hours of mod-erate and vigorous PA, daily dairy servings, and dietary intake of energy, vitamin D and calcium.
Correspondence: Bernard Gutin, 10161 Mizner Lane, Raleigh, NC 27617, USA.
Tel. 919.425.1300 – Fax. 706.721.7150. E-mail: [email protected]
Key words: bone mass, youths, diet, physical activity.
Acknowledgment: this study was supported by the National Institutes of Health (HL64157).
Contributions: BG primary funding acquisition, study design and manuscript writing; IS data col-lection and manuscript writing; AL, MJ, data analysis and tables and figures preparation; YD, funding acquisition assistance and manuscript preparation supervision.
Conflict of interest: the authors report no con-flicts of interest.
This research was carried out at the Georgia Prevention Institute, Department of Pediatrics, Georgia Health Sciences University (formerly Medical College of Georgia).
Received for publication: 18 January 2011. Accepted for publication: 24 March 2011.
This work is licensed under a Creative Commons Attribution 3.0 License (by-nc 3.0).
©Copyright B. Gutin et al., 2011 Licensee PAGEPress, Italy Pediatric Reports 2011; 3:e10 doi:10.4081/pr.2011.e10
Non-commercial
Materials and Methods
Subjects
Youths aged 14-18 were recruited from high schools in the Augusta, Georgia area. Schools that enrolled both black and white students were selected. Because there were very few Asians or Hispanics in Augusta, they were not recruited for this study. With approval from superintendents and school principals, flyers were distributed to all stu-dents in the schools. Interested stustu-dents who responded to the flyers and called the insti-tute to participate were screened over the telephone to determine preliminary eligibili-ty. Criteria included: being 14-18 years of age; being of the black or white race by self-designation; being enrolled in school; having a body weight ≤300 lbs (weight limit for the dual-energy x-ray absorptiometer-DXA); being of good health and females being non-pregnant; using no medications that could influence study results including those for birth control, attention-deficit-disorders, and asthma; and not having contraindications to completing any of the testing procedures. Youths who passed the telephone screening were invited to the Georgia Prevention Institute accompanied by their parents if they were minors, to learn about the study. All subjects and the parents of subjects who were minors provided written informed assent and consent in accordance with requirements of our Human Assurance Committee (the internal review board at the Georgia Health Sciences University) prior to study participation; this committee also approved all study procedures.
Anthropometrics and body
com-position
Weight (kg) was measured twice to the nearest 0.1 kg using a leveled platform scale, calibrated monthly, with the subject not wearing shoes and in light clothing (T-shirt and shorts).
Height (m) was measured twice to the nearest 0.1 cm using a wall-mounted sta-diometer with subject not wearing shoes, standing straight against the wall with head, buttocks, and heels touching the wall, arms hanging freely at the sides and chin parallel to the floor, and after inhaling and exhaling a deep breath of air. Means of the weight and height measurements were used to derive body mass index (BMI [weight·height –2]). DXA (Hologic QDR-4500W, software version 6.0, Waltham, MA, USA) was used to derive a 3-compartment model of body composition: fat mass, fat-free soft tissue and BMC. The intraclass correlation coefficient for repeat-ed measurements of BMC was >0.99.12
Diet and physical activity assessment
Diet and PA were measured with non-con-secutive, 24-h recalls covering the period from midnight to midnight for the previous day. The first two recall interviews were conducted in person at our institute, with the rest conduct-ed by phone weekly and completconduct-ed within 12 weeks. Subjects were blinded to the telephone recall schedule to minimize the potential for under-eating during the time frame for the 24-h recall and calls were made on all days of t24-he week to obtain diet data representing both weekdays and weekend days. The diet recall data was captured using the Nutrition Data System for Research (NDS-R)14which utilizes a multiple pass, computer-assisted interview approach. To minimize subject fatigue with the recall process, which might reduce relia-bility, interviewers were trained to conduct the recalls in 30 min or less. Subjects were not interviewed about days when they had been ill, or days that fell on a major holiday. Youths who provided at least four recalls were includ-ed in the analyses. Fifty-two percent of the youths had recalls for all 7 days. The dietary and PA recalls were conducted concurrently by a trained dietitian or dietetic intern.
The NDS-R Food and Nutrient Database groups food into nine major food categories: fruits, vegetables, grains, sweets, miscella-neous, fats, beverages, meats, and dairy/ nondairy alternatives. Serving sizes were based on the Dietary Guidelines for Americans 2005,15 or on Food and Drug Administration label serving sizes. We exam-ined total energy intake and percentage of energy from carbohydrates (%CHO), protein (%PRO), and fat (%FAT), as well as dietary vitamin D (µg) and calcium (mg).
For the PA assessment, we compiled a list of activities typical for adolescents, and assigned metabolic equivalent values (METs) to the activities based on the compendium of physi-cal activities.16 Self-reported PA was quanti-fied using our version of a validated previous day PA recall (PAR) instrument, recording activities in 48, 30-min time blocks, by extend-ing the time frame from coverextend-ing only the after school hours of 3:00 p.m. to 11:30 p.m. to covering the full 24-h day.17 Subjects were asked to state their level of effort (light, mod-erate, or vigorous) for each activity. Activities were re-categorized based on a combination of the activity and the level of effort; e.g. light running was assigned a higher metabolic equivalent (MET) level than light walking. In the final categorization, light PA was <3 METs, moderate PA was 3-6 METs and vigor-ous PA was >6 METs. In general, moderate PA involves activities such as brisk walking while vigorous PA involves activities that involve running. These cutpoints are somewhat arbi-trary; if the overall project focused only on bone, brisk walking might be characterized as
a light activity rather than a moderate activity, running might be a moderate activity and activities such as jumping might be classified as vigorous. However, the parent project focused on visceral and general adiposity as well as bone. Therefore, we used terminology and metabolic breakpoints that had been pre-viously used with this PA measurement instrument.
Statistical analyses
The SAS program version 9.1.3 (SAS Institute, Inc, Cary, NC, USA) was used for sta-tistical analyses with the level of significance set at 0.05. Variables were checked for normal-ity and appropriate transformations were applied if necessary. Descriptive race and sex comparisons were made using analysis of covariance, adjusting for age. However, detailed consideration of the demographic dif-ferences in diet and PA is beyond the scope of this paper; our focus was on whether the asso-ciations of diet and PA with BMC could be gen-eralized across race and sex.
Pearson correlations were used to identify associations among variables and to identify possible multicollinearity issues that could arise in model building. A base model contain-ing the demographic variables of age, sex, and race was first established to describe the effects of these demographic variables on the outcome variables of BMC and height. We con-sidered using height as part of the base model to control for size, but it seemed possible that the diet and PA variables might be associated with height in the same way that they were associated with BMC, in which case inclusion of height in the base model would obscure the relations of diet and PA to BMC. Adjusting for height would also be more important if the project were focused on sex differences in BMC. However, this paper does not focus on sex differences but rather controls for sex to see if the relations of diet and PA to BMC and height can be generalized to both sexes. Then we added each diet and PA predictor variable to the base model, one at a time, in order to determine whether each one explained a significant additional proportion of the variance in the outcome. In these analy-ses, we also examined possible interactions between the demographic and predictor vari-ables. Then a full multivariate model was obtained by combining diet and PA variables that had explained significant proportions of the BMC variance. We also examined possible interactions between predictor variables for the full model. Similar statistical techniques were applied to the analyses that used height as the outcome variable.
Non-commercial
Results
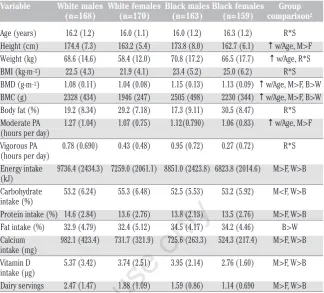
Descriptive data and the influences of age, race, and sex are shown in Table 1. Weight, height, BMC, and moderate PA increased with age. Boys had higher BMC than girls and blacks had higher BMC than whites. For mod-erate PA, males had higher levels than females. For vigorous PA, there was a race by sex interaction, such that black males had the highest levels while black females had the lowest levels. With respect to diet variables, whites had higher intake of energy, %CHO, %PRO, calcium, vitamin D and dairy servings than blacks. Males also had higher intake of all these dietary factors, except for %CHO, than females. Blacks had higher intake of %FAT than whites.
Table 2 shows the results for the base model of age, race and sex. As age increased, boys increased more than girls in BMC. There was no significant race by sex interaction. Table 2 also shows the regression results in which each diet and PA variable was added to the base model, one at a time. With respect to diet, significant additional proportions of the vari-ance in BMC were explained by intake of ener-gy, calcium, vitamin D, and dairy servings. With respect to PA, a significant proportion of the BMC variance was explained by vigorous PA, but not moderate PA.
When height was used as the outcome measurement, all the same dietary variables were related to height (all P's <0.05, data not shown). For PA, there was a significant inter-action between sex and vigorous PA (P=0.014), such that vigorous PA was posi-tively associated with height in girls, but not in boys.
In building a multivariate model of diet and PA, we considered the interrelationships among variables to avoid multicollinearity. The four significant diet variables were inter-correlated (r=0.50 to 0.91), and the relation-ships with BMC and height were similar. In the interests of parsimony, we selected one main dietary variable to use in the multivari-able model. Tmultivari-able 3 shows the full model results for BMC. Both calcium intake and vig-orous PA explained independent proportions of the variance in BMC, and neither interact-ed with age, race, sex or each other. This indi-cates that the influence of diet and PA could be generalized across the demographic groups.
When height was used as the outcome vari-able, the multivariate model showed that cal-cium and the interaction between sex and vig-orous PA were significant (P's<0.05); vigor-ous PA explained a significant proportion of the variance in the girls, but not in the boys and the proportion of the variance explained was 0.02.
Table 1. Descriptive characteristics for subjects in the study.1
Variable White males White females Black males Black females Group
(n=168) (n=170) (n=163) (n=159) comparison2
Age (years) 16.2 (1.2) 16.0 (1.1) 16.0 (1.2) 16.3 (1.2) R*S Height (cm) 174.4 (7.3) 163.2 (5.4) 173.8 (8.0) 162.7 (6.1) ↑w/Age, M>F Weight (kg) 68.6 (14.6) 58.4 (12.0) 70.8 (17.2) 66.5 (17.7) ↑w/Age, R*S BMI (kg·m–2) 22.5 (4.3) 21.9 (4.1) 23.4 (5.2) 25.0 (6.2) R*S
BMD (g·m–2) 1.08 (0.11) 1.04 (0.08) 1.15 (0.13) 1.13 (0.09) ↑w/Age, M>F, B>W
BMC (g) 2328 (434) 1946 (247) 2505 (498) 2230 (344) ↑w/Age, M>F, B>W Body fat (%) 19.2 (8.34) 29.2 (7.18) 17.3 (9.11) 30.5 (8.47) R*S Moderate PA 1.27 (1.04) 1.07 (0.75) 1.12(0.790) 1.06 (0.83) ↑w/Age, M>F (hours per day)
Vigorous PA 0.78 (0.690) 0.43 (0.48) 0.95 (0.72) 0.27 (0.72) R*S (hours per day)
Energy intake 9736.4 (2434.3) 7259.0 (2061.1) 8851.0 (2423.8) 6823.8 (2014.6) M>F, W>B (kJ)
Carbohydrate 53.2 (6.24) 55.3 (6.48) 52.5 (5.53) 53.2 (5.92) M<F, W>B intake (%)
Protein intake (%) 14.6 (2.84) 13.6 (2.76) 13.8 (2.13) 13.5 (2.76) M>F, W>B Fat intake (%) 32.9 (4.79) 32.4 (5.12) 34.5 (4.17) 34.2 (4.46) B>W Calcium 982.1 (423.4) 731.7 (321.9) 725.6 (263.3) 524.3 (217.4) M>F, W>B intake (mg)
Vitamin D 5.37 (3.42) 3.74 (2.51) 3.95 (2.14) 2.76 (1.60) M>F, W>B intake (µg)
Dairy servings 2.47 (1.47) 1.88 (1.09) 1.59 (0.86) 1.14 (0.690 M>F, W>B
1All values are means (SD). 2Group comparisons were conducted by analyses of covariance (sex by race) after adjustment for age (P<0.05).
R*S, race by sex interaction; ↑w/Age, the variable increases as age increases; M, males; F, females; BMD, bone mineral density; W, whites; B,
blacks; BMC, bone mineral content; PA, physical activity; kJ, kilojoules
Table 2. Unstandardized regression coefficients (β), SEs, and model R2examining the
association of physical activity and dietary factors with bone mineral content after adjustment for base model factors from multiple regression.
Model1 Predictor variable β SE P R2
1 Base model - - - 0.343
2 Moderate PA 8.4 16 0.61 0.344
3 Vigorous PA 66 23 0.004 0.352
4 Calcium 0.16 0.04 0.0002 0.357
5 Vitamin D 13 5.5 0.020 0.349
6 Dairy servings 41 13 0.002 0.353
7 Energy intake 0.06 0.03 0.024 0.348
8 Protein intake (%) 9.7 5.3 0.14 0.345
9 Carbohydrate intake (%) -2.7 2.3 0.24 0.345
10 Fat intake (%) 1.5 3.0 0.60 0.344
1The base model contains age, race, sex, and the age by sex interaction. Models 2-10 represent the addition of the predictor variable to the
base model. In all models there was a significant race effect (W<B) and age by sex interaction (M increase more than F across age) (P< 0.05). BMC, bone mineral content; PA, physical activity.
Table 3. Unstandardized regression coefficients (β), SEs, and model R2examining the
simultaneous association of vigorous physical activity and calcium intake with bone min-eral contentfrom multiple regression.
β(SE) P
Intercept 1448 (274)
-Race1 -279 (29) <0.0001
Sex2 -2061 (378) <0.0001
Age 41 (17) <0.0001
Age*Sex2 145 (23) <0.0001
Calcium intake 0.15 (0.04) 0.0004
Vigorous PA 58 (23) 0.0097
Model R2 0.364
-1White race is reference group; 2male sex is reference group; PA, physical activity.
Non-commercial
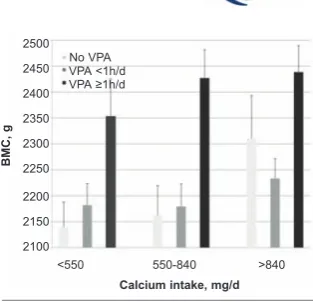
The joint effects of calcium and vigorous PA on BMC are illustrated in Figure 1. Although the statistical analyses were done on continu-ous variables, for purposes of illustration in the figure, the sample was broken down into groups. For vigorous PA, the total sample was broken down into three groups: i) those who reported no vigorous PA at all; ii) those who reported some, but <1 hour/day; and iii) those who reported 1 hour or more per day. For calci-um intake, the total sample was divided into thirds. It is clear that the highest BMC was found in those youths who ingested the most calcium and did the most vigorous PA.
Discussion
This study found that the bone mass and height of adolescents were associated with diet and PA. The main dietary factors were energy intake and those embodied in dairy products (i.e., calcium and vitamin D). With respect to PA, vigorous PA rather than moder-ate PA was associmoder-ated with BMC. Vigorous PA includes activities that place mechanical strain on the musculo-skeletal system, such as running, basketball, soccer and dance. These results are consistent with the hypothesis that the ingestion of dairy products and associated nutrients provide the substrate for bone accre-tion while vigorous PA provides the mechani-cal stimulation needed to promote bone forma-tion. The dairy result is consistent with those of other investigators.7,18It is noteworthy that the diet and PA factors explained independent proportions of the variance in BMC, whereas Rowlands et al.,19found a positive interaction between calcium intake and PA in 8-11 year old children. Perhaps such an interaction is more likely to occur in younger children because their levels of moderate-vigorous PA are so much higher than those of teenagers.20,21
The importance of vigorous PA to optimal development of bone and fat-free mass is con-sistent with the results of projects that have investigated the relationship of physical fit-ness to BMC22as well as intervention projects that have employed high-intensity exercise.13 Animal studies have also emphasized the importance of relatively high-intensity, weight-bearing exercise to provide optimal mechani-cal load to the skeleton.23 Furthermore, increased lean mass is associated with even greater gains in bone density and bone strength when occurring in conjunction with high intensity PA.24
It is noteworthy that vigorous PA, rather than moderate PA, is also associated with lower fatness levels in youths.25Again, these findings are consistent with results from ani-mal studies in which increased muscle mass and PA are associated with decreased body fat
and resistance to body fat gain.26This study complements another study of this adolescent cohort2by showing that energy intake and vig-orous PA were related not only to higher BMC, but also to low levels of percent body fat. Thus, the development of desirable body composition seems to depend on high levels of energy intake and associated nutrients, in combina-tion with adequate amounts of vigorous PA.27 The energy and nutrients provide the substrate for optimal body composition development while the vigorous PA encourages partition of the ingested nutrients into bone and muscle rather than fat. This is consistent with recent findings that mechanical stimulation alters stem cell proliferation and differentiation in the direction of greater osteogenesis and less-er adipogenesis.28It appears that only vigorous PA provides sufficient mechanical stimulation to the tissues to influence stem cells to differ-entiate into lean tissue (bone and muscle) rather than fat.
We found that the dietary factors associated with BMC were similar to those associated with height, which is consistent with the idea that improved nutrition, including dairy prod-ucts, can have a favorable influence on growth.29However, we found that the models for BMC and height were somewhat different, in that vigorous PA was associated with height only in the girls. Perhaps the relatively low average levels of vigorous PA in the girls led the impact of the higher levels in some girls to have a greater influence on growth. However, it has also been suggested that weight-bearing bones are more sensitive to physical exercise in boys than in girls during pre-and early puberty.30
For BMC, we found an interaction between age and sex, such that BMC increased more during the adolescent years in the boys than in the girls; this is consistent with the male-female divergence in fat-free mass during puberty, which may be subserved by differ-ences in sex hormones.31
It is noteworthy that the effects of diet and vigorous PA did not interact with race and sex. Thus, lifestyle recommendations can be simi-lar for black and white youths of both sexes.
In light of the roles that vigorous PA and dairy intake play in helping youths to develop healthy bodies, it is worrisome that in the USA moderate-vigorous PA declines markedly dur-ing the adolescent years,20,21 and that only ~15% of the youths in our sample met the rec-ommended level of three dairy servings per day suggested by the 2005 Dietary Guidelines for Americans.15 Our results are consistent with data from the 1999-2004 NHANES which showed that American adolescents tend to be deficient in dairy intake.32
This study had some limitations. One con-cerns the fact that the key outcome variable was BMC, which is only an index of bone mass
and does not provide information about bone architecture, which also contributes to bone strength.33Another limitation was our reliance on recall of diet and PA rather than more objec-tive measurements. Nonetheless, the recall procedures we used to measure free-living diet and PA were more extensive than have been commonly used in large-scale epidemiologic studies, in that we conducted seven independ-ent 24-hr recalls; this provided information about all days of the week and did not require that the youths remember more than one day of diet and PA each time. Our use of a PA assessment that was based on metabolic equivalents rather than bone-specific variables is an important limitation. This reflected the fact that the data for this paper were collected as part of a larger project that was designed to see how diet and PA are related to visceral and general adiposity,2and how adiposity is related to cardiometabolic biomarkers.3Our findings that vigorous PA, but not moderate PA, is relat-ed to higher bone mass is complementary to those findings.
Another limitation involves our use of only dietary vitamin D rather than plasma levels of vitamin D, which is influenced by exposure to sunlight as well as diet.34
The most important limitation is the cross-sectional nature of the investigation, which makes it necessary to be tentative in drawing causal conclusions. For example, a hereditary predisposition to be tall and have greater bone
Figure 1. Illustration of the joint relations of vigorous PA and calcium intake to bone mineral content. BMC (SE), adjusted for age, race and sex, in relation to categories of calcium intake and vigorous PA. Although the statistical analyses were done on continuous variables, the figure breaks the calcium and vigorous PA variables into groups for purposes of illustration. For cal-cium intake, the youths were broken down into thirds; thus, there were 220 in each category. The number of youths in each of the vigorous PA categories is given in the legend. Both calcium intake and vigorous PA explained significant independent pro-portions of the variance in BMC (P<0.01) beyond the variance explained by age, race and sex (see Table 3). BMC, bone mineral content; PA, physical activity.
2500
2450
2400
2350
2300
2250
2200
2150
2100
<550 550-840 >840 No VPA
VPA <1h/d VPA ≥1h/d
BMC,
g
Calcium intake, mg/d
Non-commercial
mass may have led some youths, especially the girls, to engage in vigorous sports such as bas-ketball. The greater metabolic rate of the taller youths might then stimulate them to eat more, including more dairy products. Of course, it is then possible that the greater amount of vigor-ous PA and energy/nutrient intake might con-tribute to further accretion of bone mass. Indeed, such a circular pattern is quite likely. Prospective cohort designs allow observation of the relations over time. In this regard, our results are consistent with two recent reports. In a 7-year follow-up study in girls, bone mass accrual was associated with a combined diet index that included several of the variables we found to be significantly related to BMC; how-ever, these investigators did not find bone mass to be associated with a general index of leisure-time PA.1Another study35 found that walking or cycling to school (ie, moderate PA) was not associated with greater accrual of bone mass over a 2-year period. These results show the importance of distinguishing between different intensities of PA, which allowed us to show that vigorous PA, but not moderate PA, was associated with BMC. The long-term implications of enhanced bone mass in adolescence is illustrated by a prospective cohort study that followed the subjects into young adulthood and showed that the skeletal benefits of physical activity in adolescents were maintained.4From a public health per-spective, we need to carry these findings for-ward by seeing what happens when diet and PA are controlled in a prospective manner, using experimental designs.
In conclusion, in black and white adoles-cents the main dietary variables related to bone mass and height were energy intake, cal-cium, vitamin D and servings of dairy prod-ucts. Because these variables were interrelat-ed, it was not possible to determine which one or combination of these was actually responsi-ble for the relation to BMC. With respect to PA, BMC was related to vigorous PA, rather than to moderate PA. Taken together with recent evi-dence showing that lower levels of body fatness are also associated with higher levels of ener-gy intake and vigorous PA, these results sug-gest that interventions designed to help youths develop healthy bodies should emphasize the positive message of engagement in vigorous PA and ingestion of sufficient energy and nutrients, rather than the negative message of energy intake restriction which might be con-trary to the biologic needs of healthy growth.36
References
1. Cheng S, Völgyi E, Tylavsky F et al. Trait-specific tracking and determinants of body composition: a 7-year follow-up study of
pubertal growth in girls. BMC Med 2009;7:5.
2. Stallmann-Jorgensen I, Gutin B, Hatfield-Laube J et al. General and visceral adipos-ity in black and white adolescents and their relation with reported physical activ-ity and diet. Int J Obes 2007;31:622-9. 3. Gutin B, Johnson M, Humphries M et al.
Relationship of visceral adiposity to car-diovascular disease risk factors in black and white teens. Obesity 2007;15:1029-35. 4. Baxter-Jones A, Kontulainen S, Faulkner R et al. A longitudinal study of the relation-ship of physical activity to bone mineral accrual from adolescence to young adult-hood. Bone 2008;43:1101-7.
5. Rideout C, McKay H, Barr S. Self-reported lifetime physical activity and areal bone mineral density in healthy post-menopausal women: the importance of teenage activity. Calcif Tissue Int 2006; 79:214-22.
6. Walker M, Novotny R, Bilezikian J et al. Race and diet interactions in the acquisi-tion, maintenance, and loss of bone. J Nutr 2008;138:1256S-60S.
7. Moore L, Bradlee M, Gao D et al. Effects of average childhood dairy intake on adoles-cent bone health. J Pediatr 2008;153:667-73.
8. Heaney R. BMD: the problem. Osteoporos Int 2005;16:1013-15.
9. Black R, Williams S, Jones I et al. Children who avoid drinking cow milk have low dietary calcium intakes and poor bone health. Am J Clin Nutr 2002;76:675-80. 10. Kremer R, Campbell P, Reinhardt T et al.
Vitamin D status and its relationship to body fat, final height, and peak bone mass in young women. J Clin Endocrinol Metab 2009;94:67-73.
11. Hoppa R, Garlie T. Secular changes in the growth of Toronto children during the last century. Ann Human Biol 1998;25:553-61. 12. Barbeau P, Johnson M, Howe C et al. Ten months of exercise improves general and visceral adiposity, bone, and fitness in black girls. Obesity 2007;15:2077-85. 13. Litaker M, Barbeau P, Humphries M et al.
Comparison of Hologic QDR-1000/W and 4500W DXA scanners in 13- to 18-year olds. Obes Res 2003;11:1545-52.
14. Schakel S, Sievert Y, Buzzard I. Sources of data for developing and maintaining a nutrient database. J Am Diet Assoc 1988;88:1268-71.
15. Department of Health and Human Services Web site. Washington (DC): Dietary Guidelines for Americans, 2005. Available from: http://www.health.gov/ DietaryGuidelines/.
16. Ainsworth B, Haskell W, Leon A et al. Compendium of physical activities: classi-fication of energy costs of human physical
activities. Med Sci Sports Exerc 1993;25:71-80.
17. Weston A, Petosa R, Pate R. Validation of an instrument for measurement of physi-cal activity in youth. Med Sci Sports Exerc 1997;29:138-43.
18. Huncharek M, Muscat J, Kupelnick B. Impact of dairy products and dietary calci-um on bone-mineral content in children: results of a meta-analysis. Bone 2008; 43:312-21.
19. Rowlands A, Ingledew D, Powell S et al. Interactive effects of habitual physical activity and calcium intake on bone densi-ty in boys and girls. J Appl Physiol 2004; 97:1203-8.
20. Nader P, Bradley R, Houts R et al. Moderate-to-vigorous physical activity from ages 9 to 15 years. JAMA 2008;300:295-305.
21. Troiano R, Berrigan D, Dodd K et al. Physical activity in the United States measured by accelerometer. Med Sci Sports Exerc 2008;40:181-8.
22. Vicente-Rodriguez G, Urzanqui A, Mesana MI et al. Physical fitness effect on bone mass is mediated by the independent asso-ciation between lean mass and bone mass through adolescence: a cross-sectional study. J Bone Miner Metab 2008;26:288-94. 23. Burr D, Robling A, Turner C. Effects of bio-mechanical stress on bones in animals. Bone 2002;30:781-6.
24. Hamrick M, Samaddar T, Pennington C et al. Increased muscle mass with myostatin deficiency improves gains in bone strength with exercise. J Bone Miner Res 2006;21:477-83.
25. Gutin B, Yin Z, Humphries M et al. Relations of moderate and vigorous physi-cal activity to fitness and fatness in adoles-cents. Am J Clin Nutr 2005;81:746-50. 26. Hamrick M, Pennington C, Webb C et al.
Resistance to body fat gain in 'double-muscled' mice fed a high-fat diet. Int J Obes 2006;30:868-70.
27. Gutin B. Child obesity can be reduced with vigorous activity rather than restriction of energy intake. Obesity 2008;16:2193-6. 28. Luu Y, Capilla E, Rosen C et al. Mechanical
stimulation of mesenchymal stem cell pro-liferation and differentiation promotes osteogenesis while preventing dietary induced obesity. J Bone Miner Res 2009; 24:50-61.
29. Seubsman S, Sleigh A. Change in mean height of Thai military recruits from 1972 through 2006. J Epidemiol 2009;19:196-201.
30. Kriemler S, Zahner L, Puder J et al. Weight-bearing bones are more sensitive to physical exercise in boys than in girls during pre- and early puberty: a cross-sec-tional study. Osteoporos Int
2008;19:1749-Non-commercial
58.
31. Veldhuis J, Roemmich J, Richmond E et al. Endocrine control of body composition in infancy, childhood, and puberty. Endocr Rev 2005;26:114-46.
32. Nicklas T, O’Neil C, Fulgoni V. The role of dairy in meeting the recommendations for shortfall nutrients in the American diet. J Am Coll Nutr 2009;28:73-81S.
33. Seeman E, Delmas P. Bone quality--the material and structural basis of bone strength and fragility. N Engl J Med 2006; 354:2250-61.
34. Holick M, Chen T. Vitamin D deficiency: a worldwide problem with health conse-quences. Am J Clin Nutr 2008;87:1080-6S. 35. Lofgren B, Stenevi-Lundgren S, Dencker M et al. The mode of school transportation in
pre-pubertal children does not influence the accrual of bone mineral or the gain in bone size - two year prospective data from the paediatric osteoporosis preventive (POP) study. BMC Musculoskel Dis 2010;11:2.
36. Gutin B. Diet vs exercise for the preven-tion of pediatric obesity: the role of exer-cise. Int J Obes, 2011;35:29-32.