INCREMENT CORES OF THE NATIONAL FOREST INVENTORY
FROM ROMANIA
G. Marin
1,2, I.V. Abrudan
2, B. Strimbu
3,∗1
Faculty of Silviculture and Forest Engineering, Transilvania University, Brasov, Romania.
2
National Institute for Research and Development in Forestry “Marin Dr˘acea”, Romania.
3
For. Eng., Res. & Manage. Department, College of Forestry, Oregon State University, Corvallis, OR, USA. ∗
Corresponding author.
Abstract. Dendrochronological data provides insight in the tree development, and used in conjunction with forest inventory, can supply inputs for growth and yield modeling. However, accurate and precise measurements of a large number of incremental cores require significant resources. One possible source of valuable tree ring data are national forest inventories (NFI), which process a large amount of data annually. A NFI that places a significant effort on dendrochronological data is the Romanian NFI, which, to date, collected, measured, and cross-dated more than 50,000 incremental cores. This amount of incremental cores makes Romania the holder of the largest dendrochronological NFI library. The present article presents the method of processing the incremental cores and makes available to the interested entities the tree ring data for the three main species from Romania, namely Norway spruce, European beech, and Sessile oak. To ensure utility, the dataset is limited to pure (i.e., one species) strict even-aged stands (i.e., age difference≤
5 years), that were un-thinned (i.e., no active forest management). The data is stored as an ASCII file, and contains six fields: ecoregion, species, year, age, average ring width, and variance. To ensure privacy of infor-mation, the average ring width was estimated over a 5 years interval, for which the variance is also computed.
Keywords: crossdating, micrometer precision,Picea abies, Fagus sylvatica, Quercus petraea.
1
Introduction
Tree rings have been used for forest modeling for more than a century, but significant advancements in computer science and sensors placed dendrochronol-ogy at the center of the current numerical analysis in forestry. The information used in dendrochronology usu-ally comes from two sources, cross sectional disks, also known as “cookies”, and incremental cores, or simply cores. The vast majority of data is acquired through cores, as they are simple to extract, and most impor-tantly, no dedicated approvals are needed (i.e., to extract cookies, permits for falling trees are usually required). However, incremental cores can pose two disadvantages in respect with cookies, both rooted in the absence of an inside view of the tree. First issue with cores acquisition consists in misaligning the bore with the pith of the tree because of the eccentricity of the stem. Absence of the pith on the core lead to the usage of assumptions, which diminishes the value of the core. Secondly, is the local aspect, as a core supplies only a minute perspective of the cross-section of the tree. The punctual [i.e., confined
to a narrow part of the stem cross-section (the diame-ter of the increment borer)] collection of information is partially alleviated through cross dating, but again, as-sumptions are used in interpretation and analysis (Dou-glass, 1941; Schweingruber et al., 1990; Wigley et al., 1987). The main assumption driving the usage of incre-mental cores in size estimation is that the stem of the tree has a circular cross section. This circularity assump-tion is not confined to dendrochronology, taper modeling is another research area that considers the stem being a solid of revolution (Brooks et al., 2007; Cushman et al., 2014; Garber and Maguire, 2003; Kozak, 2004; Lenhart et al., 1987).
Usually, incremental cores are obtained through dedi-cated studies, but national forest inventories (NFIs) can supply also a significant amount of cores. The cores acquired during the national forest inventory process are opportunistic, as it does not target a specific re-search question, but their value rests in the consistent procurement across large tracts of land. Most of the NFIs had the theoretical framework updated in the last
Marin et al. (2019)/Math. Comput. For. Nat.-Res. Sci. Vol. 11, Issue 2, pp. 294–302/http://mcfns.com 295
Figure 1: The PSC of the Romanian NFI overlaid on the Romanian geomorphology (i.e., plain, hill, mountain) and topography. The color of the PSC reflects the geomorphology: red for plains, blue for hills, and black for mountains. The spatial distribution of the PSCs does not reflect the actual density.
30 years (Bechtold and Patterson, 2005; Tomppo et al., 2010). The updates where focused either in changing the method of acquiring the data, such as the USA and France, or in establishing a new system, the case of eastern European countries. Regardless the age of NFI, only a few are continuously collecting incremental cores, one of them being the Romanian NFI. In the last decade, the Romanian NFI acquired more than 50,000 cores. The great amount of cores make Romania the holder of the largest incremental cores among all Euro-pean NFIs (Schadauer, 2019). Therefore, the objective of the present data-in-brief paper is to present the den-drochronological efforts of the Romanian NFI, and to offer access to one of the European dendrochronological datasets.
2
Methods
2.1 Romanian NFI
The Romanian NFI is a continuous forest inventory based on a systematic sampling design (Tomppo et al., 2010). The NFI measures permanent sample clusters (PSC) of four sample plots (SP). The inventory cov-ers the entire country during a 5-year cycle. The PSC
were positioned in a quadratic scheme, according to the general landscape classification of mountains, hills, and plains. In the mountains and hills regions, the NFI grid has cells of 4 km x 4 km, whereas in the plains region the cells are 2 km x 2 km (Fig. 1).
The differential design of Romanian NFI captures the relevant information while considering the density of the forest within the general landscape (Fig. 2). In total, the Romanian NFI has 31,201 PSC and 124,804 SP.
2.2 Extraction of the incremental cores
Figure 2: The PSC of the Romanian NFI overlaid on the general location of the forest, in green, and topography. The color of the PSC reflects the geomorphology: red for plains, blue for hills, and black for mountains. The spatial distribution of the PSCs does not reflect the actual density.
which cores were extracted were selected randomly, con-ditioned to the following constraints:
The trees are located within a 25 m radius from the center of the SP
The trees belong to the dominant and co-dominant canopy class (Nyland, 1996)
The diameter at breast height (dbh) should be equal or larger than the average dbh of the SP and larger than 12 cm;
The trees do not exhibit exterior damages, exposure to diseases, or significant ellipticity.
After extraction, the increment cores were stored in a rigid plastic case to avoid damage during transportation. On each plastic case were recorded the PSC, sample plot, species, and two dbh of each cored tree (measured with a 1 mm precision caliper), one measured on the direction of the core and one perpendicular to the core.
2.3 Processing of the incremental cores
The main information extracted from the incremental cores is the width of each ring and their succession. To
obtain this information, the incremental cores were pro-cessed using a four step procedure, similar to Lebour-geois and Merian (2012) and Kuniholm (2001). The steps supplying the width of each ring and their relative location within a core are mounting, sanding, measure-ment, and cross-dating.
2.3.1 Mounting of the incremental cores
Marin et al. (2019)/Math. Comput. For. Nat.-Res. Sci. Vol. 11, Issue 2, pp. 294–302/http://mcfns.com 297
2.3.2 Sanding of the incremental cores
After the glue dried, the incremental cores were sanded to enhance the differences among the rings. The sanding was executed in three phases: coarse sanding, with a sandpaper grit of 80, fine sanding, with a sandpa-per grit of 240, and extra-fine sanding with a sandpasandpa-per grit of 400. The coarse sanding stops when the support wooden board is reached by the sanding paper. The fine sanding prepares the core for extra-fine sanding, which reveals the cellular anatomic level details. The extra-fine sanding also allows identification of very small annual rings, which are encountered in Norway spruce (Picea abies (L) H.Karst) or Scots pine (Pinus sylvestris L). For very narrow rings a fourth sanding is executed with a 600 or 800 grit sandpaper. After the final sanding, the wooden board is cleaned by blowing air from an air-compressor.
2.3.3 Measurement of the ring width
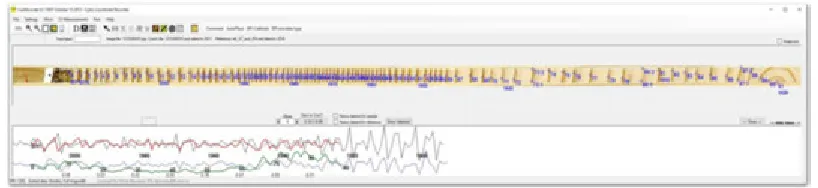
The width of each annual ring was measured using a graphical procedure (Lebourgeois and Merian, 2012), based on high resolution scans of incremental cores. A ring was defined as the area between the beginning of the earlywood to the very end of the latewood. After the extra fine sanding, each wooden plate was scanned with the flatbed scanner Epson XL1000 at 1200 dpi (Fig. 3).
Individual increment cores were delineated from scanned wooden board, and the annual rings were identi-fied and measured using CDendro (Larsson, 2015a) and CooRecorder (Larsson, 2015b). The width of each ring was measured with a precision of 22 micrometer (Fig. 4). The measurements are stored in a Heidelberg file. In the file header, measurements details are recorded (such as units, species or increment core id), while the ring width are stored in the body of the file as a continuous string of numbers. An edited example of such recording is:
HEADER:
KeyCode=I1000056 Length=89
DateEnd=2008 Unit=1/100 mm CDendro=8.1
Comment=Sondaj 14206006 Comment=SP 3
Comment=Arbore 01 Comment=Specie GO
DATA: Tree 107 73 44 88 55 27 10769 71 52 103 78 147 113 74 186 75 7181 96 63 80 51 49 81 69 53 32 37 44 69104 22 56 38 58 101 71 48 55 87 28 16 15 23 28 37 55 39 28 31 25 31 24 44 45 76 82 58 76 106 61 47 25 27 22 26 26 50 45 34 44 69 40 11 30 24 19 25 40 34 55 49 36 47 43 45 27 33 0
Figure 3: Wooden board with eight increment cores, identified on the left side of the image. The red rectangle identifies the core number 1.
Cross-dating represents the final step in producing the data for dendrochronological studies. Cross dating is a method of ensuring that each measured ring is allo-cated to the correct year. The task of pairing the ring with the year is achieved by matching the ring width pattern among trees. The procedure used by the Ro-manian NFI for cross-dating is the one recommended by Holmes (1983), Schweingruber et al. (1990), Wigley (1987), Grissino-Mayer (2001), and Bunn (2010). Ref-erences curves were developed iteratively by pooling se-ries of rings with high inter-correlation. A first refer-ence curve was obtained from cores with clearly visible rings and a coefficient of correlation larger than 0.75. In many cases, the initial reference was relatively short, which required the addition of more series to expand the time windows. A minimum of 10 cores were used for development of a reference curve. The cross-dating pro-cess was implemented in CDendro, which displays during the measurement process the piece-wise (10 years) and series-wise correlation between the measurements and the reference. Therefore, the cores are being cross-dated while measured. Any missing or false rings were shown with a poor correlation, which triggered their investiga-tion with various statistical tests and using pointer years (Schweingruber et al., 1990). A low correlation (e.g. less than 0.4) did not automatically disqualify a particular measurement or invalidated the cross-dating if a good
al., 2007). Accurate assignment of each ring to a year through cross-dating allowed determination of the age and of the growth of a tree.
2.4 Dendrochronological data
Each cross-dated incremental core is uniquely identi-fied, which allows estimation of an average ring width for each PSC and SP species, and consequently for each ecoregion of Romania. To ensure the privacy of in-formation, the measurements of individual incremental cores are not available to the public. However, summary statistics by ecoregion, species, year, and ring age can be made available to the public.
2.4.1 Ecoregions
An ecoregion is defined as an homogeneous area from geomorphological and climatic perspective, which is aligned with the common understand of an ecoregion (Omernik and Griffith, 2014). The Romanian ecoregions were developed from the geomorphological and climatic maps of the Romanian Academy, and lead to 21 distinct ecoregions (Fig. 5).
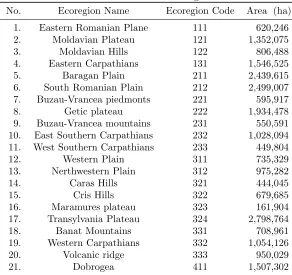
The ecoregions, which follows the geomorphologic and climatic criteria as well as the historical provinces of Romania, vary in size from 161,904 ha (i.e., Mara-mures Plateau) to 2.79 mil. ha (i.e., Transylvania Plateau) (Tab. 1).
Marin et al. (2019)/Math. Comput. For. Nat.-Res. Sci. Vol. 11, Issue 2, pp. 294–302/http://mcfns.com 299
Table 1: Romanian Ecoregions
No. Ecoregion Name Ecoregion Code Area (ha) 1. Eastern Romanian Plane 111 620,246 2. Moldavian Plateau 121 1,352,075 3. Moldavian Hills 122 806,488 4. Eastern Carpathians 131 1,546,525 5. Baragan Plain 211 2,439,615 6. South Romanian Plain 212 2,499,007 7. Buzau-Vrancea piedmonts 221 595,917 8. Getic plateau 222 1,934,478 9. Buzau-Vrancea mountains 231 550,591 10. East Southern Carpathians 232 1,028,094 11. West Southern Carpathians 233 449,804 12. Western Plain 311 735,329 13. Nerthwestern Plain 312 975,282 14. Caras Hills 321 444,045 15. Cris Hills 322 679,685 16. Maramures plateau 323 161,904 17. Transylvania Plateau 324 2,798,764 18. Banat Mountains 331 708,961 19. Western Carpathians 332 1,054,126 20. Volcanic ridge 333 950,029 21. Dobrogea 411 1,507,302
2.4.2 Species and forest management
The incremental cores are collected for all major trees species in Romania. However, the data-in-brief paper contains information only for three species: Norway spruce (Picea abies (L) H.Karst), European beech ( Fa-gus sylvaticaL) and Sessile oak (Quercus petraea(Matt.) Liebl), which cover approximately 60% of the Romanian forests. Furthermore, to ensure the usability of the data in growth and yield modeling, we have included only the incremental cores that were extracted from pure species stands, meaning stand only with Norway spruce, Euro-pean beech or Sessile oak. Evermore, to avoid inclusion of trees growing in significantly different ecosystem con-ditions in models assuming similar stand developments, we have restricted the data set only to even-age stands. An even-aged stand is defined according to the Roma-nian guidelines as a forest stand on which the age of the trees does not differ by more than 5 years (Munteanu et al., 1980). We should point that the definition of an even age-stand enforced in Romania differs than the commonly accepted definition, which consider an even-aged stand as a “stand of trees containing a single age class in which the range of tree ages is usually less than 20% of rotation” (US Forest Service, 2019), which is similar to the definition of Nyland (1996) and Smith
(1997). The general understanding of an even-age stand is termed “relative even-age” by the Romanian guide-lines (Munteanu et al., 1980). To ensure compatibility among various ecoregions and a meaningful number of cores, only the stand with no thinning were considered. We identified thinning by an obvious large increase in the width of the annual rings in respect with the previ-ous and the subsequent rings.
2.4.3 Years, annual rings, and ages
con-occurred in site productivity, we have included only the portion of the incremental cores less than 100 years old.
3
Results
3.1 Summaries
From the 50,000 cores collected by the Romanian NFI, only 6,536 belonged to the three species consid-ered fit the condition mentioned in Section 2.4, namely were extracted from pure un-thinned even-aged stands. The dataset presented in this paper is based on 427,635 ring widths, out of which 136,904 rings are for Norway spruce, 241,240 rings for European beech, and 49,491 rings for Sessile oak. The age of the rings varies from 1 to 99 years. The number of rings decreases with age, from 6,536 rings for trees less than 10 years old to 2,011 at age 99. The number of rings for each ecore-gion also varies significantly according to the species (Tab. 2), from 272 (i.e., European beech in the Mara-mures plateau) to 49,576 (i.e. Norway spruce in the Eastern Carpathians). A similar situation is encoun-tered for the incremental cores, which range from less than 10 in the Maramures plateau (for European beech) to almost 1,000 in the Eastern Carpathians (for Norway spruce).
3.2 Access to data and metadata content
The data containing the average ring width for each ecoregion, species, year, and age from the Roma-nia NFI completed in 2012 is hosted by the
Schol-gon State University. The data can be accessed at the persistent URL https://ir.library.oregonstate-.edu/concern/datasets/8336h726s?locale=en (Strimbu and Marin, 2019), and the corresponding DOI https://doi.org/10.7267/8336H726S. The metadata is located at the same URL address, and are stored in the README NFI .txt. The data can be used with-out restrictions, but acknowledgement of their origin is necessary.
The data is stored as an ASCII file with six fields: Ecoregion, Species, Year, Age, Mean Width, Variance. The ecoregion field stores the codes of the 15 ecoregions on which the three species making the objective of the present study, namely Norway spruce, European beech, and Sessile oak, are encountered. The codes, which are stored as integers, are detailed in Table 1, and also in the metadata file. The species field identifies the species for which the incremental core was extracted using a two-letter code, standard in Romania: MOfor Norway spruce (i.e., “Molid” in Romanian), FA for European beech (i.e., “Fag” in Romanian), andGOfor Sessile oak (i.e., “Gorun” in Romanian). The year field is a number that identifies the calendar year of each ring within the incremental cores. The year is computed as the product between 5 and floor of the year divided by 5. The age field is an integer that identifies the age of each ring. The unit for age is the year. The Mean Width field is a single precision number that represent the average of the ring width for the same species growing in the same ecoregion at the same age, and is in the same quinquen-nial year. The units for Mean Width are micrometers, or
Table 2: Variation of the number of annual rings and incremental cores across ecoregions and species Ecoregion Number of rings Number of incremental cores
Code Norway Spruce European beech Sessile oak Norway Spruce European beech Sessile oak
121 2,881 6,575 41 93
122 8,687 2,385 112 29
131 49,576 28,286 986 332
221 11,572 4,400 142 87
222 15,496 13,962 223 219
231 15,749 24,447 336 292
232 27,969 30,700 506 387
233 4,259 20,280 84 258
321 1,577 1,419 20 17
322 2,379 2,969 31 44
323 272 706 4 11
324 13,763 17,075 187 253
331 1,654 36,007 47 427
332 9,102 21,448 228 285
333 28,595 23,445 568 287
Marin et al. (2019)/Math. Comput. For. Nat.-Res. Sci. Vol. 11, Issue 2, pp. 294–302/http://mcfns.com 301
10−6 m. The variance field is a single precision number that represents the variance of the width of the annual rings from the same ecoregion, species, year and age. The units for variance are pico-squared meters, or the square of micrometers, namely 10−12 m2.
The metadata contains only the information relevant to the stored data, not the details on how the data was obtained, which is presented in this article.
Acknowledgement
We are grateful to two anonymous reviewers for their valuable comments that helped improve the manuscript.
References
Bechtold, W.A., Patterson, P.L., 2005. The enhanced forest inventory and analysis program - national sam-pling design and estimation procedures (General Tech-nical Report No. SRS-80). U.S. Department of Agri-culture, Forest Service, Southern Research Station, Asheville, NC.
Bettinger, P., Boston, K., Siry, J.P., Grebner, D.L., 2009. Forest Management and Planning. Academic Press, Burlington MA.
Brooks, J.R., Jiang, L., Clark, A.I., 2007. Compati-ble Stem Taper, Volume, and Weight Equations for Young Longleaf Pine Plantations in Southwest Geor-gia. Southern Journal of Applied Forestry 31, 187–192.
Bunn, A.G., 2010. Statistical and visual crossdating in R using the dplR library. Dendrochronologia 28, 251–258. DOI: https://doi.org/10.1016/j.dendro.2009.12.001
Cushman, K.C., Muller-Landau, H.C., Condit, R.S., Hubbell, S.P., 2014. Improving estimates of biomass change in buttressed trees using tree taper models. Methods in Ecology and Evolution 5, 573–582. DOI: https://doi.org/10.1111/2041-210X.12187
Davis, L.S., Johnson, K.N., Bettinger, P., Howard, T.E., 2001. Forest management, 4th ed. McGraw-Hill, New York.
Douglass, A.E., 1941. Crossdating in Dendrochronology. Journal of Forestry 39, 825–831.
Garber, S.M., Maguire, D.A., 2003. Modeling stem ta-per of three central Oregon species using nonlinear mixed effects models and autoregressive error struc-tures. Forest Ecology and Management 179, 507–522. DOI: https://doi.org/10.1016/S0378-1127(02)00528-5
Grissino-Mayer, H.D., 2001. Evaluating Crossdating Ac-curacy: A Manual and Tutorial for the Computer Pro-gram COFECHA. Tree-ring Research 57, 5–21.
Holmes, R.L., 1983. Computer-assisted quality control in tree ring dating and measurement. Tree-ring Bulletin 43, 69–78.
Kozak, A., 2004. My last words on taper equa-tions. The Forestry Chronicle 80, 507–515. DOI: https://doi.org/10.5558/tfc80507-4
Kuniholm, P.I., 2001. Dendrochronology and Other Ap-plications of Tree-ring Studies in Archaeology, in: The Handbook of Archeological Sciences. John Wiley & Sons, London, pp. 1–11.
Larsson, L.-A., 2015a. CDendro. Cybis Elektronik & Data AB, Saltsj¨obaden SW.
Larsson, L.-A., 2015b. CooRecorder. Cybis Elektronik & Data AB, Saltsj¨obaden SW.
Lebourgeois, F., Merian, P., 2012. Principes et m´ethodes de la dendrochronologie. AgroParisTech, Nancy FR.
Lenhart, J.D., Hackett, T.L., Laman, C.J., Wiswell, T.J., Blackard, J.A., 1987. Tree Content and Taper Functions for Loblolly and Slash Pine Trees Planted on Non-Old-Fields in East Texas. Southern Journal of Applied Forestry 11, 147–151.
Munteanu, C., Neagu, I., Cristescu, C., Predescu, Gh., Ceuca, G., Patrascoiu, N., Moise, I., Nicoara, I., Smeykal, G., Enasescu, S., Draghiciu, 1980. Indrumar pentru amenajarea padurilor. ICAS, Bucuresti.
Neuwirth, B., Schweingruber, F.H., Winiger, M., 2007. Spatial patterns of central European pointer years from 1901 to 1971. Dendrochronologia 24, 79–89.
Nyland, R.D., 1996. Silviculture. Concepts and applica-tions. McGraw-Hill, New York.
Omernik, J.M., Griffith, G.E., 2014. Ecoregions of the Conterminous United States: Evolu-tion of a Hierarchical Spatial Framework. En-vironmental Management 54, 1249–1266. DOI: https://doi.org/10.1007/s00267-014-0364-1
Rucareanu, N., Leahu, I., 1982. Amenajarea padurilor. Ceres, Bucharest.
Schadauer, K., 2019. 10th ENFIN Meeting.
forest ecology, 9th ed. Wiley, New York.
Strimbu, B.M., Marin, Gh., 2019. Incremental cores of the National Forest Inventory from Romania (Data). Oregon State University, Corvallis OR.
Tomppo, E., Gschwantner, T., Lawrence, M., McRoberts, R.E. (Eds.), 2010. National Forest In-ventories: Pathways for Common Reporting. Springer Netherlands.
Vanclay, J.K., 1994. Modeling forest growth and yield. CAB International, Wallingford UK.