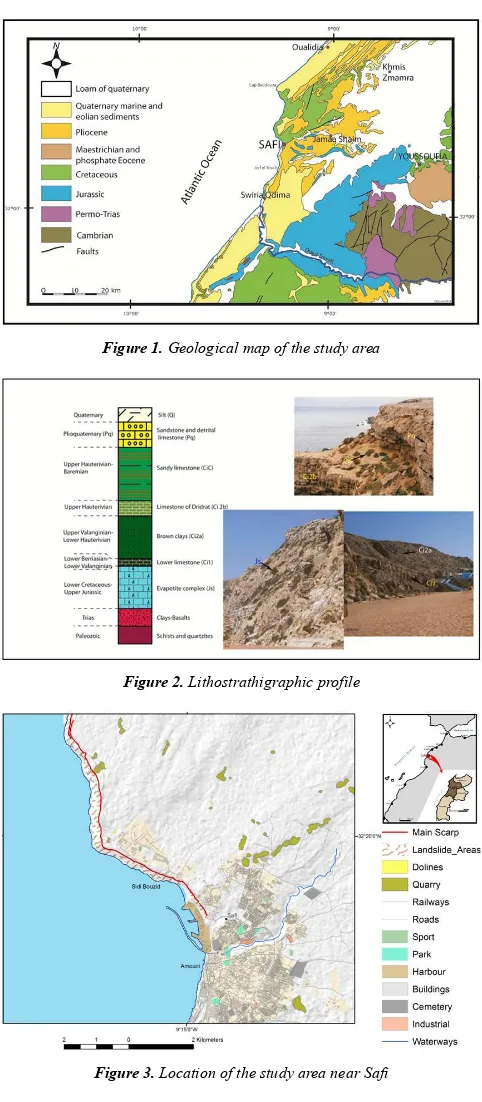
Remote Sensing and GIS Contribution to the Detection of Coastal Slope Failure in the Safi Area, Morocco
Full text
Figure
Related documents
Results of the survey are categorized into the following four areas: primary method used to conduct student evaluations, Internet collection of student evaluation data,
The measurement of serum 3-alpha diol G in acne female patients as a diagnostic routine in cases of acne female patients without hyperandrogenism or menstrual
Formal wage Informal wage Returns to capital Value Added GDP Formal labor demand Informal labor demand Total Labor Demand Total Labor Supply Unemployment Rate Physical
Conversely, 43.7% of all respondents who misused prescription drugs met criteria for alcohol dependence, problem gambling, and (or) had used illicit drugs in the past year..
The paper focuses on the Coventry University Library’s involvement with a JISC funded project D-TRACES, which sought to further embed Replay, the Siobhan Davies Dance Archive,
The proposed model is the only one that is applicable in environments including sensitive data, prohibiting access scans over raw-data and knowledge of raw-data updates (required
The purpose of this paper is to develop a comprehensive model, which describes the relationship between eCRM factors and E-loyalty at different adoption stages of
Except perhaps for the most selective and most well endowed private colleges and uni- versities, who have sufficient student demand and financial resources to chart
