INTERNATIONAL JOURNAL OF PHARMACEUTICAL, CHEMICAL AND BIOLOGICAL SCIENCES
Available online at
www.ijpcbs.com
DEVELOPMENT AND VALIDATION OF RP-HPLC METHOD
FOR THE ESTIMATION OF PROPOFOL IN BULK AND
PHARMACEUTICAL FORMULATIONS
SM. Anil Kumar
1*, A. Satish Kumar Shetty
1and ND. Satyanarayan
21
Department of Pharmaceutical Analysis, National College of
Pharmacy, Shimoga-577 201, Karnataka, India.
2
Department of Pharmaceutical Chemistry, Kuvempu University,
PG Centre, Kadur, Karnataka, India.
INTRODUCTION
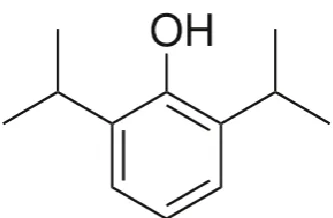
Propofol chemically is 2, 6 – Di isopropyl phenyl. It is a short-acting medication that results in a decreased level of consciousness and lack of memory for events. Its uses include the starting and maintenance of general anesthesia, sedation for mechanically ventilated adults, and procedural sedation. It is also used for status epilepticus if other medications have not worked. It is given by injection into a vein. Maximum effect takes about two minutes to occur and it typically lasts five to ten minutes.2
Common side effects include an irregular heart rate, low blood pressure, burning sensation at the site of injection, and the stopping of breathing. Other serious side effects may include seizures, infections with improper use, addiction, and propofol infusion syndrome with long-term use. It appears to be safe for using during pregnancy but has not been well studied in this group. However, it is not recommended during cesarean section. Propofol is not a pain medication, so opioids such as morphine may
also be used.3 Propofol is believed to work at
least partly via a receptor for GABA
On literature survey it was revealed that several HPLC, Gas chromatography and GC/MS methods have been developed for the estimation of propofol in blood, plasma and urine samples4,5.
HPLC method for the estimation of the same has been developed by comparison with different extraction methods also6-9. Since no method has
been found for the estimation of propofol in bulk and pharmaceutical formulation, Here an attempt has been made to develop and validate simple , sensitive and precise RP HPLC method for the estimation of propofol in pure form and in formulation forms.
MATERILA AND METHODS Instrument used
A Shimadzu class HPLC unit accomplished with SPD-20AD UV-Visible detector, Enable C18 (250*4.6*5) Column (Shimadzu); LC-20 AD Pump; Quantitative HPLC was performed on a isocratic mode with 20 μl injection of sample ABSTRACT
The objective of the current study was to develop a simple, accurate, precise and rapid RP-HPLC method and subsequently validate as per ICH guidelines for the determination of Propofol using mobile phase acetonitrile and methanol (pH-5.3), in the ratio of 25:75 v/v was considered to be the optimal composition as the solvent. The proposed method involves the measurement of retention time at selected analytical wavelength. 254.0 nm was selected as the analytical wavelength. The
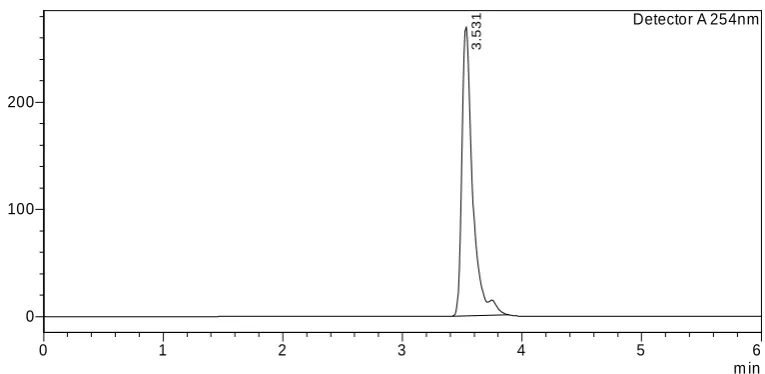
retention time of PROP was found to be 3.534 min. The linearity of the proposed method was
investigated in the range of 100-500 μg/ml with regression coefficient value of 0.9996.The method
was statistically validated for its linearity, accuracy and precision. Both inter-day and intra-day variation was found to be showing less % RSD (Relative Standard Deviation) value indicating high grade of precision of the method.
Keywords: Propofol, RP-HPLC Method, Validation and Relative standard deviation.
loop (manual). The output signal was monitored and integrated using software LAB SOLUTIONS (Shimadzu).
Preparation of Mobile phase
The HPLC grade acetonitrile and methanol was filtered through 0.4μm membrane filter. Mobile phase was prepared by mixing 250 ml of acetonitrile with 750ml of methanol and pH-5.3 was adjusted by ortho-phosphoric acid and sonicated for 15 min.
Standard stock solution
Propofol (100mg) was accurately weighed and transferred in a 100ml volumetric flask. Volume was made up to 100ml with mobile phase to obtain a concentration of 1000μg/ml (Stock-I). From this stock solution-I aliquots of 1.0ml, 2.0ml, 3.0ml, 4.0ml, and 5.0ml were withdrawn and transferred into 10 ml volumetric flasks and made up the volume with mobile phase to obtain a concentrations of 100μg/ml, 200μg/ml, 300μg/ml, 400μg/ml, and 500μg/ml respectively.
Preparation of calibration curves
Appropriate dilutions were prepared separately and 20 μl of each was injected into the HPLC system and their chromatograms were recorded under the same chromatographic conditions as described below. Peak areas were recorded for all the peaks and a standard calibration curve of AUC against concentration was plotted.
Chromatographic condition
The mobile phase containing both acetonitrile and methanol in the ratio of 25:75 was selected as the optimum composition of mobile phase, because it was found that this solvent system was very ideal for the selected drug. The flow rate was set to 1.0 ml/min and UV detection was carried out at 254.0nm. The mobile phase and samples were degassed by sonication for 15 min and filtered through 0.4 μm membrane filter paper. All determinations were performed at constant column temperature (250C).
Selection of analytical concentration range
chromatographic conditions as described above. Peak areas were recorded for all the peaks and a standard calibration curve of AUC against concentration was plotted.
Analysis of formulation
10ml of the formulation of Propofol (Diprivan) was pipetted out and transferred to 100 mL volumetric flask, dissolved in sufficient quantity of mobile phase. The solution was filtered through 0.4 µm membrane filter paper. The contents were sonicated for 20 minutes and the final volume was made up to the mark with mobile phase (1000 µg/ml)
Appropriate aliquots were pipetted out from the sample stock A solution (1000 µg/ml) in to a series of 10 mL volumetric flasks. The volume was made up to the mark with the mobile phase to get a set of solutions having the concentration range of 100, 200, 300, 400 and 500 µg/ml of PROP. A 20 µl volume of each sample was injected in to the sample injector of HPLC system and their chromatograms were recorded under the same chromatographic conditions as described above. The area of each peak was determined at 254 nm and the amount of drug present in the sample was determined.
Method validation
The developed analytical method was subjected to various validation parameters such as linearity, limit of quantification (LOQ), limit of detection (LOD), accuracy, precision, recovery studies and reproducibility as per the ICH guidelines.
RESULT AND DICUSSION
The present manuscript deals with estimation of PROP in pharmaceutical dosage form by RP- HPLC method using mobile phase as the solvent. The developed method is based upon estimation of the drug by determining the area under curve of the chromatogram at selected analytical wavelength.
recovery at each level (n = 3), and mean % recovery (n = 3) were determined and Statistical validation data for accuracy determination summarized in Table 3.
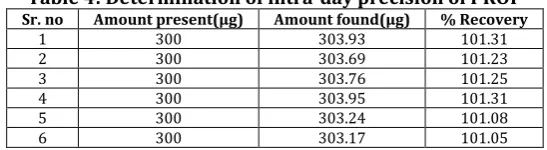
Intra-day precision as estimated by assaying samples containing 300 μg/ml of propofol six times and the results were averaged for statistical evaluation. The assay results and statistical validation data for intra-day precision are summarized in Table 4 and 5.
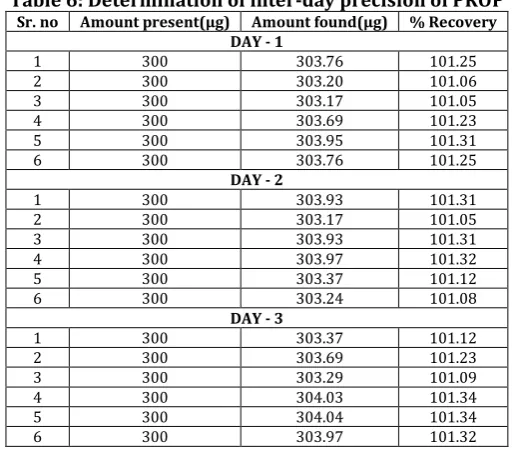
Inter-day precision was evaluated by analyzing a set of quality control samples containing 300 μg/ml of propofol, replicates were analyzed on three consecutive days. The determination of inter-day precision and statistical validation data for inter-day precision is summarized in Table 6 and 7.
Both intra-day and inter-day variation showed less % RSD value indicating high grade of precision of the method.
The robustness was evaluated by analyzing the samples by varying few parameters like wavelength and flow rate. The determination of robustness and statistical validation data is summarized in Table 8 and 9.
The validation results obtained confirm the suitability of the proposed RP-HPLC method for simple, accurate and precise analysis of propofol in pharmaceutical preparations. The proposed method does not need any prior separation of
propofol before analysis. In addition it is suitable for application without interference of excipients and can be applied directly to the commercial preparations without previous treatment.
CONCLUSION
Proposed study describes a new RP-HPLC method for the estimation of Propofol in formulations using simple mobile phase. The method gives good resolution with a short analysis time. The method was validated and found to be simple, sensitive, accurate and precise. So the developed method can be used conveniently for analysis of Propofol in combined pharmaceutical dosage forms.
ACKNOWLEDGEMENT
The authors are highly thankful to the National College of Pharmacy, Shivamogga, Karnataka, for providing all the laboratory facilities. We would sincerely thank Vision Group of Science and Technology, Government of Karnataka for granting fund under CISE to procure the analytical instruments to carry out the proposed research work. We would also express our gratitude to Amneal Pharmaceutical Pvt Ltd, Ahmedabad, Gujarath, for providing the gift sample of Propofol.
m in m V
0 1 2 3 4 5 6
0 50 100 150
200 Detector A 254nm
3
.5
3
4
Fig. 2: Chromatogram showing the retention time of Propofol
Fig. 3: Calibration curve of Propofol at 254nm by RP-HPLC method
m V
200
Detector A 254nm
3
.5
3
Table 1: Summary of validation and System suitability parameters of Propofol
Parameters Propofol Linearity / Range μg/ml 100 - 500
Slope 3193.6
Intercept 3338.1 Regression Co efficient (r2) 0.9996
Limit of Detection (μg/ml) 7.4379 Limit of Quantitation (μg/ml) 22.5391
Retention Time (min) 3.535 Tailing Factor 1.192
Table 2: Recovery of PROP in spiked standard drug solution
Level of %
recovery Amount present In (μg/ml) Amount of standard drug added (μg) recovered (μg)Total amount % Recovery
80%
200 100 303.93 101.31
200 100 303.69 101.23
200 100 303.76 101.25
100%
200 200 398.74 99.68
200 200 399.01 99.75
200 200 398.89 99.72
120%
200 300 500.15 100.03
200 300 500.14 100.02
200 300 500.17 100.03
Where n *= 3
Table 3: Statistical Validation Data for Accuracy determination
Components Mean*(%) Deviation* Standard % Relative standard deviation* Standard Error*
PROP 100.33 0.7079 0.7055 0.4087
Table 4: Determination of intra-day precision of PROP
Sr. no Amount present(μg) Amount found(μg) % Recovery
1 300 303.93 101.31
2 300 303.69 101.23
3 300 303.76 101.25
4 300 303.95 101.31
5 300 303.24 101.08
6 300 303.17 101.05
Table 5: Statistical validation data for determination of intra-day precision
Components Mean*(%) Standard Deviation* % Relative standard deviation* Standard Error*
PROP 101.20 0.1131 0.1118 0.0462
Table 6: Determination of inter-day precision of PROP
Sr. no Amount present(μg) Amount found(μg) % Recovery DAY - 1
1 300 303.76 101.25
2 300 303.20 101.06
3 300 303.17 101.05
4 300 303.69 101.23
5 300 303.95 101.31
6 300 303.76 101.25
DAY - 2
1 300 303.93 101.31
2 300 303.17 101.05
3 300 303.93 101.31
4 300 303.97 101.32
5 300 303.37 101.12
6 300 303.24 101.08
DAY - 3
1 300 303.37 101.12
2 300 303.69 101.23
3 300 303.29 101.09
4 300 304.03 101.34
5 300 304.04 101.34
6 300 303.97 101.32
Table 7: Statistical validation data for determination of inter-day precision
Components Mean*(%) Standard Deviation* % Relative standard deviation* Standard Error*
PROP 101.21 0.1111 0.1097 0.0453
Table 8: Determination of Robustness of PROP
Levels Retention time Tailing factor Flow Rate
-0.2 3.562 1.188
0 3.535 1.192
+0.2 3.503 1.163
Wave Length
-2 3.538 1.161
0 3.535 1.192
+2 3.524 1.188
REFERENCES
1. www.wikipedia.com.
2. Propofol: The American Society of Health-System Pharmacists, Archived from the original on 9 October 2016. 3. Miner JR and Burton JH. Clinical
practice advisory: Emergency department procedural sedation with propofol, Annals of Emergency Medicine. 2007;50(2):182–7
4. Manoj Varchney, Christoph N Seubert and Donn M Dennis. A new method for the quantitation of propofol in human plasma by efficient solid-phase extraction and liquid chromatography/APCI-triple quadruple mass spectrometry detection, Journal of Chromatography B. 2004;810(2):291-296.
5. Eunyoung Han. A study of analytical methods for the determination of propofol in blood, Archives of Pharmacal Research. 2014;37(2):157– 167.
6. Andrzej L and Dawidowicz. Determination of Propofol in Blood by
HPLC. Comparison of the Extraction and Precipitation Methods, Journal of Chromatographic Science. 1995;33(7):377–382.
7. Plummer GF. Improved method for the determination of propofol in blood by high-performance liquid chromatography with fluorescence detection, Journal of Chromatography Biomedical Sciences and Applications. 1987; 421:171-176.
8. Sónia Campos, Joaquim Monteiro and Luís Antunes. Simultaneous Quantification of Propofol and its Non-Conjugated Metabolites in Several Biological Matrices Using Gas Chromatography/Ion Trap – Mass Spectrometry Method. Journal of Analytical & Bioanalytical Techniques. 2014;5:3.