586
INTERNATIONAL JOURNAL OF PHARMACEUTICAL, CHEMICAL AND BIOLOGICAL SCIENCES
Available online at www.ijpcbs.com
FLURBIPROFEN MICROBEADS FOR CONTROLLED RELEASE
Nagakanyaka Devi Paladugu1*, Bonthu Satyanarayana1, Neerukonda Vamsi1, Shaik Irfan Pasha1, Deepthi Poloju2, MD Arief 3, M Rajeev Kumar1 and Shaik Wajid Pasha1
1Department of Pharmaceutics, Max Institute of Pharmaceutical Sciences, Velugumatla, Khammam, Andhra Pradesh, India.
2Department of Pharmaceutical Analysis, Max Institute of Pharmaceutical Sciences, Velugumatla, Khammam, Andhra Pradesh, India.
3Department of Pharmacology, Max Institute of Pharmaceutical Sciences, Velugumatla, Khammam, Andhra Pradesh, India.
INTRODUCTION
Flurbiprofen [1,1’-biphenyl]-4-acetic acid, 2-fluoro-alpha-methyl-, is an important analgesic and non-steroidal anti inflammatory drug (NSAID) also with anti-pyretic properties whose
mechanism of action is inhibition
ofprostaglandin synthesis. It is used in the therapy of rheumatoid disorders. Flurbiprofen is rapidly eliminated from theblood and its plasma elimination half-life is 3-6 hours. In order to maintain therapeutic plasma levels the drug mustbe administered approximately 150-200mg
daily by oral in divided doses1.To overcome
inherent drawbacks associated with
conventional dosage forms of Flurbiprofen, an attempt is beingmade to develop an alternative drug delivery system in the form of micrbeads for controlled release. NSAIDS are the cyclooxygenases enzyme inhibitors, which results in the direct inhibition of the
biosynthesis of prostaglandins and
thromboxane’s from arachidonic acid. NSAIDS are used for the relief of mild to moderate pain, minor febrile conditions and for acute and
Research Article
ABSTRACT
587
chronic inflammatory disorders such as
osteoarthritis, rheumatoid arthritis and
ankylosing spondylitis. Prostaglandins,
prostacyclin (PGI2) and thromboxane A2 (TXA2) are produced from arachidonic acid by enzyme cyclooxygenase which exists in a consecutive (COX-1) and an inducible (COX-2) isoforms, the former serves physiological housekeeping functions while the latter, normally present in minute quantities, is induced by cytokines and other signal molecules at the site of
inflammation2.The objective of controlled
release drug delivery includes two important aspects namely spatial placement and temporal delivery of drug. Spatial placement relates to targeting a drug to a specific organ or tissue, while temporal delivery refers to controlling the rate of drug delivery to the target tissue. The objective in designing a controlled release system is to deliver drug at a necessary to achieve and maintain a constant drug blood level. Sustained release systems include any drug delivery system that “achieves slow release of drug over an extended period of time”. If the system only extends the duration of release without reproducible kinetics it is considered a
prolonged release system3, 4, 5.
Micro-encapsulation is a process whereby small discrete solid particles or small liquid droplets are surrounded or enclosed, by an intact shell. It has been widely employed in the design of controlled release and sustained release dosage forms.Many drugs have been microencapsulated to reduce gastric and other gastrointestinal tract irritation. The local irritation and release properties of a number of topically applied products can be altered by microencapsulation. This process is also used to mask the taste of bitter drugs6, 7, 8. Microencapsulation method by Ionotropic Gelation technique involves the production of strong spherical beads with a narrow particle size distribution and low friability could be prepared with high yield and a drug content approaching 98%. The flow properties of micronized or needle like drug crystals were significantly improved by this agglomeration technique when compared with non-agglomerated drug crystals. It has been suggested that the cross-links were caused either by simple ionic bridging of two carboxyl groups on adjacent polymer chains via calcium ions or by chelating of single calcium ions by hydroxyl and carboxyl groups on each of a pair
of polymer chains9,10,11. Microbeads were
prepared by using sodium alginate as a polymer and calcium chloride as a cross-linking agent.
MATERIALS AND METHODS Materials
Flurbiprofen was obtained as a gift sample from Sun Pharmaceuticals Ltd., Mumbai. Hydroxy Propyl Methyl Cellulose was obtained from Colorcol, U.K. Poly Ethylene Glycol-6000, Sodium Alginate, Calcium Chloride, Petroleum Ether was obtained from S.D. Fine Chem. Ltd., Mumbai.
Methods
1. Preformulation study
Prior to the development of the dosage forms the preformulation study was carried out. Hence infra-red spectra of the physical mixture of the drug and the polymers chosen were taken. Also
the infra-red spectra of the drug12 and polymers
were run individually. The application of infra-red spectroscopy lies more in qualitative identification of substance either in pure form or in mixtures and as a tool in establishing the structure.
2. Standard plot for Flurbiprofen
Acid Buffer(PH1.2): accurately weighed 10 mg of
Flurbiprofen was dissolved in 10ml of methanol and made up to mark with PH 1.2 in a 100ml volumetric flask to get working stock solution having concentration of 100µg/ml.
PH 6.0: accurately weighed 10mg of Flurbiprofen
was dissolved in 100ml of PH 6.0 solution to get working stock solution having concentration of 100µg/ml Phosphate Buffer (PH 7.2): the above procedure was followed but instead of PH 6.0, phosphate buffer PH 7.2 was used. From the above stock solution aliquots of 1.25ml, 2.5ml, 3.75ml, 5.0ml, 6.25ml and 7.5ml were pipetted out into a series of 25ml volumetric flasks and volume was made up to 25ml in order to get a concentration ranging from 5-30µg/ml. The absorbance of the resulting solution was then
measured at 247nm using UV
spectrophotometer against respective parent solvent as a blank. The standard curve was
obtained by plotting absorbance V/S.
concentration in µg/ml13, 14. Results are given in table 1 and figure 1.
3. Preparation of microbeads
588
at 700C for 6 hrs in an oven.Three sets of microbeads were prepared. First set were prepared using only sodium alginate, second set were prepared in a combination of HPMC and sodium alginate, third set were prepared in
combination of PEG-6000 and sodium
alginate15.Composition of microbeads is given in table 2.
EVALUATION PARAMETERS OF MICROBEADS 1. Granulometric study
As particle size has very significant effect on the release profile of microbeads, granulometric study was conducted to determine the particle size distribution pattern. For this study, sieve analysis was carried out on mechanical sieve shaker, using different meshes (#12, #16, #20, #30) of American society of testing materials (ASTM).
2. Flow property
Angle of repose method was employed to assess the flowability. Angle of repose is defined as the maximum angle possible between the surface of a pile of powder and the horizontal plane. It was measured by fixed funnel method. The fixed funnel method employs a funnel that was secured with its tip at a given height H, above graph paper that was placed on a flat horizontal surface. Microbeads were carefully poured through the funnel until the apex of the conical pile just touched the tip of the funnel. The angle of repose was determined by using the equation
Tanθ = H/R or θ = tan-1 H/R
Where θ = angle of repose,
R = radius of base of the pile H = height of the pile
3. Drug Entrapment Efficiency
Drug entrapment efficiency of Flurbiprofen microbeads was performed by accurately weighing 50mg of microbeads and suspended in 100ml of simulated intestinal fluid of PH 7.2±0.1 and it was kept for 24 hrs. Next day it was stirred for 15 mins, and subjected for filtration. After suitable dilution, Flurbiprofen content in the filtrate was analysed spectrophotometrically at 247nm using shimadzu 1201 UV-visible spectrophotometer.
4. In-vitro Dissolution Studies
In-vitro drug release profile of the microbeads was evaluated using rotating basket dissolution
apparatus. 900ml of acid buffer(PH 1.2),
duodenal fluid (PH 6.0) and phosphate buffer (PH
7.2) maintained at 37±0.50C were used as
dissolution media respectively, and the basket
was rotated at a constant speed of 50 rpm. Accurately weighed amount of microbeads equivalent to 200 mg of drug were placed in the baskets.Aliquotes of samples were withdrawn after 2nd, 4th, 6th, 8th and 12th hr. fresh dissolution media was replaced to maintain the original volume. The samples withdrawn were filtered, diluted suitably and analysed at 247nm spectrophotometrically for drug release.
5. Scanning electron microscopy
The samples were dried thoroughly in vacuum desiccator before mounting on brass specimen studies. The samples were mounted on specimen studies using double sided adhesive tape, and gold-palladium alloy of 120 A0kness was coated on the sample using sputter coating unit in an argon ambient of 8-10 pascal with plasma voltage about 2 KV and discharge current about 20 MA. The sputtering was done for nearly 3 minutes to obtain uniform coating on the samples to enable good quality SEM images. The SEM was operated at low accelerating voltage of about 15 KV with load current of about 80 MA.
6. Accelerated Stability Studies
The formulations were stored in oven at 37±10C
and 60±10C for a period of six weeks. The samples were analysed for drug content every
week by spectrophotometer at 247nm.16, 17
RESULTS AND DISCUSSION 1. Preformulation study
The characteristic absorption peaks of
flurbiprofen were obtained at 1701 cm-1, 1417 cm-1, 1216 cm-1. The IR spectra’s of the drug and polymer combinations were compared with the spectra of pure drug and individual polymers.
The principle peaks obtained for the
combinations were almost similar to that of the drug. The IR spectra of drug-HPMC, drug-PEG 6000, drug- sodium alginate did not show many changes.
2. Granulometric study
589
3. Flow propertyThe flow property of the prepared formulations was checked by the method, angle of repose. Acceptable range of angle of repose is 200 to 400. All the formulations showed an angle of repose within the range.The angle of repose values are given in Table3.
4. Drug entrapment efficiency
The drug entrapment efficiency of all the formulations were in the range between 87.5% to 98.8%. Drug entrapment efficiency of
microbeads increases with increase in
percentage of sodium alginate, HPMC and PEG-6000. But the amount of calcium chloride has no significant effect on the drug entrapment efficiency.Results are given in table 4.
5. In-vitro dissolution studies
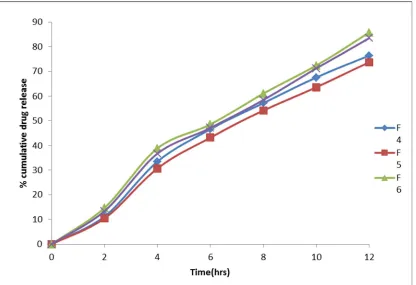
The formulations F1, F2, F3 containing 2%, 3% and 4% sodium alginate respectively showed a release of 93.5%,90.11% and 87.81% after 10 hours. This shows that more sustained release was observed with the increase in percentage of sodium alginate.The formulations F4 and F5 containing 4% sodium alginate + 1% HPMC and 4% sodium alginate + 2% HPMC showed a release of 76.4% and 73.6% after 12 hrs. This indicates that the release rate is further retarded due to addition and increase in percentage of HPMC.The formulations F6 and F7 containing 4% sodium alginate + 4% PEG-6000 and 4% sodium alginate + 6% PEG-6000 showed a release of 85.71% and 83.44% respectively. This shows the beads formulated with PEG-6000 prolongs the release when compared to formulations with only sodium alginate but faster release is observed when compared with formulations of HPMC.Results are given in table 5.The values of co-efficient of correlation were found to be more linear for zero order release as compared to first order. It was concluded that release of drug from formulation F1 to F7 followed zero order kinetics.Values are given in table 6. The kinetic studies were extended
further and subjected to curve fitting data using PCP DISSO-V2 software to observe the mechanism of drug release. The values of co-efficient of correlation were found to be best fitted to krosmeyer-peppas model. The values of diffusion co-efficient for formulations F1 to F3 are shown to be 0.8964, 0.8825, 0.9078 respectively which indicate that the release of drug occurs by diffusion following non-fickian transport mechanism. The values of diffusion co-efficient for formulations F4 to F7 are shown to be 1.0299, 1.0039, 1.0217 and 1.1668 respectively which indicate that the release of drug occurs by case-2 transport. The % correlation coefficient Vs time are given in figures 5, 6.
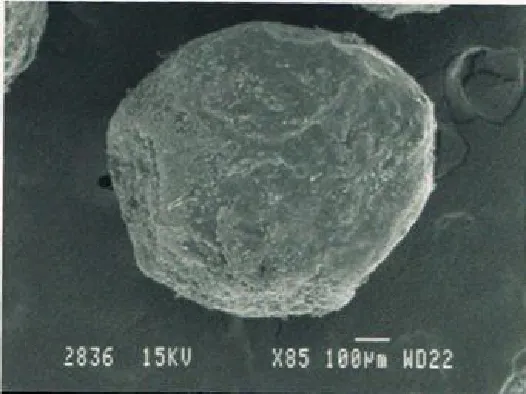
6. Scanning electron microscopy
Microbeads of formulation F3 were spherical and their surface was rough giving them a sandy appearance. In case of formulation F5 the sphericity is slightly destroyed due to higher internal viscosity but uniformity is maintained. Bridging was observed, which accounts for the dense nature. The low porosity of the coating material, and larger particle size accounts for slow release of the drug.Beads of formulation F7 were almost spherical with smooth surface which may be due to the increased percentage of PEG-6000. The sizes of the beads were small compared to formulation F5.Photographs of formulations are shown in figure 1-3.
7. Stability studies
Among the seven formulations prepared F4 and F5 which showed the best release from in-vitro dissolution data were selected for stability studies.Stability study was carried out for the formulations F4 and F5 at 37±10C and 60±10C for a period of 45 days. The samples were analyzed for drug content at different time intervals, and it is evident that there were no changes in the content.This indicates that the formulations F4 & F5 were stable for a period of 45 days at the above mentioned temperatures.
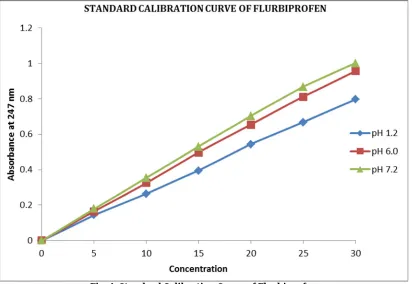
Table 1: Standard Calibration Curves of Flurbiprofen
SI. No: Concentration(µg/ml) Absorbance at 247nm
PH 1.2 PH 6.0 PH 7.2
1. 5 0.143 0.164 0.178
2. 10 0.264 0.325 0.354
3. 15 0.394 0.497 0.529
4. 20 0.543 0.654 0.703
5. 25 0.668 0.812 0.868
590
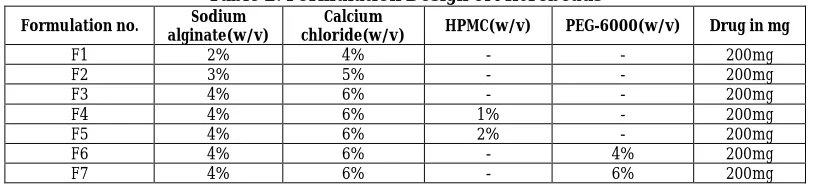
Table 2: Formulation Design of Microbeads
Formulation no. Sodium
alginate(w/v)
Calcium
chloride(w/v) HPMC(w/v) PEG-6000(w/v) Drug in mg
F1 2% 4% - - 200mg
F2 3% 5% - - 200mg
F3 4% 6% - - 200mg
F4 4% 6% 1% - 200mg
F5 4% 6% 2% - 200mg
F6 4% 6% - 4% 200mg
F7 4% 6% - 6% 200mg
Table 3: Angle of Repose of Microbeads
SI.No. Formulations Angle of repose
1. F1 33020’
2. F2 30010’
3. F3 29030’
4. F4 24050’
5. F5 25020’
6. F6 28040’
7. F7 26020’
Table 4: Drug Entrapment Efficiency of Microbeads
Formulations Absorbance at 247nm % drug entrapment efficiency
F1 0.305 87.5
F2 0.311 90.0
F3 0.323 92.5
F4 0.345 97.5
F5 0.348 98.8
F6 0.330 94.0
F7 0.341 96.4
Table 5: Cumulative Drug Release Profile for Formulations F1-F3
TIME % Cumulative Drug Retained Log % Cum. Drug Retained % Cumulative Drug Released
F1 F2 F3 F1 F2 F3 F1 F2 F3
0 100 100 100 2 2 2 0 0 0
2 84.37 85.85 87.28 1.9261 1.9337 1.9409 15.63 14.15 12.72
4 61.4 63.05 64.55 1.7881 1.7996 1.8098 38.60 36.95 35.45
6 43.31 45.09 49.4 1.6365 1.6540 1.6937 56.69 54.91 50.06
8 25.31 30.14 32.74 1.4032 1.4791 1.5150 74.69 69.86 67.26
10 6.5 9.89 12.19 0.8129 0.9951 1.0860 93.50 90.11 87.81
Table 6: Cumulative Drug Release Profile for Formulations F4-F7
Time % Cumulative Drug Retained Log % Cum. Drug Retained % Cumulative Drug Released
F4 F5 F6 F7 F4 F5 F6 F7 F4 F5 F6 F7
0 100 100 100 100 2 2 2 2 0 0 0 0
2 88.79 89.58 85.27 86.59 1.9483 1.9522 1.9307 1.9374 11.21 10.42 14.73 13.41
4 66.55 69.29 61.15 63.31 1.8231 1.8406 1.7863 1.8014 33.45 30.71 38.85 36.69
6 53.39 56.78 51.45 52.91 1.7274 1.7541 1.7113 1.7235 46.61 43.22 48.55 47.09
8 42.79 45.79 38.94 41.53 1.6313 1.6607 1.5903 1.6183 57.24 54.21 61.06 58.47
10 32.51 36.43 27.66 28.85 1.5120 1.5614 1.4418 1.4601 67.49 63.57 72.34 71.15
12 23.6 26.33 14.29 16.56 1.3729 1.4204 1.1550 1.2190 76.4 73.67 85.71 83.44
Table 7: Regression Coefficient Values
Formulation Zero Order First Order
F1 0.9999 0.9899
F2 0.9994 0.9109
F3 0.9959 0.9055
F4 0.9947 0.8985
F5 0.9928 0.8999
F6 0.9904 0.9446
591
Fig. 1: SEM of Formation F3 Under Low Magnification
Fig. 2: SEM of Formation F5 Under Low Magnification
592
Fig. 4: Standard Calibration Curve of Flurbiprofen
593
Fig. 6: Cumulative Drug Release of Formulations 4, 5, 6 And 7
CONCLUSION
Oral controlled release of flurbiprofen can besuccessfully achieved by ionotropic gelation techniqueusing a combination of sodium alginate-hpmc and sodium alginate-peg 6000 as polymers. Preparedmicrobeadsshown higher drugentrapment efficiency and prolonged releasecharacteristics. Flurbiprofen release from microbeadswas influenced by alginate and hpmc concentration.among the different formulations of microbeads, f-4and f-5 were estimated as best formulations because fromthese formulations drug release was observed to bein controlled manner.
REFERENCES
1. Kathleen Parfitt and Martindale, “The
Complete Drug Reference”, Philadelphia
Pharmaceutical Press, 1996; 32ndEdn:
1-11.
2. Tripathi, K.D., “Essentials of Medical
Pharmacology”, Jaypee Brothers
Medical Publications (P) Ltd., New Delhi, 2003; 5thEdn: 167-184.
3. YieW.Chien. “Concepts and System
Design for Rate-controlled Drug
Delivery”, Chapter 1 in “Novel Drug Delivery System”, Marcel Dekker, Inc New York, 1992; 2ndEdn: 1-42.
4. Yie W. Chien, “Rate-controlled Drug
Delivery Systems”. Indian J. Pharm.Sci., 1988; Mar-April: 63-65.
5. Thomas Wai-Yip Lee and Joseph R.
Robinson, “Controlled Release Drug-Delivery Systems”, Chapter 47 in “Remington’s Pharmaceutical Sciences”, Mack Publishing Company, Volume I, 2000; 20thEdn: 903-929.
6. Edith, M. And Mark, R.K.,
“Microencapsulation” in “Encyclopedia of Controlled Release”, John Wiley and Sons, Inc. London, Vol-2, 1998; 493-510.
7. Chowdary, K.P.R. and Sri Ram Murthy,
A., “Microencapsulation in Pharmacy”. Indian Drugs, 1998; 25(10): 389-402.
8. Simon Bonita, “A survey of
Microencapsulation process” chapter 1 in ‘Microencapsulation, Method and Industrial Application’, Marcel Dekker, Inc. New York, 1987; 2ndEdn: 2-5.
9. Patrick B. Deasy, “Microencapsulation
and Related Drug Processes”, Chapter 1 in ‘Drug and the Pharmaceutical Sciences’, James Swarbrick, Marcel Dekker Inc, New York, Volume 20, 1984; 2ndEdn: 1-13.
10. Roland B. And Ornalakson P., “Spherical
Agglomerates of Water Insoluble
594
11. Rajesh, K.S., Khanrah, A. And
BiswanathSa, “Release of Ketoprofen from Alginate Microparticle Containing Film Forming Polymer”. J. Sci. Ind. Res., 2003; 62(10): 987.
12. “Indian Pharmacopeia” 1996, Ministry
of Health and Family Welfare,
Government of India, New Delhi, Volume-I; 5-43.
13. Udupa N. And Seetharaju G.,
“Spectrophotometric Method of
Analysis for Flurbiprofen in Tablets, Plasma and urine Samples”. Indian Drugs, 1989; 26(10): 585-587.
14. Indian Pharmacopeia” 1996, Ministry of
Health and Family Welfare, Government of India, New Delhi, Volume-I; 328.
15. Manna A., Ghosh I., Goswami N., Ghosh L.K. and Gupta B.K., “Design and Evaluation of an Oral Controlled Release Microparticulate Drug Delivery System of NImesulide by Ionotropic Gelation Technique and Statistical Optimization by Factorial Analysis”. J. Sci. Ind. Res., 1999; 58(9): 717-722.
16. Kumar V., Damien B. And Potdar A.R., “Designing of stability programme”. The Eastern Pharmacist, 1992; 8: 29-32.
17. Banker G.S. and Andearson N.R. “Kinetic