Analysis Of Mutual Fund Investment Portfolio By
Bank Central Asia Pension Fund
(2-Stage Data Envelopment Analysis Approach)
Ekhsanor Effendi, Hakiman Thamrin
Mercu Buana University, Magister Management, Jakarta, Indonesia, +62218449635
e.effendi@gmail.com
Mercu Buana University, Magister Management, Jakarta, Indonesia, +622131935454
hakiman.thamrin@mercubuana.ac.id
Abstract: This study aims to analyze the level of efficiency of each mutual fund product chosen by Bank Central Asia Pension Fund by using the 2-Stage Data Envelopment Analysis (DEA) method. The data used in this study are secondary data which are quantitative data expressed in numbers. The population in this study were 19 mutual fund products chosen by the BCA Pension Fund (DPBCA), with a sample of historical data for 3 years starting from January 1 2015 to December 31, 2017. The results of the analysis show that of the 19 mutual fund products selected by the DPBCA, there were 11 prod-ucts which received an efficiency score of 1.0 or in the efficient category. Furthermore, an efficient mutual fund product ranking is conducted using ratings from Infovesta, Bareksa and Morningstar to obtain an optimal portfolio.
Keywords:Portfolio analysis, mutual fund, pension fund, data envelopment analysis.
1.
Introduction
Retirement is a natural process of change in one's life. However, it turns out that not everyone is ready to face retirement. Not all employees know how to prepare for retirement well. Though retirement preparation cannot be done in a short time.
The Government through Law Number 24 of 2011 concerning the Social Security Organizing Body (BPJS) requires employers to register their workers with BPJS Employment in accordance with the social security program that is followed. In the Act it was stated that BPJS Employment organizes work accident insurance programs, old age insurance, pension benefits, and life insurance. The BPJS Employment Program is basically to improve the welfare of workers in retirement, when not working anymore. Because a retiree must meet a Retirement Income Level (TPP) or a proper Replacement Ratio of 70% - 80% of the last income. However, the contributions from BPJS Employment if reviewed only meet the TPP needs of 25% (Association of Financial Institution Pension Funds, 2015). This means there is still a shortage of TPPs of 45% - 55% so that a pensioner can live well in his old age. To help fill the TPP gap, many companies formed employee pension fund managers in their respective companies, commonly referred to as Pension Funds.
According to Article 1 Paragraph 1 of the Law of the Republic of Indonesia No. 11 of 1992, Pension Funds are legal entities that manage and run programs that promise retirement benefits. Whereas Pension Benefits are periodic payments paid to participants in the manner specified in the Pension Fund Regulations. Thus, the Pension Fund is an entity that collects funds from participants, manages and fulfills obligations to participants when the participant's pension benefits are due.
The Pension Fund industry for the past 5 years continues to grow and shows its role in the Indonesian economy. The growth indicator of the Pension Fund industry, among others, can be seen from the continued growth of assets (Figure 1).
Source : Otoritas Jasa Keuangan (2018)
Figure 1 : Growth of Pension Assets in 2013 until 2017 (IDR trillion)
BCA Pension Fund (DPBCA) is an Employer Pension Fund (DPPK) which was established by PT. Bank Central Asia Tbk, and the pension program that it runs is the Defined Contribution Pension Program (PPIP). As of the end of 2017, DPBCA assets are recorded at Rp. 4.65 trillion with 24,262 participants. DPBCA has the obligation to maintain sufficient funding for pension plans for all its members. DPBCA is also required to be able to invest funds received so as to provide optimal returns.
Based on data from 2013-2017, the results of the DPBCA investment effort did not show a consistent positive trend (Figure 2). In 2015 it had decreased from Rp. 254.8 billion (2014) to Rp. 218.34 billion (2015).
164.44 192.90
206.51 234.47
259.47
Source : DPBCA (2018)
Figure 2 : DPBCA Business Results Trend for 2013-2017 (IDR billion)
DPBCA investment assets are quite large, which is Rp. 4.06 trillion of the total assets of Rp. 4.65 trillion (87%), making DPBCA as an investor must form an optimal investment portfolio. The DPBCA investment portfolio for the last 3 years (2015-2017) and the results are shown in Table 1. Based on Table 1, in the last 5 years the DPBCA investment returns on various instruments have indeed fluctuated, but on average show positive values. It's just that in 2015 there was a data anomaly, in which several investment instruments
showed a significant decline compared to the previous year (2014). Even mutual fund investment yields a high negative yield of -7.28%.
DPBCA in 2018 compiles the projection of investment composition and yield in 2018 compared to 2017 in Table 2. Mutual funds as a form of investment carried out by DPBCA at the end of 2017, the proportion is 7.06% of the total investment (Table 2) , with a yield of 4.00%. Based on estimates and directives from the Supervisory Board, in 2018 the proportion of mutual fund placements will decrease to 7.03%, but the expected yields will increase to 6.93%. The expected increase in returns coupled with a decrease in the proportion of mutual funds is certainly a challenge for DPBCA managers to be able to put their mutual investment assets in the right investment managers.
Another challenge is that when compared to the average yields of 2017 national mutual funds, the total return on mutual fund products chosen by DPBCA is still quite far compared, namely 4.00% vs. 8.99%. Especially when compared to the JCI 2017, the comparison value is even further, which is 4.00% vs. 19.99%.
Based on this, it is necessary to analyze the level of efficiency of investment performance of each mutual fund product chosen by the DPBCA.
Table 1 : Return of DPBCA Investment Portfolio (2013-2017)
Type of Investment 2013 2014 2015 2016 2017
Government Securities 18,20% 22,60% 9,59% 11,10% 8,16%
Deposito On Call 18,79% 12,30% 1,23% 2,92% 6,00%
Time deposit 6,72% 9,66% 9,13% 9,04% 8,63%
Stock 4,40% 21,21% 4,29% 12,94% 11,07%
Corporate Bonds 7,09% 12,46% 4,25% 9,59% 7,35%
Mutual Funds 0,97% 14,80% -7,28% 0,98% 4,00%
KIK EBA -0,08% -1,05% -1,54% 9,78% 9,50%
Equity Participation - - - 6,89% 8,53%
Land and Buildings 7,28% 2,52% 1,35% 2,50% 2,02%
Source : DPBCA (2018)
Table 2. : Projections of Composition and Investment Results in 2018 compared to 2017
Type of Investment Investment Composition Investment Results Average 2017 Target 2018 Industry Target 2018 Industri
Government Securities 24,25% 26,23% 8,16% 7,48% 6,59%
Deposito On Call 0,14% 0,20% 6,00% 4,50% 5,70%
Time deposit 16,71% 17,68% 8,63% 6,75% 5,70%
Stock 9,63% 8,30% 11,07% 6,80% 19,99%
Corporate Bonds for SBN 13,26% 8,49% 7,35% 9,17% 11,30%
SBN 4,48% 7,89% -
Mutual Funds 7,06% 7,03% 4,00% 6,93% 8,99%
KIK EBA 0,69% 9,50% -
EBA 0,07% 0,09% -
EBA for SBN 0,31% 0,09% -
Equity Participation 8,78% 9,03% 8,53% 14,14% -
Land and Buildings 19,51% 18,17% 2,02% 5,01% -
Source : DPBCA (2018)
248.51 254.80
218.34
247.20 266.71
2.
Literature Review
Data Envelopment Analysis (DEA) was first introduced by A. Charnes, W. W. Cooper and E. Rhodes, in his article "Measuring The Efficiency of Decision Making Unit" in the European Journal of Operational Research. The journal discusses the development of efficiency decision-making steps that can be used in evaluating Decision-Making Units [1].
DEA is a linear programming based technique to evaluate the relative efficiency of the Decision Making Unit (DMU), by comparing between one DMU and another DMU that utilizes the same resources to produce the same output [2], where the solution of the model indicates the productivity or efficiency of a unit with other units [3]. The ultimate goal of the DEA is intended as a method for performance evaluation and benchmarking [4].
The relative efficiency of DMU is measured by estimating the output weight ratio for an input and comparing it with other DMUs. DMUs that achieve 100% efficiency are considered efficient while DMUs with values below 100% and comparing relative to other DMUs are considered inefficient. DEA identifies an efficient set of DMU and is used as a benchmark for improving inefficient DMU. DEA also allows calculating the amount needed for improvements in the input and output of the DMU to be efficient [5]. In principle, the process of managing an investment product starts with the input on the investment product. The input variables that have been entered are then managed according to the characteristics of the investment product, to ultimately produce certain output variables. Based on the process of managing the investment product, an investment product can be assessed for its performance and performance through observation and research on its input and output.
DEA was developed as a model in measuring the level of performance or productivity of a group of organizational units. Measurements are made to determine the possibilities of using resources that can be done to produce optimal output. The productivity evaluated is intended to be a number of savings that can be done on resource factors (input) without having to reduce the amount of output produced, or from the other side increasing output that might be produced without the need for additional resources [6]. The basic formula for measuring technical efficiency ratios that form the basis of DEA development is as follows:
DEA is the enhancement of linear programming based on the technique of measuring the relative performance of a group of input and output units. DEA is a procedure specifically designed to measure the relative efficiency of a DMU that uses many inputs and outputs. In the DEA model, the relative efficiency of DMU is defined as the ratio of total weighted output divided by its weighted total inputs [7]. This is translated into the formula:
∑ ∑
The core of the DEA is determining weights for each DMU input and output. The weight has a non-negative value and is universal, meaning that every DMU in the sample must be able to use the same set of weights to evaluate the ratio (total weighted output / total weighted input) and the ratio cannot be more than one (total weighted output / total weighted input ≤ 1). The DEA assumes that each DMU will choose a weight that maximizes its efficiency ratio (maximizing total weighted output / total weighted input). Because each DMU uses a different combination of inputs to produce different output combinations, each DMU will choose a set of weights that reflect that diversity. These weights are not economic values of input and output, but rather as determinants of maximizing the efficiency of a DMU [7].
There are two main types of DEA models, namely the CCR model (Charnes-Cooper-Rhodes) introduced by Charnes et al. [1] and the BCC (Banker-Charnes-Cooper) model developed by Banker et al. [8].
The CCR model is a model based on the assumption of constant return to scale so that it is also known as the CRS model. In the CCR model each DMU will be compared to all DMUs in the sample, assuming that the internal and external conditions of the DMU are the same and operate on an optimal scale. The efficiency measure for each DMU is the maximum ratio between weighted output and weighted inputs. Each weight value used in the ratio is determined by the limitation that the same ratio for each DMU must have a value that is less than or equal to one [1]. The CCR model is written as follows:
∑
∑
∑
∑
j=1, ..., n ; ur, vi ≥ 0 ; r=1, ..., s ; i=1, ..., m.
where :
n = number of DMU s = number of output m = number of input u = output weight
v = input weight y = output
x = input.
The CRS assumption is only suitable if all companies operate on an optimal scale. Imperfect competition, financial constraints and so on, may cause a company not to operate at an optimal scale. Banker et al. [8] advocated an extension of the CRS model by applying VRS calculations (variable returns to scale), where increases in input and output do not have the same proportions. Increasing proportions can be increased return to scale (IRS) or can be a decreasing return to scale (DRS).
In the BCC model, one new variable is added, namely û0, to
estimate economies of scale. If the value of û0= 0, then h0
will be the same as CCR modeling. If û0<0, then the DMU
operates in decreasing returns to scale, and if û0> 0, then the
of inputs, while DMUs that operate with a state of decreasing
return to scale will experience increased output with smaller proportions than the addition of inputs.
Banker et al. [8] formulated the BCC as follows :
∑
∑
∑
∑
j=1, ..., n ; ur, vi ≥ 0 ; r=1, ..., s ; i=1, ..., m ;
where :
n = number of DMU s = number of output m = number of input u = output weight
v = input weight y = output
x = input.
The DEA 2-Stage Model was first introduced by Seiford & Zhu [9] to measure profitability and marketability of commercial banks in the United States. In the first stage (stage) the profitability efficiency value is calculated using human resources and assets as inputs, with outputs of profit and revenue. In the second stage the efficiency of marketability is calculated by using profit and revenue as input, and market value, returns and earnings per share as output (Figure 3).
Premachandra et al. in 2012 [10] applied a 2-Stage DEA to measure the performance of mutual funds in the United States. According to Premachandra et al. [10] the total efficiency of mutual funds is decomposed into two components, namely operational management efficiency and portfolio management efficiency. Thus, to measure the performance of mutual funds is divided into 2 stages, namely the operational management stage and portfolio management stage.
Using the basic BBC DEA formula (VRS), according to Premachandra et al. [10] for 2-Stage DEA formulated to be: Stage 1 :
∑
∑
∑
∑
j=1, .., n ; ƞ1
d, v1i ≥ 0 ; d=1, .., t ; i1=1, .., m;
Stage 2 :
∑
∑ ∑
∑
∑ ∑
j=1, ..., n ; ƞ2
d, v2i ≥ 0 ; r=1, ..., s ; d=1, ..., t ; i2=1, ..., m ;
where :
n = number of DMU s = number of output
t = number of intermediate m = number of input
u = output weight ƞ = intermediate weight v = input weight y = output
z = intermediate x = input.
Overall efficiency :
(
∑
∑
)
(
∑
∑ ∑
)
s.t w1 + w2 = 1
where :
w = user-specified weight.
Since it was first used by Murthi, Choi and Desai in 1997 [11], it agreed that the DEA model for measuring the performance of mutual funds is more widely used in various studies abroad, including: in the United States by Lin & Chen [12], Premachandra et al. [10], Galagedera et al. [13], Baghdadabad & Houshyar [14], in the European Union by Basso & Funari [15], in Greece by Alexakis & Tsolas [16] and Pendaraki [17], in Sweden by Gardijan & Krišto [18], in Turkey by Gökgöz & Çandarli [19], in China by Guo et al. [20], in India by Afshan [21] and in Malaysia by Shari et al. [22]. While in Indonesia, there are still few studies that use DEA to measure the performance of mutual funds, here are Hadinata & Manurung [6], Indiastuti [23], and Hardhani [24].
DEA implementation to measure mutual fund performance / efficiency in various countries mostly still uses standard CCR and BCC models. DEA's 2-Stage model is still rarely used for measuring the performance of mutual funds, of which those that have been used are Premachandra et al. [10] and Galagedera et al. [13].
In general, Nguyen (2014) states that the 2-Stage DEA
model has advantages in evaluating operating performance compared to the DEA 1-Stage model. The DEA 2-Stage model is highly recommended to be used if managers and decision makers want to have a better understanding of profitability and market assessment of their company.
Based on the literature review and the results of previous studies, the description of the framework of the research problems, theories and relationships between variables is presented in Figure 4.
Source : Seiford & Zhu (1999)
Figure 3 : Application of a DEA 2-Stage at a Bank
input
intermediate variable
output
input
x
1jx
2jz
jy
jSTAGE 1
STAGE 2
Source : Seiford & Zhu (1999)
3.
Methodology
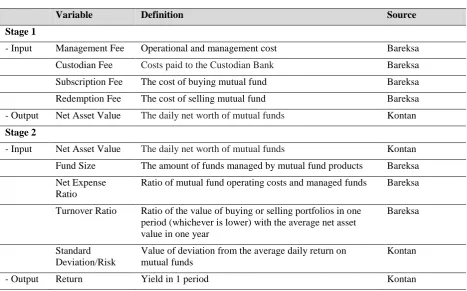
There is no consensus between researchers and investors regarding what input and output variables should be included in the DEA model. This study will refer to Premachandra et al. (2012) which uses 7 input variables and 2 output variables for 2 stages of the DEA model. In the first stage, namely the operational management stage, input variables are used: management fees and marketing and distribution fees, with output variables in the form of net asset value. In the next stage, namely the portfolio management stage, the input variables are: net asset value (the output variable in the first stage becomes the intermediate variable in the second stage), fund size, net expense ratio, turnover ratio and standard deviation, with the output variable in the form of return. In this study the management fee variable is the sum of 2 variables, namely management fee and custodian fee. Similarly, marketing and distribution fees are the sum of 2 variables, namely subscription fees and redemption fees. The definition of each variable is explained in Table 3.
Fund Size Variables, Management Fee, Custodian Fee, Subscription Fee, Redemption Fee, Net Expense Ratio, Turnover Ratio and Net Asset Value data are taken directly from each of the Bareksa and Kontan websites, while Standard Deviation and Return variables are calculated using the following formula:
Standard Deviation :
√
∑ ( ̅)where :
= return period i ̅ = average return
n = number of data
Return :
where :
= return period i
= net asset value per unit on period
i
= net asset value per unit on previous period.
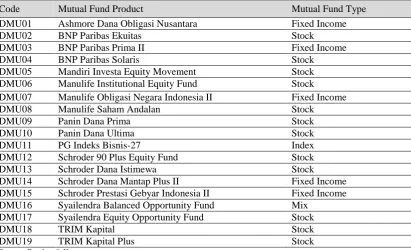
The population in this study are mutual fund products chosen by the BCA Pension Fund for 3 years starting from January 1, 2015 to December 31, 2017 (Table 4).
Of the 28 samples of DPBCA selected mutual funds, there are 9 mutual fund products that are not complete, so they are excluded from the population : BNP Paribas Pesona, Dana Ekuitas Andalan, Kehati Lestari, Kresna Indeks 45, Makara Prima, Mandiri Investa Ekuitas Dinamis, Manulife Saham SMC Plus, Pratama Saham, and Pratama Syariah. So that the total sample data is 19 mutual fund products (Table 5).
Table 3 : Variable definition
Variable Definition Source
Stage 1
- Input Management Fee Operational and management cost Bareksa
Custodian Fee Costs paid to the Custodian Bank Bareksa
Subscription Fee The cost of buying mutual fund Bareksa
Redemption Fee The cost of selling mutual fund Bareksa
- Output Net Asset Value The daily net worth of mutual funds Kontan Stage 2
- Input Net Asset Value The daily net worth of mutual funds Kontan Fund Size The amount of funds managed by mutual fund products Bareksa Net Expense
Ratio
Ratio of mutual fund operating costs and managed funds Bareksa
Turnover Ratio Ratio of the value of buying or selling portfolios in one period (whichever is lower) with the average net asset value in one year
Bareksa
Standard Deviation/Risk
Value of deviation from the average daily return on mutual funds
Kontan
- Output Return Yield in 1 period Kontan
Table 4 : DPBCA’s Mutual Funds Portfolio (2015-2017)
Mutual Fund Product Investment Composition Investment Manager
1 Ashmore Dana Obligasi Nusantara 1,45% P. T. Ashmore Asset Mgmt. 2 BNP Paribas Ekuitas 4,35% P. T. BNP Paribas Invstmt. Partners 3 BNP Paribas Pesona 4,35% P. T. BNP Paribas Invstmt. Partners 4 BNP Paribas Prima II 2,90% P. T. BNP Paribas Invstmt. Partners 5 BNP Paribas Solaris 2,90% P. T. BNP Paribas Invstmt. Partners 6 Dana Ekuitas Andalan 2,18% P. T. Bahana TCW Invstmt. Mgmt. 7 Kresna Indeks 45 2,90% P. T. Kresna Graha Investama Tbk. 8 Kehati Lestari 5,80% P. T. Bahana TCW Invstmt.Mgmt. 9 Makara Prima 2,90% P. T. Bahana TCW Invstmt.Mgmt. 10 Mandiri Investa Ekuitas Dinamis 4,35% P. T. Mandiri Mjmn. Investasi 11 Mandiri Investa Equity Movement 1,45% P. T. Mandiri Mjmn. Investasi 12 Manulife Institutional Equity Fund 3,63% P. T. Manulife Aset Manajemen 13 Manulife Obligasi Negara Indonesia II 2,90% P. T. Manulife Aset Manajemen 14 Manulife Saham Andalan 1,42% P. T. Manulife Aset Manajemen 15 Manulife Saham SMC Plus 1,45% P. T. Manulife Aset Manajemen 16 Panin Dana Prima 2,17% P. T. Panin Asset Mgmt. 17 Panin Dana Ultima 3,62% P. T. Panin Asset Mgmt. 18 PG Indeks Bisnis-27 0,15% P. T. PG Asset Mgmt.
19 Pratama Saham 10,28% P. T. Pratama Capital Assets Mgmt 20 Pratama Syariah 1,45% P. T. Pratama Capital Assets Mgmt. 21 Schroder 90 Plus Equity Fund 2,90% P.T. Schroder Invstmt. Mgmt. 22 Schroder Dana Istimewa 7,25% P.T. Schroder Invstmt. Mgmt. 23 Schroder Dana Mantap Plus II 7,25% P.T. Schroder Invstmt. Mgmt. 24 Schroder Prestasi Gebyar Indonesia II 2,03% P.T. Schroder Invstmt. Mgmt. 25 Syailendra Balanced Opportunity Fund 4,35% P. T. Syailendra Capital 26 Syailendra Equity Opportunity Fund 5,62% P. T. Syailendra Capital 27 Trim Kapital 4,35% P. T. Trimegah Asset Mgmt. 28 Trim Kapital Plus 3,63% P. T. Trimegah Asset Mgmt. Source : DPBCA (2018)
Table 5 : Mutual Fund Research Samples
Code Mutual Fund Product Mutual Fund Type
DMU01 Ashmore Dana Obligasi Nusantara Fixed Income
DMU02 BNP Paribas Ekuitas Stock
DMU03 BNP Paribas Prima II Fixed Income
DMU04 BNP Paribas Solaris Stock
DMU05 Mandiri Investa Equity Movement Stock
DMU06 Manulife Institutional Equity Fund Stock
DMU07 Manulife Obligasi Negara Indonesia II Fixed Income
DMU08 Manulife Saham Andalan Stock
DMU09 Panin Dana Prima Stock
DMU10 Panin Dana Ultima Stock
DMU11 PG Indeks Bisnis-27 Index
DMU12 Schroder 90 Plus Equity Fund Stock
DMU13 Schroder Dana Istimewa Stock
DMU14 Schroder Dana Mantap Plus II Fixed Income
DMU15 Schroder Prestasi Gebyar Indonesia II Fixed Income
DMU16 Syailendra Balanced Opportunity Fund Mix
DMU17 Syailendra Equity Opportunity Fund Stock
DMU18 TRIM Kapital Stock
DMU19 TRIM Kapital Plus Stock
Source : Bareksa & Kontan
The analytical method used in this study is the DEA method introduced by Charnes, et al. (1978). The Data Envelopment Analysis (DEA) method is created as a tool for evaluating the performance of an activity in an entity unit (organization). Basically the DEA model work principle is to compare input and output data from a data organization (decision making unit / DMU) with other input and output
data on all similar DMUs. This comparison is done to get a value of efficiency.
Source : Premachandra et al. (2012)
Figure 5 : Model 2-Stage Data Envelopment Analysis
With the assumption that not all mutual fund companies / managers operate on an optimal scale due to imperfect competition, financial constraints and so on, the DEA model used in this study is DEA VRS (Banker et al., 1984). The VRS model is transformed into a 2-Stage model so that the overall efficiency formula becomes:
(
∑
∑
)
(
∑
∑ ∑
)
where :
n = number of DMU s = number of output
t = number of intermediate m = number of input
u = output weight
ƞ = intermediate weight v = input weight y = output
z = intermediate x = input
w = user-specified weight.
In the DEA method, before data processing it is necessary to test the adequacy of the number of Decision Making Units (DMUs). According to Golany & Roll (in Cook, 2014), the number of DMUs from the units sampled is at least 2 times the sum of inputs and outputs. In this study the number of DMUs as many as 19 units of magnitude has exceeded the sum of 2 times the number of input variables (6 variables) and output (2 variables).
4.
Result and Discussion
Data from each variable at each stage of the analysis are presented in Table 6 and Table 7.
Table 6 : Operational Management Stage Data
DMU Code
Management Fee (%)
Custodian Fee (%)
Subscription Fee (%)
Redemption Fee (%)
Net Asset Value (IDR billion)
DMU01 1,50 0,25 2,00 1,00 1.343,79
DMU02 2,50 0,25 3,00 1,00 19.538,95
DMU03 2,00 0,25 2,00 1,00 2.298,58
DMU04 2,50 0,25 2,00 2,00 2.208,62
DMU05 3,00 0,15 3,00 1,00 1.127,11
DMU06 1,50 0,25 2,00 2,00 1.362,42
DMU07 2,50 0,25 2,00 2,00 2.083,89
DMU08 2,50 0,25 2,00 2,00 2.020,36
DMU09 3,00 0,20 4,00 1,00 3.624,03
DMU10 3,00 0,20 4,00 0,50 1.075,63
DMU11 2,00 0,25 1,00 1,00 1.474,26
DMU12 2,50 0,25 0,00 1,00 7.301,20
DMU13 1,25 0,25 1,00 1,00 2.486,46
DMU14 1,00 0,20 1,00 1,00 2.422,77
DMU15 2,50 0,25 2,00 1,00 2.228,73
DMU16 2,50 0,15 1,00 2,00 2.583,82
DMU17 5,00 0,15 1,00 2,00 3.902,35
DMU18 5,00 0,20 0,00 2,00 9.917,98
DMU19 5,00 0,20 0,00 2,00 3.242,28
Table 7 : Portfolio Management Stage Data
DMU Code Fund Size
(IDR billion)
Net Expense Ratio (%)
Turnover Ratio (%)
Risk (%)
Return (%)
DMU01 2.505,50 2,08 1,30 0,27 13,65
DMU02 7.188,60 2,87 0,51 0,60 16,82
DMU03 1.421,87 1,89 0,72 0,21 13,74
DMU04 517,48 3,04 0,82 0,54 10,70
DMU05 421,26 3,15 4,12 0,61 12,14
DMU06 313,81 1,80 0,29 0,62 12,30
DMU07 1.545,68 2,34 1,86 0,22 15,53
DMU08 461,49 2,98 0,33 0,61 8,96
DMU09 661,56 4,64 1,37 0,59 12,15
DMU10 466,45 4,85 0,93 0,57 4,79
DMU11 4.036,32 3,55 0,64 0,73 20,71
DMU12 4.772,46 1,83 1,13 0,62 7,34
DMU13 1.430,00 1,51 0,82 0,22 13,36
DMU14 321,70 1,36 0,14 0,19 12,82
DMU15 2.584,50 2,43 0,23 0,63 15,09
DMU16 41,01 3,29 1,44 0,49 17,37
DMU17 522,21 4,23 1,32 0,63 19,91
DMU18 527,45 5,44 0,99 0,62 15,46
DMU19 119,78 5,50 1,02 0,62 10,75
Source : Bareksa & Kontan
Based on the two table, then descriptive statistical tests are conducted which aim to provide a statistical description or description of the data seen from the minimum value, maximum value, value average and standard deviation of
each variable.
The results of the descriptive statistical tests performed on input and output variables are in Table 8.
Table 8 : Descriptive statistics of Input and Output Variable
Variable Minimum Maximum Means Std. Dev.
Management Fee 1,20 5,20 2,89 1,16
Marketing and Distribution Fee 1,00 5,00 3,13 1,08
Net Asset Value 1.075,63 19.538,95 4.398,07 7.104,07
Fund Size 41,01 7,147,58 1,571,53 1,904,89
Net Expense Ratio 1,36 5,50 3,09 1,30
Turn Over Ratio 0,14 4,12 1,05 0,87
Risk 0,19 0,73 0,51 0,18
Return 4,79 20,71 13,35 3,98
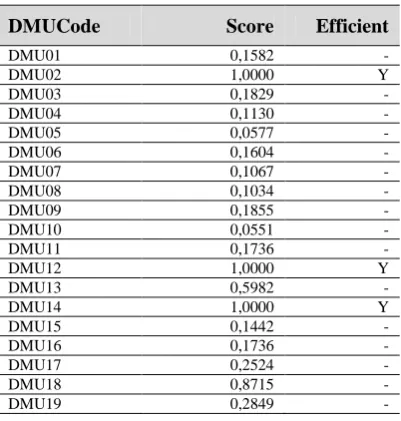
The efficiency value in this study was obtained from the results of processing the DEA 2-Stage model using the OSDEA software. A DMU is considered efficient if the ratio of output to input is equal to 100% or 1.0000. If the value is below 1.0000 then a DMU is considered inefficient.
Of the 19 mutual funds analyzed, there were only 3 mutual funds (DMU02, DMU12, DMU14) which scored an efficiency of 1.0000 or were in the efficient category, compared to 16 other mutual funds. The mutual funds included in the efficient category are BNP Paribas Equity, Schroder Dana Istimewa and Schroder Achievement Indonesia Gebyar II (Table 9.).
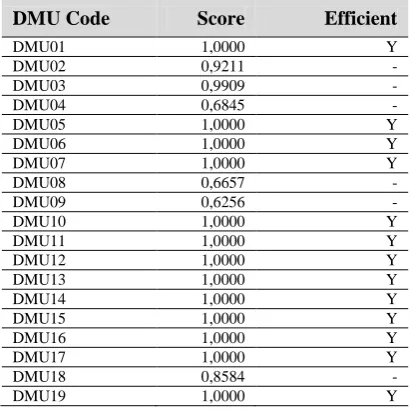
The results of the analysis at the portfolio management stage, there are 13 mutual funds (DMU01, DMU05, DMU06, DMU07, DMU10, DMU11, DMU12, DMU13, DMU14, DMU15, DMU16, DMU17, DMU19) which get an efficiency score of 1,000 or in the efficient category, compared to 6 other mutual funds. The mutual funds included in the efficient category are Ashmore Dana Nusantara Bonds, Mandiri Investa Equity Movement, Manulife Institutional Equity Fund, Manulife Indonesia State Bonds II, Panin Dana Ultima, PG Business-27 Index, Schroder Dana Istimewa, Schroder Dana Mantap Plus II,
Schroder Prestasi Gebyar Indonesia II, Schroder 90 Plus Equity Fund, Syailendra Balanced Opportunity Fund, Syailendra Equity Opportunity Fund, and TRIM Kapital Plus (Table 10).
Table 9 : Efficiency Score of Operational Management Stage
DMUCode Score Efficient
DMU01 0,1582 -
DMU02 1,0000 Y
DMU03 0,1829 -
DMU04 0,1130 -
DMU05 0,0577 -
DMU06 0,1604 -
DMU07 0,1067 -
DMU08 0,1034 -
DMU09 0,1855 -
DMU10 0,0551 -
DMU11 0,1736 -
DMU12 1,0000 Y
DMU13 0,5982 -
DMU14 1,0000 Y
DMU15 0,1442 -
DMU16 0,1736 -
DMU17 0,2524 -
DMU18 0,8715 -
Table 10 : Efficiency Score of Portfolio Management Stage
DMU Code Score Efficient
DMU01 1,0000 Y
DMU02 0,9211 -
DMU03 0,9909 -
DMU04 0,6845 -
DMU05 1,0000 Y
DMU06 1,0000 Y
DMU07 1,0000 Y
DMU08 0,6657 -
DMU09 0,6256 -
DMU10 1,0000 Y
DMU11 1,0000 Y
DMU12 1,0000 Y
DMU13 1,0000 Y
DMU14 1,0000 Y
DMU15 1,0000 Y
DMU16 1,0000 Y
DMU17 1,0000 Y
DMU18 0,8584 -
DMU19 1,0000 Y
The results of the overall efficiency calculation (Table 11) have 11 mutual funds (DMU02, DMU03, DMU05, DMU12, DMU13, DMU14, DMU15, DMU16, DMU17, DMU18, DMU19) which score an efficiency of 1.0000 or in the efficient category, compared to 8 other mutual funds. Mutual funds that include these efficient categories are: BNP Paribas Ekuitas, BNP Paribas Prima II, Mandiri Investa Equity Movement, Schroder Dana Istimewa, Schroder Dana Mantap Plus II, Schroder Prestasi Gebyar Indonesia II, Schroder 90 Plus Equity Fund, Syailendra Balanced Opportunity Fund, Syailendra Equity Opportunity Fund, TRIM Kapital, and TRIM Kapital Plus.
While other mutual funds that are not in the efficient category : Ashmore Dana Obligasi Nusantara, BNP Paribas Solaris, Manulife Institutional Equity Fund, Manulife Obligasi Negara Indonesia II, Manulife Saham Andalan,
Panin Dana Prima, Panin Dana Ultima, and PG Indeks Bisnis-27.
Table 11 : Overall Efficiency Score
DMU Code Score Efficient
DMU01 0,9360 -
DMU02 1,0000 Y
DMU03 1,0000 Y
DMU04 0,9910 -
DMU05 1,0000 Y
DMU06 0,6560 -
DMU07 0,7020 -
DMU08 0,9110 -
DMU09 0,6390 -
DMU10 0,6760 -
DMU11 0,2830 -
DMU12 1,0000 Y
DMU13 1,0000 Y
DMU14 1,0000 Y
DMU15 1,0000 Y
DMU16 1,0000 Y
DMU17 1,0000 Y
DMU18 1,0000 Y
DMU19 1,0000 Y
As a reference material for obtaining an optimal portfolio, the following is a list of selected mutual fund portfolio candidates with additional information from Bareksa, Infovesta and Morningstar (Table 12).
Based on the data in Table 12, out of 11 selected mutual funds the average has a 3 star rating and above. There are only 2 mutual funds that have a 2 star rating (according to Bareksa and Morningstar), namely BNP Paribas Ekuitas and Schroder Dana Istimewa. With reference to Morningstar, as a reference for international mutual fund investments, and Bareksa and Infovesta, as a reference for domestic mutual fund investments, out of the 11 selected mutual funds mutual funds ranking / ranking can be made to form an optimal portfolio.
Table 12 : Mutual Funds Rating
Mutual Fund Infovesta Bareksa Morningstar
BNP Paribas Ekuitas -
BNP Paribas Prima II
Mandiri Investa Equity Movement +
Schroder 90 Plus Equity Fund +
Schroder Dana Istimewa -
Schroder Dana Mantap Plus II
Schroder Prestasi Gebyar Indonesia II +
Syailendra Balanced Opportunity Fund
Syailendra Equity Opportunity Fund
TRIM Kapital +
TRIM Kapital Plus +
5.
Conclusion
Based on the results of the analysis and discussion of selected Pension Fund products from the BCA Pension Fund using the 2-Stage Data Envelopment Analysis method, the following conclusions were obtained :
1) The results of data analysis, of the 19 samples of DPBCA's selected mutual fund products, there were 11 mutual funds which were included in the efficient category, while 8 other mutual funds were not included in the efficient category.
2) Based on ratings using ratings from Infovesta, Bareksa and Morningstar on 11 mutual funds which are included in the efficient category, there are 9 mutual funds that have a 3 star rating above and 2 mutual funds that have a star rating of 2. From this rating an optimal portfolio can be arranged, by placing 1 mutual fund with the highest rating on the highest priority portfolio choice and 2 mutual funds with the lowest rating at the lowest priority for optimal portfolio choice.
6.
Suggestion
Some suggestions can be given to related parties such as the management of the BCA Pension Fund and for further research:
1) For BCA Pension Funds, the results of the analysis in this study can be used as reference material to determine the optimal portfolio. The results of mutual fund product ratings can be used as a benchmark to determine the percentage of investment fund placements of each mutual fund product..
2) For future research, it is recommended to multiply the research sample by comparing the efficiency of the DPBCA selected mutual fund products to all existing mutual fund products, and using longer historical data, for example 5 years..
References
[1] A. Charnes, W. W. Cooper and E. Rhodes, “Measuring The Efficiency of Decision Making Unit”, European Journal of Operational Research, 2 (6), pp. 429-444, 1978.
[2] P. F. Tsai and C. M. Molinero, “A Variable Returns to Scale Data Envelopment Analysis Model for the Joint Determination of Efficiencies with an Example of the UK Health service”, European Journal of Operational Research, 141, pp. 21–38, 2002.
[3] B. W. Taylor, Introduction to Management Science, 12th Edition, Pearson Education Limited, Essex, United Kingdom, 2016.
[4] W. D. Cook, K. Tone and J. Zhu, “Data Envelopment Analysis: Prior to Choosing a Model”, Omega : The International Journal of Management Science, 44, pp. 1–4, 2014.
[5] H. Lee and C. Kim, “A DEA-SERVQUAL Approach to Measurement and Benchmarking of Service Quality”, Procedia - Social and Behavioral Sciences, 40, pp. 756–762, 2012.
[6] I. Hadinata and A. H. Manurung, “Penerapan Data Envelopment Analysis (DEA) Untuk Mengukur Efisiensi Kinerja Reksa Dana Saham”, Jurnal Akuntansi FE Untar, 12 (1), pp. 1-25, 2008.
[7] Sunarto, Evaluasi Kinerja Kantor-Kantor Pelayanan Pajak Pratama di Pulau Jawa : Penerapan Data Envelopment Analysis (DEA), Master Tesis, Magister Perencanaan dan Kebijakan Publik, Universitas Indonesia, Jakarta, 2010.
[8] R. D. Banker, A. Charnes and W. W. Cooper, “Some Models for Estimating Technical and Scale Inefficiencies in Data Envelopment Analysis”, Management Science, 30 (9), pp. 1078-1092, 1984. [9] L. M. Seiford and J. Zhu, “Profitability and
Marketability of the Top 55 US Commercial Banks”, Management Science, 45 (9), pp. 1270–1288, 1999. [10] I. M. Premachandra, J. Zhu, J. Watson and D. U. A.
Galagedera, “Best-Performing US Mutual Fund Families from 1993 to 2008: Evidence from a Novel Two-Stage DEA Model for Efficiency Decomposition”, Journal of Banking & Finance, 36, pp. 3302–3317, 2012.
[11] B. P. S. Murthi, Y. K. Choi and P. Desai, “Efficiency of Mutual Funds and Portfolio Performance Measurement: A Non-Parametric Approach”. European Journal of Operational Research. 98 (2), pp. 408-418, 1997.
[12] R. Lin and Z. Chen, “New DEA Performance Evaluation Indices and Their Applications in The American Fund Market”, Asia-Pacific Journal of Operational Research, 25 (4), pp. 421–450, 2008. [13] D. U. A. Galagedera, J. Watson, I. M. Premachandra
and Y. Chen, “Modeling Leakage in Two-stage DEA Models: An Application to US Mutual Fund Families”, Omega : The International Journal of Management Science, 61, pp. 62-77, 2015.
[14] M. R. T. Baghdadabad and A. N. Houshyar, “Productivity and Efficiency Evaluation of US Mutual Funds”, Finance a úvěr - Czech Journal of Economics and Finance, 64, pp. 120-143, 2014.
[15] A. Basso and S. Funari, “The Role of Fund Size in The Performance of Mutual Funds Assessed with DEA Models”, The European Journal of Finance, 23 (6), pp. 457-473, 2016.
[16] P. Alexakis and I. Tsolas, “Appraisal of Mutual Equity Fund Performance Using Data Envelopment Analysis”, Multinational Finance Journal, 15 (3/4), pp. 273–296, 2011.
[18] M. Gardijan and J. Krišto, “Efficiency of Mutual
Funds in Croatia: a DEA-based Approach Applied in The Pre-Crisis, Crisis and Post-Crisis Period”, Croatian Operational Research Review, 8, pp. 77-92, 2017.
[19] F. Gökgöz and D. Çandarli, “Data Envelopment Analysis: A Comparative Efficiency Measurement for Turkish Pension and Mutual Funds”, International Journal of Economic Perspectives, 5 (3), pp. 261-281, 2011.
[20] J. Guo, C. Ma and Z. Zhou, “Performance Evaluation of Investment Funds with DEA and Higher Moments Characteristics: Financial Engineering Perspective”, Systems Engineering Procedia, 3, pp. 209–216, 2012. [21] N. Afshan, “Performance Evaluation of Mutual Funds
in India: DEA Approach”, Romanian Review of Social Sciences, 5, pp. 46-56, 2013.
[22] A. H. Shari, S. W. King, C. L. Shiang, L. S. Shen, N. Y. Kee, O. K. Soon, O. A. Yee, S. N. A. Wahab and N. S. Azman, “Performance of Malaysian Bond Funds: A DEA Approach”, Journal of Scientific Research and Development, 3 (5), pp. 194-199, 2016.
[23] F. Indiastuti, Evaluasi Terhadap Kinerja Reksa Dana Saham Dan Pembentukan Portofolio Optimal Pada Instrumen Reksa Dana Saham, Master Thesis, Program Magister Manajemen, Universitas Indonesia, Jakarta, 2008.
[24] R. Hardhani, Analisis Efisiensi Kinerja Reksadana Saham Dengan Metode Data Envelopment Analysis (DEA), Master Thesis, Magister Manajemen, Universitas Gadjah Mada, Yogyakarta, 2009.