http://www.sciencepublishinggroup.com/j/ijaos doi: 10.11648/j.ijaos.20200401.12
ISSN: 2640-1142 (Print); ISSN: 2640-1150 (Online)
Socio-Eco-efficiency Indictors Effect on Water
Consumption and Recycling Efficiency in Kombolecha,
Ethiopia
Tefera Eshete Kebede
1, Chipo Mukonza
2, Munyaradzi Chitakira
21
Department of Economics, Business and Economics College, Wollo University, Dessie, Ethiopia
2School of Ecology and Human Sustainability, Department of Environmental Science, University of South Africa, Florida Campus, Calabash Building, South Africa
Email address:
To cite this article:
Tefera Eshete Kebede, ChipoMukonza, MunyaradziChitakira. Socio-Eco-efficiency Indictors Effect on Water Consumption and Recycling Efficiency in Kombolecha, Ethiopia. International Journal of Atmospheric and Oceanic Sciences. Vol. 4, No. 1, 2020, pp. 7-19.
doi: 10.11648/j.ijaos.20200401.12
Received: July 28, 2019; Accepted: December 25, 2019; Published: January 9, 2020
Abstract:
Ethiopia is amongst agrarian economy but drought affected and rainfall dependent country in eastern Africa. Water consumption growth and green environmental problems were increasing parallel to factories production growth and population density rise in Kombolecha city. Consumers were used water resources for different purposes to attain their optimal social, economic and environmental aspects. However, consumer’s economic, social, and environmental indicators were disintegrated in the course of water consumption and recycling process. This study intended to determine the effect of socio-coefficient indicators on water consumption and recycling efficiency in Kombolecha. In doing so, this study employed instrumental variable model and two stages least square estimation that could be integrated the consumer’s social, economic and environmental indicators and built a socio-eco efficiency framework, which maintain water consumption and recycling efficiency in drought affected cities. In addition to this, propensity score matching estimation was used to evaluate the impacts of consumer’s poverty and consumption behaviours effect on water consumption and recycling efficiency. Accordingly, this study investigated that consumer’s water consumption behaviours were found different and varied across their production and consumption purposes in Kombolecha. For instance, factories were used different quantities of water along with their type of production. It was also computed that consumer’s social, economic and environmental aspects were associated with their water consumption and recycling processes. However, household’s consumption behavior and poverty level was negatively associated and affected the water consumption and recycling efficiency at the 5 percent significance level. In this study, nonetheless, rather than each separate indicator, the socio- eco efficiency framework, which consisted the three key indicators, were positively and statistically significant and influenced consumer’s water consumption and recycling efficiency in meeting green environment resilience. This study, thus, recommends that environment protection offices should be tactically integrated consumer’s social, economic and environmental indicators to build socio- eco efficiency that recover the green environment Kombolecha and at large in Ethiopia.Keywords:
Socio-Eco Efficiency, Recycling, Water Consumption, Indicators, Framework1. Introduction
Today, one third of the population in Africa is already living in drought-prone areas and 220 million are exposed to drought each year. African countries, particularly those in the
Horn of Africa have been identified as being the most vulnerable to the impact of climate change, particularly drought. In this region, the unpredictable, multi-faceted climates are classified amongst the most variable ones in the world and on seasonal and decadal time scales [1].
environmental tradeoffs of the earth are concerns of this study. Global environment faces some risky trends such as global warming, carbon emission, pollution, resources and energy problems, which result in people’s life threatening environmental consequences [2]. These environmental problems were resulted from disintegrated consumer’s economic, social, and environmental aspects during water consumption and recycling processes. Particularly, factories and household’s water consumption process were integrated and resulted adverse effect on green growth and environmental sustainability.
Since in 1996, the government of the Federal Democratic Republic of Ethiopia (FDRE) confirmed that Kombolcha city becomes the center of industrial zone [3]. Currently, in addition to fourteen existing factories, there are 220 licensed investors who received land and start to construct firm in Kombolecha Industrial Zone [4]. This industrial growth makes the city over urbanized and populated through increasing the resource consumption demand. As a result, the environment is crowded by dense population and factory’s production and consumption process. Hence, building resilience is, particularly, crucial in cities, agricultural land and industrial zones which are often the most impacted by humans and upon which society often depends [5]. In World Business Council Sustainable Development [6, 7] eco-efficiency [8] socio-eco eco-efficiency were not considered water consumption growth and resilient the depleted green environment in the rapidly growing cities in Ethiopia.
Resource use, particularly, the consumption and recycle efficiency impact on the environmental problem was considering in the factory’s production process (eco efficiency) in Kombolecha and elsewhere. This study, thus, attempted to integrate both household and factory’s water consumption and recycling efficiency. In addition to this, household’s social aspects, such as the green perception, behaviours, poverty status and cultures were incorporated to economic and environmental indicators, which are at most closely interlinked to recover the defining trends of green environment. To commence this investigation, this study shared the general interest of eco efficiency concept and indicator principles and socio-eco efficiency [9]. The household’s perception and behavioural inequality to adopt the green consumption and environment protection were measured followed Kuznets guidelines [10]. This study proposed indicators and the socio-eco efficiency framework would be affected the water consumption and recycling efficiency at altering social, economic, and environmental reasons in Kombolecha.
This study investigated the economic, social and environment indicators effect on the water consumption and recycling efficiency. It was assumed that each mentioned indicator has sub indicator. These Indicators have assumed a heterogeneous covariance due to the existence of instrument’s continuous variance. Instrumental variable model and two stage least square estimation techniques were used to test the heterogeneous covariance. This was due to the ordinary least square was violated its basic assumption
along with [11] criterion. This study recruited suitable instrumental variable model regression that would be applied a two stage least square estimation techniques to measure and identify the significant indicator’s effect on the water consumption and recycling efficiency and in turn resilient the green environment.
2. Problem Statement
Environmental deterioration is currently increased due to over-consumption and growth of natural resources utilization that result a depletion of stratospheric ozone layer, pollution of sea and rivers, noise and light pollution, acid rain and desertification [12]. Environmental problems are not new but they were varied between the household’s and factory’s consumption and recycling activities. The world has been on a course leading to resource depletion and serious social crises and old ways of problem-solving have proven inadequate [13]. However, many of the “green” types of challenges are found general phenomena and not necessarily specifically connected to urban space [14]. In particular, processes of an industrialisation affect ‘cities’ risk profiles with serious consequences [15]. Among many challenges, for instance, the brown environmental problems, pollution and disease multiplying are prevalent in cities [16]. It was argued that there is no time like the present for all the stakeholders to go green [17]. This argument is opposed to what distinguish today’s environmental threats from the past is the incredible interconnection of individual activities and life sustainability with in social, environment and economical interactions [18].
Compared to these three dimensions, social aspects present special problems due to their highly diverse and weight differently across interest groups and regions [19]. Hence, the base indicators on social impact assessment, which relate to resource extraction, processing, use, recycling, disposal and others [21]. However, in least developing countries (LDCs), firm and people are uniquely in a hurry to buy technology during production and consumption process while they are poor [22]. Ethiopia wants to avoid the traps of business-as-usual development to ensure the green economy growth and environmental resilience. In this study, environment resilience is describing in the context of restoring the green nature via balancing the water resource consumption growth and environmental problems. As like other developing countries, Ethiopia, nonetheless, faced a dual challenge in achieving its development goals, green economy growth and recovering the depleted environment [23].
less recycle and excess waste discharges and etc., which resulted negative externalities on the household’s living and working condition.
Previous studies, such as [26-31] and etc. eco efficiency analysis could not build a unified social, economic and environmental indicator on resource consumption patterns. Besides, none of these studies has clearly shown the path to interlink people social aspects with industrial water resource consumption and recycling patterns, which is a key ingredient to keep the green environment. This shows that there is a need of wider studies about water consumption and recycling processes to recover the green environment, which merges the social aspects into economic activity and environmental damage, with a drive force of perception change, consumption behaviour and ethical motives of people [32]. Protecting ecosystems and biodiversity is, therefore, central to building the resilience of the world’s poorest people, in both rural and urban areas, and to ensuring the provision of clean water, productive soils for food, and protection from natural hazards [33]. However, Ethiopia economy, which relied on the vast agriculture sector, is depending on variable rainfall and triggered by continuous drought.
This study, therefore, extended eco efficiency concepts into socio-eco efficiency framework by integrating the household’s social indicators (water consumption culture, behaviours, poverty and etc.) into an economic (monthly income) and environmental indicators (water quantity limits and waste recycles) in the water resource consumption and recycling processes. Moreover, this study aimed to build a unified socio- eco efficiency framework and evaluated its impact on the water consumption and recycling process that met the green environmental problems in Kombolecha, and large in Ethiopia.
3. Objectives
This study general objective was determining the socio- eco efficiency indicators effect on water consumption and recycling efficiency in Kombolecha, Ethiopia. In addition to this,
3.1. Specific Objectives
This study specific objective intended to:
1. Identify significant social, economic and environmental indicators effect on consumer’s water consumption and recycling efficiency.
2. Evaluated the socio-eco efficiency impacts to balance the extent of balancing water consumption and recycling efficiency.
3. Determined household poverty and consumption behaviours effect on water consumption and recycling efficiency.
3.2. Research Questions
In order to address the objectives mentioned so far, this
study research questions includes:
1. What are the major significant social, economic and environmental indicators that affect water consumption and recycling efficiency in Kombolecha?
2. What would be the impact of socio-eco efficiency indicators on water consumption and recycling efficiency?
3. What would be the effect of household poverty and consumption behaviours on their water consumption and recycling efficiency?
4. Significance
Ethiopia is rainfall dependent and drought affected eastern African countries. Despite industrialization is at infant stage, agriculture and factories areas, still, faced water shortages in growing industrial cities like Kombolecha. This study would be used as an input for policy makers, researchers and academic institution for further research and investigation, where water resource will be paramountly affected factories production, urban residents, and the major agriculture production.
5. Methodology
Relevant information concerning the household’s social (poverty status, behaviours and culture); economic (monthly income) and environmental aspects (water quantity and waste recycle) were keenly collected to integrate the three key indicators and determine the significant socio-eco efficiency indicators effect on water resource consumption and recycling processes. In pursuit of this, 338 sample households, who consumed water resources, were participated during data collection. Moreover, data were gathered purposively from 14 factories, which are consumed water resources [34]. In this regard, factory’s production managers were purposively sampled respondents. Based on consumer’s (both household’s and factories) water consumption and types of production, the researcher classified them into six sectoral categories: cloth and garment produces, beer and soft drink, metal and steel, leather and related product, food and related processing, manufacturing and others sectors. Factory managers were presented as a sample and hence counted as 14 respondents. Based on Kombolecha municipality and investment profile report (2013), this study, thus, took all factories, such as two factories from cloth and garment producer company, one beer factor, two metal and steel producer, one leather and related, three food and related processing factories, two manufacturing and other three factories were sampled and taken to collect the primary data.
survey instrument. Consistent with the proposed questionnaires, the descriptive survey methods were constructed and undertaken so that correlation levels or strength of relationships between variables such as level of green environment and socio- eco efficiency indicators were assessed, characterized and quantified.
In doing so, this study generated a list of indicators in a questionnaire and respondents determined how each indicator criterion weighted on water and waste consumption process. Based on indicator criterion, the selection grid should have a scoring system for ranking the indicators. The weighted voting can be a simple Yes or No to a numerical rating system. Many numerical systems are possible such as (1-5) and (1-10). The larger number or "YES" was represented a desirable rating. In some cases, large number may mean "less", for example cost of water or waste removals. In order to set scoring, the researcher asked every sample household to score each indicator against the criteria. Respondents completed the questionnaires to evaluate how well the economic, social and environmental indicators were pertinent to resolve the consumption and recycle inefficiency problems. The average score from each respondent were taken. Finally, total and average score were computed and summed based on the respondent’s scoring result.
Accordingly, this study used the highest ranked economic, social, and environmental indicators to gather information from the household and factory’s water consumption and waste recycles. For instance, monthly income, poverty status and culture and quantity of water were high ranked indicators among economic, social and environmental indicators. These indicators defined as the effect of household and factory’s water and waste consumption activities on the environment as well as the implication of those actions on other indicators integrity that described conditions during consumption process. Three major social, economic and environmental indicators and their integration were generated for respondent’s indicator voting and scoring purposes in the questionnaires.
Based on these classifications of indicators, a pilot study was undertaken by distributing 20% of questionnaires to samples (people and factories) so as to check validity of content and constructs besides to increase data validity and accuracy. In order to check correlation between variables and quantitative measurement scales, Pearson chi square value was calculated to measure and test internal strength and relationship between variables or indicators and level of green environment. To test the dimensionality of measurements scales and construct variables or indicators (socio-eco efficiency indicators), descriptive factor analysis was done following [36] indicator principles and criterion.
Meanwhile, the researcher computed households and factory’s intensity water consumption and waste recycle efficiency relative to green environment impacts. In this study context, waste is defined as an end product, which consists of both solid and liquid waste, having negative economic value on environment. In Kombolecha industrial Zone, household and factory’s water consumption and waste recycle intensity or productivity were measured using the formula: Water
consumption intensity: cubic metreof water per households and factory’s product. Liquid waste recycle intensity: cubic metreof liquid waste per consumer’s product.
In this case, environmental items were measured using physical units, such as cubicmetre (m3) of water and liquid waste consumption, tons (t) of solid waste. Whereas, water consumption and product value adds were measured using in monetary terms. For this study, Ethiopia currency called Birr were used to measure monetary value of resources such as water, wastes, costs, value adds and etc. To measure efficiency of indicators, it was computed the ratio of water consumption and recycle efficiency relative to households and factory’s value adds of product with respect to social, economic and environmental values. These ratios were measured environment burden of water and waste consumption per unit of economic and social values in Birr. For example, M3 of water consumption per value added of respondent’s products were computed in Ethiopia birr.
On the other side, in this study, indicators were categorised in to eco - efficiency, socio - efficiency and socio- eco efficiency. Eco efficiency was computed economic value of products relative to environmental quality in physical and monetary terms. Whereas, socio- efficiency was measured social value adds of water and waste like health effect with respect to environmental quality in monetary terms. Socio - eco efficiency was calculated physical items of environmental quality (water and waste per units) relative to economic and social value add combination or summations. Similar conceptual formula was used to measure the indicator efficiency.
Eco efficiency of water
=water consumption /M (environmental quality)
Economic value adds of water on products/Birr
Socio efficiency of water
=cubic metre of water consumption (environmental quality)
Social valued adds like health/cost in Birr
Socio − eco efficiency of water
= Eco − efficiency of water + Socio − efficiency of water
6. Econometric Model and Statistical
Analysis
It was, therefore, both qualitative and quantitative descriptive data analysis techniques were used to probe the data and interpret the result. The qualitative techniques were factor grounding theory and descriptive factor analysis. Whereas, the quantitative techniques were applied econometric models, descriptive statistical inferences and central tendencies such as percentage, mean ratio, average and etc. Importantly, econometric models were used to identify and determine association of indicators and their correlation. Hence, binary Logistic Regression Model (BLRM), Instrumental Variable model (IVM) and Two Stage Least Square estimation (TSLM) were used to measure association and correlation between variables. Model goodness of fit and correlation status of variables were measured and checked by Pearson chi square along with the guideline set by Guajarati (1983 & 2004) and Greene (2011). This study model fitness was computed 74 percent, which indicates this model sufficient prediction capacity between explained and explanatory factors.
The validity of statistics and econometric models were checked and accredited along with each proposed purpose and importance to analyze the data for objective two. Secondary type of data such as social, economic, and environmental indicator measurement, scales, indexes, ISO standards, reports and statistics were used to support and strengthen the primary data. The data sources were libraries, internet or website, journals and publications, factory profile and annual reports, Ethiopia environment protection agency, Amhara regional state, and Kombolecha municipal office
unpublished documents. Data inserting, coding, editing and interpreting procedures were done using the latest SPSS24 and STATA 15 Software programs. An alpha value of 0.05 was used as the level for determining the factor significance.
7. Results and Discussion
7.1. Indicators Effect on the Green Environment (ENVISTAt)
The green environment status was described in the notion of achieving green resilience via changing the consumer’s water consumption and recycling efficiency. This was due to the households were consumed and recycled water resource in a different way to carry out the economic, social and environmental achievements. This study established the endogenous (economic & environmental indicators) and exogenous indicators (social aspects) during investigation. Accordingly, this study instrumental variable model (IVM) was regressed the social, economic and environmental indicators effect on the water consumption and recycling efficiency. In other way round, the household’s social indicators (consumption culture and behaviours) were exogenously related with the water consumption and recycling efficiency. However, the household’s economic aspects (monthly income) and environmental indicators (water quantity and waste limit) were endogenously associated with the water consumption and recycling efficiency. As a result, the household’s social, economic and environmental indicators were adversely determined the green environment status (ENVISTAt) by altering the water consumption and recycling efficiency.
7.2. Household’s Socio Demographic Effects on Green Environment
Table 1. Socio- Demographic Effects on Green Environment (Envistat).
Robust
ENVISTAt Coef. Std. Err. z P>|z| 95% Conf. Interval
HHEmp -1.458395 1.432333 -1.02 0.309 -4.265716 1.348925
HHincom .5087591 .8866146 0.57 0.566 -1.228973 2.246492
HHwiling -1.161162 .5414679 -2.14 0.032** -2.22242 -.0999049
HHousing 3.018785 1.748892 1.73 0.084 -.408979 6.44655
HHsex .3599964 .8506045 0.42 0.672 -1.307158 2.027151
HHage -.9628701 4511674 -2.13 0.033* -1.847142 -.0785983
HHeduc -.0285049 .2379373 -0.12 0.905 -.4948534 .4378436
HHfamsi .4575423 .4264858 1.07 0.283 -.3783544 1.293439
_cons 4.548989
*
* indicates significant factor at 5% significance level. Instrumented: HHEmpHHincomHHwilingHHousinG.Instruments: HHsexHHageHHeducHHfamsiHHFRcultHHSSEcoHHSSLIVHHSSHLTH HHSSNIB. Source: Survey Results, 2017.
Table 1 illustrates the instrumented and instruments factor’s impacts on the green environment status (ENVISTAt). In this study context, the instrumented factors (endogenous) were comprised of household’s sex (HHsex), age (HHage), education level (HHeduc), family size (HHfamsi), employment (HHemp) and monthly income (HHincom). Whereas, the instruments (exogenous factors)
stages least square calculated that the household’s willingness (HHwiling) by 0.032 values and age (HHage) by 0.033 values significantly influenced the green environment at the 5 percent significance level.
Moreover, this study identified that respondent’s housing ownership, ability to pay the money and employment status were strongly influenced the green environment status at the same level of significance. The exogenous effect of household’s awareness and its association with endogenous factors such as, employment status, ability, willingness,
housing ownership, and monthly income were regressed by using instrumental variable model regression. This study instrumented or exogenous factors were respondent’s awareness about the green mind (Awgrnmin), product consumption (Awgrnpco) buying goods (Awgrnbuy), and technology use (Awgrntec), resilient green environment (Awgrnenv). These factors were partly associated with the endogenous factors in Table 2 and in turn, changed the green environment status (ENVISTAt).
Table 2. Exogenous and Endogenous Indicator’s Effect on ENVISTAt.
Robust
ENVISTAt Coef. Std. Err. z P>|z| 95% Conf. Interval
HHEmp -6.492766 2.522378 -2.57 0.010* -11.43654 -1.548997
HHincom .9632918 1.669307 0.58 0.564 -2.30849 4.235073
HHablity 1.200356 .5037952 2.38 0.017* .2129353 2.187776
HHwiling .96256 .7621231 1.26 0.207 -.5311738 2.456294
HHousing -4.718186 2.645914 -1.78 0.055* -9.904083 .4677105
*
indicates significant factors at 95% confidence level. Instrumented: HHEmpHHincomHHablityHHwiling Housing.Instruments: HhsexHHageHHeducHHfamsiAwgrnminAwgrnpcoAwgrnbuyAwgrntecAwgrnenv. Source: Survey Result, 2017.
Table 2 consists of instrumented and instrument factor’s effect on the green environment status (ENVISTAt) in Kombolecha. Instrumented factors were independent factors, which were associated with the green environment status. However, instruments factors were endogenous and exogenous factors. In this study, household’s sex (HHsex), ages (HHage), education level (HHeduc) and family size (HHfamsi) were endogenous factors, which determined in the model. Whereas, the exogenous factors that consisted of the household’ awareness to adopt the green mind (HHgrnmin), product consumption (Awgrnpco), buying (Awgrnbuy), technology (Awgrntech) and environment resilience (Awgrnenv). In this study, among factors regressed by in IVM and two stage least square estimation, it was assumed that some part of the exogenous factors, which partly associated with endogenous factors, were indirectly affected the green environment status (ENVISTAt).
In addition to this, respondent’s employment status (HHemp) with 0.01 values was significantly changed the nature of green environment. This was due to Kombolecha consisted an industrials zone, which increased population density and unemployment rate. This employment rate was inversely associated with the green environment problems. For example, it was calculated that when the household’s employment rate was decreased by a unit, holding other factors constant, the green environmental status was increased by 64.9 percent, citrus paribus.
The respondent’s ability to pay the money (HHability) was also significantly influenced the green environment status (ENVISTAt) by 0.017 values at the 95 percent level of confidence. In other words, when the household’s ability to pay was increased by one Birr (equivalent $27.57), holding other factors constant, and the green environment status was positively increased by 120 percent. On the other hand, the household’s housing ownership (HHousing) by 0.055 values
was significantly affected the green environment status (ENVISTAt) at the 95 percent confidence level. Respondent’s, who lived at their own house, were showed willingness to resilient the green environment compared to those who lived at a renting house. This revealed the housing ownership was negatively influenced the green environmental problems. For example, when the household’s housing ownership was increased by a unit, the water consumption and green environment trade-offs was increased but the green environment problem was decreased by 47 percent, ceteris paribus.
7.3. Socio - Eco Efficiency Effect on Water Consumption and Recycling Efficiency
Within this respect, this study two stage least square estimation illustrated that the household poverty was exogenously pretentious to water consumption and recycle efficiency. However, respondent’s monthly income in Birr, water quantity and waste discharges per m3 were endogenously associated with the water consumption and recycling efficiency. This study instrumental variable model regression (IVM), in general, identified that the social, economic and environmental indicators were affected the water consumption and recycling efficiency and in turn the green environment. This IVM model was integrating the household’s poverty, consumption culture, behaviours, monthly income, and waste discharged to the Borkenariver so as to establish the socio- eco efficiency framework. Finally, the IVM proved that the socio- eco efficiency indicators, which consisted the main sub indicators, were guided the water consumption and recycling efficiency.
The research findings were different from BASF (2009) and ESCAP (2014) eco efficiency indicators investigation that commenced in the company’s production process. Unlike Sailing, et al, (2013) SEE balance analysis, this study incorporated the household’s social indicator (poverty, behaviours, culture and etc) into economic (monthly income) and environmental indicators (water quantity and waste limit) in the course of water consumption and recycling process. However, this study social indicator, such as poverty, consumption culture behaviours, religious and etc were
calculated statistically significant and in sequence regulated the water consumption and recycling efficiency. The social indicator’s effect on the consumption and recycling efficiency were integrated and regressed together with the economic and environmental indicators by using a two stage least square regression and STATA 14 software version.
The instrumental variable model (IVM) substantiated social indicators (household’s poverty and consumption culture) and exogenously determined the water consumption and recycling efficiency at the 5 percent significance level. This study rationality laid and fitted to the benchmark: social, economic and environmental indicators were the key pillars to guaranty the green environment resilience in Kombolecha and at large in Ethiopia. Then again, indicators were in a different way distorted the consumption and recycling efficiency at the 95 percent confidence level. However, these study socio-eco efficiency indicators were assessed at the household’s level, which made different from the indicators inquiry on chemical company production. This study two stage least square estimation was not, yet, used by Sailing, et al. (2013), who integrated the society, economic and ecological indicators and built the socio-eco efficiency framework. This study consumer’s monthly income (economic factors), culture, water quantity and waste discharges were substantially built a socio-eco efficiency framework. The effect of each indicator on the socio-eco efficiency application was computed in Table 3.
Table 3. Economic Indicators effect on Socio-Eco Efficiency.
Robust
SOCIECO Coef. Std. Err. Z P>|z| 95% Conf. Interval
ECOINDI .692339 .1980004 3.50 0.000* .3042654 1.080413
ENVINDI .1886716 .1447711 1.30 0.192 -.0950746 .4724177
NB: * indicates significant factors at the 95 percent confidence level. Instrumented factor: ECOINDI. Instruments factor: ENVINDI SOCINDI. Source: Survey Results, 2017.
Table 3 shows socio-eco efficiency framework (SOCIECO) was amongst treated dependent factor that shaped the consumption and recycling efficiency. However, the economic indicator (ECOINDI) and environment indicator (ENVINDI) were endogenous independent factors. Nevertheless, the social indicators (SOCINDI) were indiscernibly associated and affected the socio-eco efficiency application. It was computed that respondent’s economic indicators (ECOIND) was strongly determined the socio-eco
efficiency framework by 0.000 values compared to the environment (ENVIDI) and social indicators (SOCINDI) at the 5 percent significance level. This entails that economic indicators (consumer’s monthly income) were positively contributed to employ the socio-eco efficiency framework that resilient the green environment. Meanwhile, the socio- eco efficiency framework application was improved the water consumption and recycle efficiency (WCORECF).
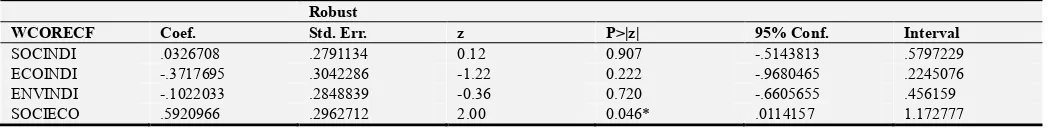
Table 4. Socio-Eco Efficiency Indicators Effect on WCORCEF.
Robust
WCORECF Coef. Std. Err. z P>|z| 95% Conf. Interval
SOCINDI .0326708 .2791134 0.12 0.907 -.5143813 .5797229
ECOINDI -.3717695 .3042286 -1.22 0.222 -.9680465 .2245076
ENVINDI -.1022033 .2848839 -0.36 0.720 -.6605655 .456159
SOCIECO .5920966 .2962712 2.00 0.046* .0114157 1.172777
NB:*indicates significant factors at the 95-confidence level. Source: Survey Results, 2017.
Table 4 shows socio eco-efficiency (SOCIECO) statistical significance to ensure the water consumption and recycling
(ECOINDI), environmental (ENVINDI) and socio-eco efficiency (SOCIECO) indicators were differently associated and affected the water consumption and recycling efficiency (WCORCEF). However, the respondent’s economic, environmental and social indicators separately were not found statistically significant factors of water consumption and recycling efficiency. However, the integration of social, economic and environmental indicators called socio-eco efficiency, significantly affected the water consumption and recycling efficiency (WCORECF) by 0.46 values at the 5 percent significance level.
However, the respondent’s social indicators, particularly, consumption culture and poverty were certainly changed the water consumption and recycling efficiency at the same level of significance. When the household’s poverty level was increased by one unit, hold other factor constant, it would be increased the water consumption and recycles inefficiency by 37 percent. By using instrumental variable model regression, it was calculated that the socio-eco efficiency framework (SOCIECO), was importantly altered the water consumption and recycling efficiency by 0.046 values at the 95-confidence level. This implies that the
socio- eco efficiency framework was a key tool to recover the green environment by balancing the water consumption and recycling efficiency.
In other words, this socio-eco efficiency framework was positively induced the green environment through enhancing the consumer’s water consumption and recycling efficiency. Quantitatively, it was proved that when households were increased the socio-eco efficiency framework (SOCIECO) application by one unit, water consumption and recycling efficiency was improved by 59.2 percent, holding other factors constant, and in turn, increased the green environmental resilience In Kombolecha. Moreover, by using propensity score matching estimation model, Table 4 also showed that each significant social, economic and environmental indicator were not sufficient to resilient the green environment. However, socio-eco efficiency, which is key finding of this study, has statistically significant effected to resilient the green environment by balancing the consumer’s water consumption and recycling efficiency at the 95 percent confidence level.
Table 5. Socio-Eco Efficiency Framework (SOCIECO) Effect on WCORECF.
AI Robust
WCORECF Coef. Std. Err. z P>|z| 95% Conf. Interval
SOCIECO
(yes vs No) .1695989 .0882477 1.92 0.055* -.0033634 .3425613
NB:* indicate significant factors at 95% confidence level. Source: Survey Results, 2017.
Table 5 shows the socio-eco efficiency framework effect on consumer’s water consumption and recycle efficiency (WCORECF) in Kombolecha industrial zone. The socio- eco efficiency impact on water consumption and recycling efficiency was computed by using propensity score matching estimation. The three indicators were treated independent factors. The water consumption and recycle efficiency (WCORECF) was an outcome factor; socio-eco efficiency framework was a treated dependent factor and respondent’s social, economic and environmental indicators were treated independent factors. Accordingly, this study propensity score matching model (PSM) was robust and persistent to evaluate the impacts of a socio-eco efficiency framework on the water consumption and recycling efficiency. Along with this, the socio-eco efficiency framework (SOCIECO) was positively associated with the household’s water consumption and recycling efficiency. For example, it was computed that when the consumer’s socio- eco efficiency practices were increased by one unit, water consumption and recycle efficiency (WCORECF) was also increased by 16.9 percent.
This study proved that the socio- eco efficiency framework (SOCIECO) was statistically significant and sharply affected the consumer’s water consumption and recycle efficiency (WCORECF) by 0.055 values at the 5 percent significance level. This study finding was dissimilar to Sailing, et
al.(2013) socio- eco efficiency (SEE balance analysis) and BASF (2009) chemical company’s product portfolio improvement. This study further evaluated each social, economic and environmental indicator’s effect on socio-eco efficiency frameworks and there by water consumption and recycling efficiency by using the propensity score matching model.
7.3.1. Social Indicators
Table 6. Social indicators effect on Socio-Eco Efficiency (SOCIECO).
SOCIECO Coef. Std. Err. z P>|z| 95% Conf. Interval
SOCINDI -.3065801 .3040656 -1.01 0.313 -.9025378 .2893776
Culture .2363333 .0839079 2.82 0.005* .0718768 .4007897
NB: *indicates significant factor at 95 percent confidence level. Source: Survey Results, 2017.
Table 6 illustrates the household’s social indicators (SOCINDI) and consumption culture (culture) effects on the socio-eco efficiency (SOCIECO) and in sequence, on the water consumption and recycling efficiency. This study found that the household’s poverty was negatively influenced their water consumption and recycling efficiency. That means when the household’s poverty was increased by a unit, their socio- eco efficiency adoption and practices was decreased by 35.7 percent at the 5 percent significance level. Moreover, two stage least square estimated that the respondent’s consumption culture was positively affected the socio- eco efficiency framework and increased the water consumption and recycling efficiency. Besides, the consumption behaviours was enlightening the water consumption and recycling efficiency (WCORECF).
However, the respondent’s consumption culture was prominently influenced the socio-eco-efficiency application that could optimised the water consumption and recycling efficiency subject to the minimum cost. The IVM regression revealed that the consumer’s culture was positively marked and significantly determined the socio-eco efficiency framework (SOCIECO) application and distorted the consumption and recycling efficiency by 0.005 values at the 5 percent significance level. However, the household’s poverty was negatively coupled with the socio-eco efficiency framework application and determined the water consumption and recycling efficiency in Table 7. In other words, poor respondents could not be integrated the three key indicators. As a result, poor respondent’s water consumption and recycling was found inefficient compared to non- poor.
Table 7. Consumption Culture Impact on WCORECF.
Robust
WCORECF Coef. Std. Err. z P>|z| 95% Conf. Interval
Culture .1989832 .0444247 4.48 0.000* .1119125 .286054
ECOINDI -.0216573 .1255066 -0.17 0.863 -.2676458 .2243311
NB:* indicates significant factor at the 95% confidence level. Instrumented: consumption culture. Instruments: ECOINDI SOCINDI. Source: Survey Results, 2017.
Table 7 estimates consumer’s consumption culture and economic indicators (ECOINDI) effect on the water consumption and recycling efficiency. Accordingly, the household’s consumption culture was positively improved the water consumption and recycling efficiency. However, the economic indicator (monthly income) was negatively affected the water consumption and recycling efficiency. That is when the household’s income was increased by $1, the water consumption and waste discharges rates was increased by 2.1 percent to Borkena river. However, in Table 7, chiefly, the respondent’s culture was strongly influenced the water consumption and recycling efficiency (WCORCEF) by 0.000 values at the 5 percent significance level. In other words, when the consumer’s water consumption culture was improved by a unit, the water consumption and recycling efficiency was increased by 19.9 percent, but the green environment problems were decreased by 9.4 percent. However, Williams and Dair (2005)39 argued some sustainable behaviour cannot take place without changes to the built environment.
However, the social indicators were exogenously affected the green environmental status in Kombolecha. In the second stage of the IVM regression, respondent’s culture was directly affected the consumption and recycling efficiency but directly influenced the green environment resilience at the same level of significance. In other words, the
respondent’s culture (social aspect) was exogenously allied and considerably apt the household’s economic and environmental indicators. As a result, the respondent’s economic (monthly income) and social (culture) were calculated statistically significant and hence strongly shaped the green environment resilience by 0.000 and 0.041 values respectively at the 95-confidence level. This revealed that the household’s consumption culture and economic aspects has to be considered since it was keenly crucial to irrepressible the greener environment in the drought affected industrial cities like Kombolecha.
This findings of the study pointed out that the green environment resilience acutely constrained and fell on the resource consumption and recycling patterns. However, respondents were not, yet, making use of rainwater and other water sources to produce goods and services. This was evidently affecting by respondent’s consumption culture. This study computed that the household’s consumption culture was importantly affecting by their monthly income by 0.000 and green perception with 0.000 values at the 5 percent significance level. As a result, the household’s culture was heterogeneously altering the consumption and recycling efficiency.
score matching model (PSM) to evaluate the impacts of household poverty on the water consumption and recycle efficiency. This PSM model used three major factors. The first factor was included as an outcome factor (water consumption and recycling efficiency); the second factors consisted a treated dependent factor (socio-eco efficiency application), and the third factor comprised of the treated independent factors, suchas household’s poverty, culture, behaviours and etc. Accordingly, the outcome factor has a
binomial response, which described whether the household’s water consumption and recycling processes was efficient or not. The socio- eco efficiency application has also a binomial response for which the households were applied it or not. Along with this, this study investigated that the household’s poverty was an exogenously factor that strongly associated and affected the socio-eco efficiency application and in turn, negatively altered the water consumption and recycling efficiency.
Table 8. Household’s Poverty Impact on WCORCEF.
WCORECF Coef. Std. Err. z P>|z| 95% Conf. Interval
Hpovty
(Non-poor vs poor) -.1690687 .0587818 -3.16 0.002* -.273854 -.0642834
*indicates significant factor at the 5 percent significance level. Source: Survey Results, 2017.
Table 8 shows the household’s poverty (HHpovty) impact on the water consumption and recycling efficiency (WCORECF). It was calculated that the household poverty was seriously determined the water consumption and recycling efficiency by 0.002 values at the 5 percent significance level. The respondent’s household poverty was negatively determined the water consumption and recycling efficiency (WCORECF) at the 95-confidence level. For instance, when the household poverty was decreased by a unit, water consumption and recycle efficiency was increased by 16.9 percent, hold others factors constant. Poor respondents were practicing inefficient water consumption and recycling inefficiency compared to non- poor. This study supported Mbata (2006) findings: poor households may not make payment for water as a priority instead they may have to make choices to spend their limited financial resources for subsistence needs.
Furthermore, the household’s poverty was negatively affected by the water consumption and recycle efficiency but positively influenced the socio-eco-efficiency framework practices. This study treatment model (logit in PSM) estimated that household’ poverty was significantly affecting the water consumption and recycling efficiency with 0.002
values at the 95-confidence level. The socio-eco-efficiency framework was determining by household’s poverty and hence inversely affecting the outcome factors (water consumption and recycling efficiency). This study substantiates to UNEP (2014) that reveals every country faced challenges that are made unique by the distinctive characteristics of its society (including cultural values and institutional arrangements), economy and environment. This study investigated that the household poverty was prominently determined the water consumption and recycling efficiency at the 95 percent confidence level.
7.3.2. Economic Indicators
This study measured the effects of household’s monthly income (economic indicator) on water consumption and recycling efficiency. The respondent’s monthly income measured in Ethiopia Birr and USA exchange rate (1 Eth Birr = $27.57). Accordingly, the household’s monthly income was positively associated and affected the socio-eco efficiency framework (SOCIECO) application. In other words, when household’s monthly income was increased by $27.57, the water consumption and recycling efficiency was also increased by 69.2 percent, holding other factors constant.
Table 9. Economic Indicators Impact on WCORCEF.
Robust
WCORECF Coef. Std. Err. Z P>|z| 95% Conf. Interval
ECOINDI .7713936 .2504186 3.08 0.002* .2805823 1.262205
ENVINDI .0183374 .1716789 0.11 0.915 -.318147 .3548218
NB: * indicates significant factor at 95% confidence level. Instrumented: ECOINDI. Instruments: ENVINDI SOCINDI. Source: Survey results, 2017.
Table 9 describes monthly income (economic indicators) and environmental indicator (water quantity) influence on socio-eco efficiency framework (SOCIECO). This study regressed the effect of socio- eco efficiency, which consisted economic and environmental indicators, on water consumption and recycle efficiency (WCORECF). Accordingly, the respondent’s economic indicator (ECOINDI) and environment indicator (ENVINDI) was
apply the socio-eco efficiency framework. That is the rise of respondent’s income was increasing the socio- eco efficiency application and positively changed the water consumption and recycling efficiency by 77.1 percent.
7.3.3. Environmental Indicators
This study measured the effect of environment indicators on water consumption and recycling efficiency that in sequence resilient the green environment. The environmental indicator was taken household’s water quantity and waste discharge limit in the period of water consumption and waste recycling processes. Despite environmental indicators (ENVINDI) were endogenously affected the consumption
and recycling efficiency, yet, respondents were not sensitive and emotional to limit water consumption and waste discharges to Borekna river. Particularly, factory’s and household’s groundwater consumption determined the water consumption and recycles efficiency (WCORCEF) and consequently resilient the green environment at the 5 percent significance level. For instance, in this study, it was found that a unit of water consumption limit was increasing the consumption and recycling efficiency by 89 percent (Tefera, 2018)40. This revealed that the groundwater consumption was utterly eroded the nature of green environment in Kombolecha and at large in Ethiopia.
Table 10. Environment Indicators Effect on WCORECF.
Robust
WCORECF Coef. Std. Err. Z P>|z| 95% Conf. Interval
ECOINDI .8903549 .258742 3.44 0.001* .3832298 1.39748
ENVINDI -.1287534 .1926736 -0.67 0.504 -.5063867 .2488798
NB: * indicates significant factors at 95% confidence level. Source: Survey results, 2017.
In Table 10, the social indicators were assumed indiscernible and exogenously determined were endogenously altered the water consumption and recycling efficiency. Based on this, the instrumental variable model computed that environmental indicators (ENVINDI) were drastically influenced the water consumption and recycling efficiency by 0.001 values at the 5 percent significance level. Especially, water quantity limit was evidently determined the water consumption and recycling efficiency. Similarly, an environment indicator (waste recycling) was changed the water consumption and recycling efficiency and recovered the green environment by 0.001 values at the 5 percent significance level. This study also computed the simultaneous causality between economic, social, and environmental indicators in the water consumption and recycling efficiency.
8. Conclusion
This study was concluded by identified the significant economic, social and environmental indicator’s effects on the water consumption and recycling processes. It was, chiefly, determined the socio - eco efficiency framework and indicators effects on the water consumption and recycling efficiency. This finding was done by using an instrumental Variable model (IVM) and Two Stage Least Square regression (TSLM) used to determine the significant effect of the social, economic and environmental indicators. Model goodness of fit and correlation status was measured and checked during the regressions. Accordingly, the socio-eco efficiency chi square test value was calculated 0.466 that proved a valid association between the three key indicators and the socio-eco efficiency application during water consumption and recycling processes.
This study instrumental variable model was measured the exogenous effect of household’s culture on the water
consumption and recycling efficiency. Similarly, it was computed the endogenous effect of the economic indicators (monthly income) and environmental water quantity and waste discharge limits) on the consumption and recycling efficiency. Particularly, the consumer’s social indicators (SOCINDI) were exogenously altered the socio-eco efficiency framework practices and, influenced the water consumption and recycling efficiency. However, the respondent’s economic indicators (ECOIND) were statistically significant and strongly determined the socio-eco efficiency application and the consumption and recycling efficiency by 0.000 values at the 95 percent confidence level. In addition to this, the consumer’s water quantity and waste discharged limits were significantly determined the water consumption and recycling efficiency by 0.001 values at the 95 percent confidence. Importantly, the household’s sex and cultures were considerably affected the water consumption and recycling efficiency by 0.005 and 0.034 values respectively at the same confidence level.
However, the household’ poverty was negatively influenced the water consumption and recycling efficiency by 0.002 values at the 95 percent confidence. That is poor respondents were not integrated the three key indicators and employed the socio-eco efficiency framework.
Kombolecha city administration and FDRE government, thus, should give due attention to consider the economic, social and environmental aspect and encourage their integration (socio-eco efficiency) and then enhance integrative and participatory approach that ensure optimal water resource consumption and industrial growth in Kombolecha industrial zone and at large in Ethiopia.
References
[1] FAO, 2007&2011: Interdepartmental Working Group on Climate Change: Climate Change and Food Security. A Framework for Action. Rome: Italy.
[2] GTP, 2010 & UNEP, 2011: Towards a Green Economy: Pathways to Sustainable Development and Poverty
Eradication: A Synthesis for
PolicyMakers.Www.Unep.Org/Greeneconomy.
[3] Kombolcha Municipality office, 2012: Kombolecha city municipality Annual Report, unpublished, Kombolecha. Ethiopia.
[4] Kombolcha City industry office, 2013: Kombolecha city Trade and industry office. Investment report, unpublished, Kombolecha, Ethiopia.
[5] Guy R 20105: Economic, Environmental and Social Sustainability Indicators: Research and Development Aiding Triple Bottom Line Sustainability in Cotton Industry. Australian. Www.Cottoncrc.Org.
[6] WBCSD, 1996: Eco Efficiency and Cleaner Production: Charting the Course to Sustainability. Geneva: Switzerland. [7] ESCAP, 2009, Bruce et al., 2010) and Lorenzo, 2013, and
ESCAP 2009: Eco-Efficiency Indicators: Measuring Resource-Use Efficiency and the Impact of Economic Activities on UNEP. Bangkok 10200: Thailand. Www.Unescap.Org/Esd.
[8] Sailing, et al. (2013): How to measure social impacts? A socio-eco efficiency analysis by SEEBALANCE Method. Karlsruhe university, Jena university and Oko-institute. Germany.
[9] WBCSD (1996), ESCAP (2009)9: WBCSD 1996: Eco Efficiency And Cleaner Production: Charting the Course to Sustainability. Geneva: Switzerland.
[10] Kuznets, 1955: Kuznets S 1955: Growth and Economic Inequality. American Economic Review, 45: 1, 1-28. USA. [11] Gujarati D 1995 &2004: Basic Econometrics, Third Edition.
New York: Mcgraw-Hill.
[12] McDonagh&Ramlogan, 1997 and Chen, 2010: Mcdonagh P & Prothero A 1997: Green Management: A Reader. London: Dryden Press.
[13] Tracey and Anne, 2008: Tracey S & Anne B 2008: Sustainable Development: Linking Economy, Society, and
Environment. OECD. Web:
Www.Oecd.Org/Publishing/Corrigenda.
[14] Uno S 2011: Urban Development And The Environmental Challenges “Green” Systems Considerations: Issue Paper Commissioned By The European Commission. The Stockholm Resilience Center: Stockholm University.
[15] Abigail, 2012: “Building Urban Resilience: Principles, Tools and Practice.” The Worldbank Group 1818 H Street: NW Washington. DC, 20433: USA.
[16] UNEP, 2011: Towards a Green Economy: Pathways to Sustainable Development and Poverty Eradication: A Synthesis for Policy Makers. Accessed: Www.Unep.Org/Greeneconomy.
[17] Smith, 2013: Smith EE 2013: Assessing The Impact Of Greening Perceptions On Consumer Purchasing Behavior: International Journal Of Economics And Management Sciences Vol. 2: No. 11: Pp. 94-107. Department Of Business Management: Nelson Mandela Metropolitan University: South Africa.
[18] Elkington, 2004: Elkington J 2004: Enter The Triple Bottom Line. In.: Henriques, A.; Richardson, J. The Triple Bottom Line: Does It All Add Up? London: Earth Scan.
[19] Anna, 200620.
[20] Freeman (1984), Beckenstein (1996) and Elkington (2004): Beckenstein A 1996: Stakeholder Negotiations: Exercises In Sustainable Development. IRWIN. P. 2.
[21] Rainer, 2005 & 2006): Rainer G 2006: Feasibility Study: Integration of Social Aspects into LCA.
[22] WBCSD, 1996, ESCAP, 2008& UNIDO, 2009: Background Paper On The 4th Forum On The Seoul Initiative Network On Green Growth: “Promotion Of Green Industry For Green Growth”. United Nations: Bangkok.
[23] (GTP, 2010): Growth and Transformation plan of Ethiopia, Addis Ababa, Ethiopia.
[24] (UNIDO, 20011&Kombolecha municipal, 2014): Green Industry: Policies for Supporting Green Industry: Vienna. Accessed: Www.Unidio.Org/Green Industry.
[25] WBCSD 1996: Eco Efficiency And Cleaner Production: Charting the Course to Sustainability. Geneva: Switzerland. [26] Isabell S and Manfred M; Peter S and Andreas K, Wolfgang R
and Carl-Otto G (2002): Managing Sustainability of Products and Processes with Socio-Eco-Efficiency Analysis. By BASF ÖkoInstitut in Freiburg: Germany.
[27] ESCAP 2009: Eco-Efficiency Indicators: Measuring Resource-Use Efficiency and the Impact of Economic Activities on UNEP. Bangkok 10200: Thailand Accessed At Www.Unescap.Org/Esd.
[28] Bruce W. S and Pter Saling, 2010: Measuring and Communicating Business through Eco Efficiency Analysis: Issue of CEP Environmental Management. BZAF, Chemical Company. USA. Www.Aiche.Org/Cep.
[30] (Fussler, 1996): Fussler C 1996: Driving Eco Innovation. Pitman Publishing.
[31] (MDG, 2015): FDRE Milliunium development Goals, Addis Ababa, Ethiopia.
[32] Kombolecha mayor office, 2016: industry Growth and city development promotion report, Kombolecha, Ethiopia. [33] ESCAP (2009a): Economic And Social Survey Of Asia And
The Pacific: Addressing Triple Threats To Development. United Nations: Bangkok.
[34] UNEP (2009) and UNIDO (2011): Green Industry: Policies For Supporting Green Industry: Vienna. Www.Unidio.Org/Green Industry.
[35] FDRE, 2010: Ethiopia Growth and Transformation Plan Two (GTP-2). Addis Ababa: Ethiopia.
[36] FDRE, 2012: Ethiopia’s Climate-Resilient Green Economy: Green Economy Strategy. Addis Ababa: Ethiopia.
[37] FDRE, 2010: FDRE Industry Development Strategies, Addis Ababa, Ethiopia.
[38] FDRE, 2010: FDRE Product Quality Assurance and Measurement Agency manuals, Addis Ababa, Ethiopia. [39] Williams and Dair, 2005: Waste management. Environmental
Sciences: A global concern. McGraw-Hill publisher, New York. 2005; 3-44.