Publication Date: Dec. 25, 2018 DOI: 10.14738/abr.612.5823.
Janamanchi, B. (2018). Open Source Software for Data Visualization. Archives of Business Research, 6(12), 314-327.
Open Source Software for Data Visualization
Balaji Janamanchi
Associate Professor of Management
Division of International Business and Technology Studies
A.R. Sanchez Jr. School of Business, Texas A & M International University
ABSTRACT
There is no denying the fact that large amounts of data is generated in almost all our daily activities. With the increased volumes of data there is an acute need for new tools that can help make sense of these large volumes of data and provide useful actionable pointers. As the saying goes, a picture is worth thousand words. So visualizing the data makes it easier to grasp the salient aspects of the data and possibly opens the doors for greater insights. What better way to do it than in the most cost effective way or simply free of cost, at least in terms of purchase or usage costs. Open source software provides such cost free options to process and visualize data. This study analyses the availability and accessibility of Data Visualization software on the Source Forge website, undeniably, a large repository of open source software resources. Limiting the search to Business & Enterprise category, and using “Data Visualization” key word, a total of 42 applications are identified and their data is downloaded and analyzed. It is hoped that the results will help users to be aware of various Data Visualization Open-source software options currently available for use. It is also intended that the results will help users understand the current state of Open Source Data Visualization Software development.
Keywords: Open Source Software, Data Visualization, Sourceforge, Open Source Licensing.
INTRODUCTION What is Open Source?
The term Open source originated in the context of software development to designate a specific approach to creating computer programs [1]. Open sources software (OSS) is quite distinct from normal usual software in that, open source software is developed by software programmers to be made available free-of-charge to potential intended users under rather unrestrictive set of terms of usage license [1]. The most interesting fact about Open Source is that, most open source software is available free of cost to interested end users who can in most instances download the software applications as they need for their use.
As may be logically inferred, “open source” refers to the “source code” of an application left open and accessible for the users to modify, extend, alter, amend and improve as they need or desire, to suit their specific usage requirements. Normally, when computer software is provided to end users for their use, proprietary software providers do not allow access to the source course of the software to the end-users. A very limited to no opportunity is given to end-users to customize the functionality and finer features of the application to end users depending upon the software providers’ policies. This obviously leads to an avoidable dependence on software sellers for almost all issues with the use and implementation of applications at the end-user organizations’.
What is Source Forge?
of downloads for load balancing, a wiki for documentation, developer and user mailing lists, user-support forums, user-written reviews and ratings, a news bulletin micro-blog for publishing project updates, and other features” [2].
“SourceForge offers free access to hosting and tools for developers of free / open-source software, competing with other providers such as GitHub, Bitbucket, RubyForge, Tigris.org, BountySource, Launchpad, BerliOS, JavaForge, GNU Savannah, and GitLab. As of March 2014, the SourceForge repository claimed to host more than 430,000 projects and had more than 3.7 million registered users.” [2]
As may be noted from the above, Source forge is a common shared forum where independent software developers can upload and host software applications they created for others to see and appreciate and possibly download and use, improve share further with others. This may be likened to artifact emerging from a loosely put together collaborative project effort by team members that may not ever meet or know each other in the team. As things stand, Sourceforge is not the top ranked forum among open source repositories. There are forums like, GitHub, Bitbucket, GitLab and Assembla that are ranked higher than Sourceforge in terms of membership or project or both. Sourceforge is the first such forum to provide a centralized location to host opensource software for developers and users free of cost in the year 1999.
What is Data Visualization?
“Data visualization is a general term that describes any effort to help people understand the significance of data by placing it in a visual context. Patterns, trends and correlations that might go undetected in text-based data can be exposed and recognized easier with data visualization software” [3].
A simple analysis of the above definition leads the reader to recognize the inevitable conclusion that data visualization helps in absorbing or taking in large volumes of business data in an easy to absorb form. Further Data Visualization assists in recognizing faster the patterns, trends and correlations that may go unnoticed. In implementation several of these data Visualization application permit, “what if?” sensitivity analysis and interaction with the data to the users giving them invaluable insights into the business contexts.
As the adage goes, a picture is worth thousand words. And it goes without saying that an incorrect picture can convey an inaccurate narration of thousand words. So its important to get the picture right with the attendant contextual characteristics to convey the right narration to the audience. Well developed, well tested Data visualization tools can easily accomplish this complex task resulting in immense decision support to the business managers.
Who uses / could use Data Visualization?
For obvious reasons all decision makers need as much decision support as they can get. More so of the type that is reliable and easy follow. All business organizations, corporations, marketing consultants, government agencies, policymakers, predictive modelers, scientists and researchers and whoever needs to make effective decisions need data visualization tools in making better decisions for better/effective results.
CURRENT STUDY- PURPOSE AND OBJECTIVE
attention is given in academic literature to the availability of and characteristics of open source software (OSS) in Data Visualization. This study explores these issues with an analysis of Data Visualization related OSS projects on Source-Forge, a large repository of open source projects. The idea is to assess the available cost-free resources for data visualization that may be accessible to and useful to small and medium business organizations that may not be able to afford expensive proprietary software for data visualization purposes.
DATA COLLECTION PROCESS Data Search on Sourceforege
The data was gathered using the open source software website www.sourceforge.net. Collection of the data started on September 27th and finished on September 30th, 2017. By using the browse option on the website, it was possible to only concentrate on Data Visualization software in the Business & Enterprise domain (access the list by choosing “business & enterprise” menu item from browse page, and then typing in “data visualization” in search bar). A total of 42 applications were found and recorded.
Metrics recorded and date of collected
For each of the 42 Data Visualization software in the business & enterprise field, the following data was collected: software name, date registered, date last updated, intended audience, programming language, languages, OS versions available, review & rating (on a scale of 5.0), total downloads, top download country, top downloaded OS, license type. Any missing data was highlighted in the spreadsheet but was not imputed. Instead, the analyses are performed based on the available data under the respective fields.
ANALYSIS AND FINDINGS
Figure 1: Histogram of date registered
To begin with, consider the histogram of these applications based on the date of registration. As may be noted the oldest of them is registered in the year 2001 and the newest in the year 2017. With the exception of 18 months with nine months on either side of Jan 1, 2016 when there was only one application registered, each 18-month time window witnessed at least two new applications registered since 2001. A maximum of 8 new applications were registered around Jan 1, 2010.
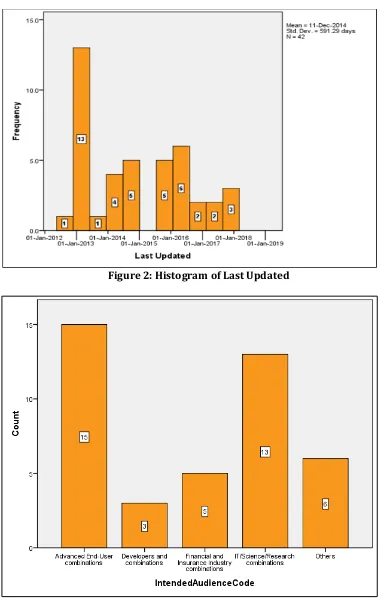
As may be noted from Figure 2, a total of 24 out of 42 projects have not been updated after the year 2014. Some of these may have been abandoned. Over 40% (18 out of 42, to be precise) are actively updated as recently as the end of the year 2017 (that’s quite impressive given that the data was gathered in September of 2017). It may be that not all projects started survive past their tenth anniversary.
Figure 2: Histogram of Last Updated
Figure 3 Intended Audience
Licensing: Broadly speaking OSS license types form a spectrum ranging from highly restrictive (GNU AGPLv3) through moderately restrictive (GNU LGPLv3), moderately permissive (Apache License 2.0), highly permissive (MIT License) and ending with Unlicense (public domain) [5].
Common sense suggests that restrictive licenses are likely to attract developers more than end-users because restrictive licenses place restrictions and obligations on the user of the respective application that only seasoned developers can navigate. While highly permissive and unlicense types will be of great interest to end-users more than developers for obvious reasons. All licenses are explained in detail at the Opensource Initiative website [6]. Figure 4 below shows the distribution of license types among the Open Source Data Visualization applications. It may be noted that GNU GPLv2 is the most popular while there is a fairly widespread selection of license types ranging on the spectrum of license from restrictive to permissive and totally unlicensed public domain as well.
Figure 4 License Type
Figure 5: Top Downloaded country
As may be noted from Table 1, of the 42 applications under study, 12 are most downloaded in just 6 different countries. The thirty that do not have a most downloaded country recorded for are perhaps, rather unpopular applications that are either abandoned or are yet to be downloaded as on the date of data collection. As for the others, United States is the leader with 4 most downloaded, followed by China (3) and Germany (2) and India, Russia, and Saudi Arabia accounting for one each. While not much can be read into the spread of countries in the table above, one can definitely conclude that the OSS initiative is spreading far and wide.
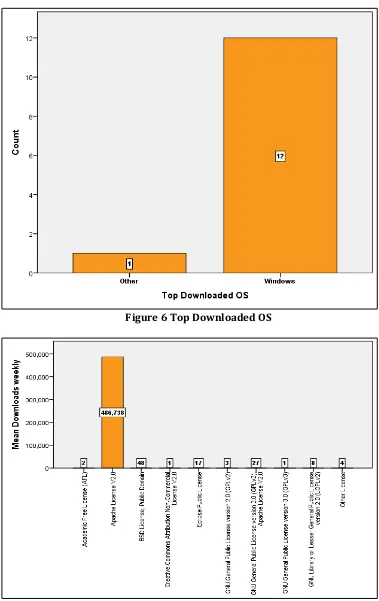
Figure 6 Top Downloaded OS
Figure 7 Mean Downloads by License type
Figure 8 Languages available for Implementations
Figure 9 Programming Language
In so far as the preferred programming language is concerned, Figure 9 shows that Java is by far the most popular with 10 out of 42 applications using it. Followed by Python, JavaScript and C# and other Java family languages. Surprisingly, VBA and C based applications also found place here.
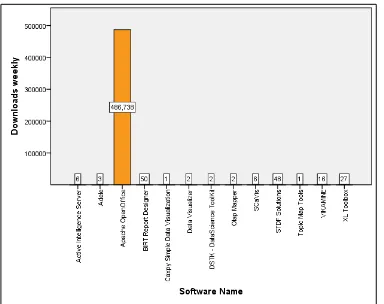
Figure 10 below depicts downloads of all active software that have had at least 1 download during the week of data collection. As may be observed, one specific application “Apache OpenOffice” dominates the visual due to its phenomenal success, a success much larger than the rest of all 41 application combined in terms of downloads. However, it must also be noted that Apache OpenOffice is not just a Data Visualization tool but a complete suite of applications like that of MS Office suite of applications. So comparing downloads of that application with the other data visualization specific applications is quite “unfair” to other applications.
Figure 10 Weekly downloads of active software applications
The Top Ten Applications
Apache Open Office (Apache License v2.0): As stated before, Apache Openoffice is a cost-free alternative for Office applications. Apache OpenOffice is an open-source office productivity software suite complete with word processor, spreadsheet, presentation, graphics, formula editor, and database management applications. In short, if one doesn’t like to use proprietary office software they can easily do so by replacing it with OpenOffice suite of applications while maintaining compatibility with all documents created in proprietary versions be it word processor or spreadsheet related, or databases. OpenOffice is available in over 170 languages (as stated on the Sourceforge web page of the application), works on almost all normal computers, supports storage of data in ODF - the international open data format as highlighted on the company’s account page in Sourceforge website [7]. Based on the details available in Sourceforge webpage of the application, Apache Open office is more than just Data Visualization tool and is in a way a general purpose application. As such, it may or may not provide the very specific data visualization features one may be looking for. But the good thing about Apache Openoffice is that it has very vast user community, is supported in multiple languages and as a matter of fact, also comes with commercial support if one chooses to go for that.
most versatile and flexible to meet the requirements of technically savvy and demanding end-users [8].
XL Toolbox (GNU GPLv2, Apache License V2.0): Essentially, XL Toolbox is a free Excel statistics add in. It helps in analyzing and presenting quantitative data. XL Toolbar features include, Smart custom error bars, chart design, chart export to Tagged Image File Format (TIFF), formula builder, transpose wizard and analysis of variance (ANOVA). XL Toolbox also includes automatic backups, workbook management and many more user-friendly features as described on the Sourceforge webpage of the application [9]. Going be these details, XL Toolbox looks like an ideal tool for end-users needing predominantly statistical analysis and presentation of large volumes of quantitative data, subject to the volume limits of MS Excel spreadsheets.
OpenI OLAP Data Visualization Plugin (GNU GPLv2): OpenI plugin is for Pentaho CE specifically designed to provide simple user interface to facilitate visualize data in OLAP cubes. OpenI OLAP Data Visualization Plugin claims to provide support much like Microsoft SQL Server Analysis Services (SSAS), as well as add-on features of Explore Cube Data, custom SQL for drillthrough data, publishing drillthrough data to external web services etc., [10]. Pentaho Community Edition (CE) is a version of Pentaho’s open source data integration and business analytics platform that comprises of powerful set of tools for developers. These tools seek to promote innovation, participation and cooperation among the developers. So in a way, OpenI OLAP Data Visualization Plugin is rather narrow in its scope that it is for the users who are already using the Pentaho CE.
STDF Solutions (BSD License- Public Domain): As name suggests, the application is focused on providing support in dealing with Standard Test Data Format (STDF) files. The support is a two-step process of first reading/writing of STDF files, followed by processing with statistical / visualization tools as demand dictates [11]. Apparently, this is an excellent choice to deal with the STDF output albeit narrower in its scope of use to that extent.
Active Intelligence server (Other License):
“Active Intelligence Server 2 (AIS) is a data visualization tool and fully featured reporting server which enable users from open source community to host any reports created using BIRT, Jasper and Pentaho community edition allowing organization to leverage open source technologies and enable them to use AIS as a reporting server to deploy their existing and new reports seamlessly onto AIS for secure sharing the information in different file formats and schedule to make system automation and much more,”[12].
Further, AIS comes with self-service Business Intelligence (BI) capabilities. As may be noted, this AIS appears to be well conceived to harness the power of OSS applications and to lend additional support in adoption of relevant OSS applications by enhancing them with data Visualization Support. Surely, the end-users will be happy to combine cost free OSS applications to derive maximum benefits from those combinations. AIS also provides a host of other user friendly features such as, Business Reporting, Dashboard, Analytics, KPI (Key Performance Indicators) besides Data Visualization.
SCaVis (Other License):
data in 2D and 3D, perform statistical tests, data mining, numeric computations, function minimization, linear algebra, solving systems of linear and differential equations. Linear, non-linear and symbolic regression are also available. Elements of symbolic computations using Octave/Matlab scripting are supported,” [13].
As may be observed, SCaVis appears to be the go to tool for scientists, engineers and students dealing with scientific data analysis and data visualization. Surely, the cash strapped end-users will be happy to find this cost-free tool a boon in the times of need to process and continue their research initiatives. SCaVis also provides a host of other user friendly features such as, symbolic calculations, statistics, data mining besides Data Visualization.
VIKAMINE (LGPL v2.0): is implemented in pure Java. It supports visual analytics, data mining and business intelligence. As stated in its webpage on Sourceforge, VIKAMINE is rich in features and comes with powerful visualization and mining methods, Artificial Intelligence (AI) etc. [14]. It is most downloaded in Germany and appears to be fairly popular going by downloads.
Talend data Preparation (Apache License v2.0): from USA is primarily a Data Preparation tool that empowers user in the organization to quickly and easily prepare data for analytics and processing. It allows user to explore, cleanse, and combine data from disparate formats and sources quickly with the help of point-and-click visual tools and context based help to enrich data [15]. Appears to be more popular in China than anywhere else.
Adele (Other License): is from Germany was developed to assist those that use spreadsheet applications and enterprise servers like SAP or ERP with the help of specialized tools like Rapid Miner, and KNIME to analyze the data. Adele claims to include many technical concepts in an easier to use manner besides providing a plugin concept for enhancements [16]. Another interesting feature if Adele is that it can be run without installation from USB stick for Windows, Linux and MacOSX which should make it massively popular given its easy portability and quick deployment with really installing it.
CONCLUSIONS
Based on the charts created, descriptive statistics computed and the analyses performed from the data collected, the following important observations may be made.
• United States is at the forefront being the host country for three or more of the top ten projects followed by Germany with two projects and China, Indian, Russia and Saudi Arabia as source countries for one each of the top eight ten data Visualization projects.
• Three of the top ten projects offer Apache License V2.0 License, three other offer Other License, while, two of the top ten projects offer GNU GPL V2.0 license followed by one each offering LGPL v2.0, Eclipse Public License and BSD License.
• Corporations are appearing to sponsor OSS projects which is at variance with the trend from the early years of Sourceforge when such sponsorship was almost nonexistent.
• Not surprisingly, sponsorship is positively impacting popularity of OSS because end-users seem to prefer brand name recognition that comes with higher reliability for continuity and greater probability of continued support in future.
adopted and further developed by the others either by combining it into their own creations or by making it that much more robust.
• A large number of developers of OSS data Visualization software are turning towards web based platforms and programming languages followed by Java Swing and its variations. Java’s popularity as preferred programming language is not surprising given that Sun Microsystems enjoys a lot of market share and recognition for its products and continuous enhancements.
• Going by the sample of Sourceforge, albeit a convenient sample, there is a very active, dependable OSS community in developing Data Visualization software not just limited to any one particular region of the world or a programming platform. The activeness of the community is further evidenced by the fact that, three new projects have been added in the year 2017 when the data was collected in October of 2017 and several more are added since October 2017 to current date.
References
Opensource 2017a at URL: https://opensource.com/resources/what-open-source accessed on 3/1/2017. Wikipedia page on Sourceforge at URL: https://en.wikipedia.org/wiki/SourceForge accessed on 3/1/2017. TechTarget at URL: http://searchbusinessanalytics.techtarget.com/definition/data-visualization accessed on 10/21/2017
SAS research team, “Why is big data analytics important?” at URL:
https://www.sas.com/en_us/insights/analytics/big-data-analytics.html accessed 12/1/2017. Choosealicense.com at URL https://choosealicense.com/licenses/ accesses on 12/1/2017. Opensource 2017b at URL: https://opensource.org/licenses/category accessed on 3/1/17 Apache Openoffice “Description” on Sourceforge at URL:
https://sourceforge.net/projects/openofficeorg.mirror/?source=directory-featured accessed on 9/30/2017 BIRT Report Designer “Description” on Sourceforge at URL:
https://sourceforge.net/projects/opensourcebirtreportdesigner/?source=directory accessed on 9/30/2017 XL Toolbox, “Description” on Sourceforge at URL: https://sourceforge.net/projects/xltoolbox/?source=directory accessed on 9/30/17
OpenI OLAP Data Visualization Plugin “Description” on Sourceforge at URL:
https://sourceforge.net/projects/openi/?source=directory accessed on 9/30/2017. STDF Solutions “ Description” on Sourceforge at URL:
https://sourceforge.net/projects/freestdf/?source=directory accessed on 9/30/2017
Active Intelligence Server “Description” on Sourceforge at URL: https://sourceforge.net/projects/active-intelligence-server/?source=directory accessed on 9/30/2017.
SCaVis “Description” on Sourceforge at URL: https://sourceforge.net/projects/scavis/?source=directory accessed on 9/30/2017
VIKAMINE “Description” on Sourceforge at URL: https://sourceforge.net/projects/vikamine/?source=directory accessed on 9/30/2017.
Talend Data Preparation “Description” on Sourceforge at URL: https://sourceforge.net/projects/talend-data-preparation/?source=directory accessed on 9/30/2017.