Real Time Abnormal Activity Recognition in
Academic Environments
1
Muthusathiya .E, 2Usha Kingsly Devi.K
1
PG Scholar, 2Assistant Professor 1
Department of Electrical and Electronics, 2Department of Electronics and Communication Engineering Anna University Regional Campus-Tirunelveli, Tamilnadu
ABSTRACT
Abnormal activity detection plays a crucial role in an academic environment. A novel framework has been proposed for the real-time abnormal activity recognition in an academic environment. To develop an abnormal activity recognition system the work is divided into three modules: software module, embedded main board module, communication module. For effective identification of an activity, a real time video can be taken and processed using root of sum of square method in which different window size is used to record magnitude of pixel intensity. Histogram of Gradient used for performing feature extraction. The human activity is classified into two groups: normal activities and abnormal activities based on the Random forest approach. Finally, a software-based simulation work using MATLAB is performed and the results of the conducted experiments show the excellent abnormal activity recognition in an academic environment with no human intervention. When a student involves in such abnormal activity inside the academic environment it can be intimated to the management and staff with a message using GSM modem. The results reveal that the proposed system has achieved an accuracy of 93 % and it performs well than the other existing systems.
Keywords
Root Of Sum Of Square, Random Forest Approach, HOG , PIC controller
1. INTRODUCTION
Academic environment is a place where students are trained with disciplinary actions and is considered as a temple of learning. Cameras attached to monitor screens are generally a traditional video surveillance system. But, in a few areas, the screens are not observed continually. If there is an abnormal incident, the video footage can be utilized as proof. Another limitation is that it requires a lot of time to search for the right video pictures, particularly when the suspect is at the scene long before the incident takes place and when there are many students involved. If any abnormal incident happens, then a warning message will be sent to the staff with the
help of GPS. Because of these limitations, there is a need for a technique or methods that can automatically detect and analyze human activities.
2. Related Work
based on IP cameras and deployed in an academic environment. The system architecture is based on efficient moving object detecting and tracking algorithm and a robust statistical activity recognition framework based on SVM which is used for modeling activities. Hence, discerning the moving person from the mostly white background of our environment in the college was a very tedious task. Actually, it was performed and tested for the red head cover detection, but still this head cover may be white for many people of Saudis.S. Ishikawa describes the Motion History Image (MHI) approach [6] is a view-based temporal template method which is simple but robust in representing movements. It is widely used for action recognition, motion analysis and other related applications. The limitations of the MHI method are related to the 'global image' feature calculations and specific label based recognition. Yannick Benezeth describes a method for behavior modeling and abnormal events detection which uses low level features. In conventional object-based approaches [7] objects are identified, classified, and tracked to locate those with suspicious behavior. The co-occurrence matrix is thus used for detecting moving objects whose behavior differs from the ones observed during the training phase. Interestingly, the Markov Random Field distribution implicitly accounts for speed, direction, as well as the average size of the objects without any higher-level intervention. The estimate of the computation cycles required per sub processing block. It requires more modification to account for the data dependencies. Yahya Chetouani describes the early detection of faults may help avoid product deterioration, major damage to the machinery itself and damage to human health and proposes a robust fault detection method with an Artificial Neural Network-Multi-Layer Perception (ANN-MLP) [8] and a statistical module based on Wald’s sequential probability ratio test (SPRT). The results are affected by faults that change the system dynamics by causing surges of drifts of the components, abnormal measurements, sudden shifts in the measurement channel and decrease in the accuracy of the instrument. Martin D. Levine describes an approach for detecting suspicious events in videos by using only the video itself as the training samples for valid behaviors. These salient events are obtained in real-time by detecting anomalous spatio-temporal regions [9] in a densely sampled video. The method codes a video as a compact set of spatio-temporal volumes, while considering the uncertainty in the codebook construction. A drawback of the method is that the inference of suspicious patterns requires a threshold which can be determined only by experiments.Robert describes the method for activity recognition and subject identification based on
random projections [10] from high-dimensional feature space to low-dimensional projection space, where the classes are separated using the Jaccard distance between probability density functions of projected data. The drawback is choosing the projection by selecting k positions uniformly at random is difficult.
3. EXPERIMENTAL ANALYSIS
The database used in the paper is obtained from GANESHA MOORTHI middle school, Tirunelveli. The number of frames obtained for a school video is about 1600. The width of the frame is 640 pixels. The number frames used for training normal activity is 1335 respectively. Preprocessing is performed on every N number of successive frames to incorporate information of all frames into single frame. In preprocessing Root of Sum of Square (RSS) is used to calculate magnitude of each individual pixel in gray level over various window size (N) like three, five and eight frames. After processing all videos used for training, final dataset generated. Once testing dataset generated it is fed into Random Forest classifier along with training dataset.
4. BLOCK DIAGRAM
Fig 4.1: Frame work for abnormal activity detection
Gradient (HOG) is used for the normal and abnormal event detection. Thus, the approach also reduces the computational complexity to a large extent. The Histogram of Gradients (HOG) [23] is a feature descriptor used in computer vision and image processing for object detection. The technique counts occurrences of gradient orientation in localized portions of an image.
The image is divided into small connected regions called cells and for the pixels within each cell a histogram of gradient directions is compiled. The descriptor is the concatenation of these histograms. For improved accuracy the local histograms can be contrast-normalized by calculating a measure of the intensity across a larger region of the image called a block and then using this value to normalize all cells within the block. This normalization results in better invariance to changes in illumination and shadowing.
CALCULATION OF MAGNITUDE AND
GRADIENT OF AN IMAGE
|G|= 𝑖𝑥2+ 𝑖𝑦2 (3.1)
𝜃 = 𝑎𝑟𝑐𝑡𝑎𝑛𝑖𝑥
𝑖𝑦
(3.2)
Where I is the given image, (x and y) are obtained using convolution operation.
BLOCK NORMALIZATION
F= 𝑣𝑣
22+𝜀2 (3.3) V =non normalized vector which contain all
histogram of given block. 𝑣 is 2-norm of v and 𝜀 is some small constant.
The events that are performed by the persons are classified based on the trained actions. This type of classification of events is done with the help of Random Forest Approach. Random Forest not only keeps the benefits achieved by the Decision Trees but through the use of bagging on samples, its voting scheme through which decision is made and a random subset of variables. It most of the time achieves better results than Decision Trees. The Random Forest is appropriate for high dimensional data modeling because it can handle missing values and can handle continuous, categorical and binary data.
Accurate predictions and better generalizations is achieved due to utilization of ensemble strategies and random sampling. Random trees can be generated efficiently and the combination
of large sets of random trees generally leads to accurate models.
In this project, Proteus 8.0 software is used for simulation. It is the best schematic software of all time. It has thousands of components and it is very professional in nature. It can be used to simulate microcontroller and microprocessor. It has inbuilt assemblers and it can be integrated with many compilers. It is the best embedded schematic and simulation tool. It has many functions. Proteus too has many short comings and that is in the area of component models or libraries or supported devices. Some of the advantages of Proteus software are listed below,
Alter “hardware” by rewiring the circuit diagram, varying component values for resistors, capacitors etc.
Removing or making new components to the design.
Change firmware in the IDE of our choice and, once compiled, test the new code on the new system at the press of a button.
Reprogramming microcontroller: In practical there is limitation to flash the memory of microcontroller but in Proteus you can burn program unlimited times. 5. RESULT AND DISCUSSION
The implementation is carried out using MATLAB R2013a and the databases used in the project is
REAL TIME VIDEO FROM GANESHA
MOORTHI MIDDLE SCHOOL,
TIRUNELVELI.
The input video is a real time school video. it includes both normal and abnormal frames in it as follows
(b)
Fig 5.1: Preprocessing Stage- (a) abnormal image (b) normal image
Preprocessing is performed on every N number of successive frames to incorporate information of all N frames into one frame. In preprocessing root of sum of square (RSS) is used to calculate magnitude of each individual pixel intensity in gray level over various window size (N) like three, five and eight frames. After processing all videos used for training, final dataset generated. Once testing dataset generated it fed into random forest classifier along with training dataset. Classifier generate model from training dataset and predict most likely class for every testing instance.
Fig 5.2: Video To Frame Conversion
The input video is taken and is preprocessed using the Root of Sum of Square (RSS).Thus, the video is separated into 251 number of frames. The separation of frames is done by calculating the magnitude of each pixel intensity gray level over various window sizes (N). The resultant motion rich frame is highly compressed which reflect the action in a dense representation. The number of frames obtained for the Ganesha Moorthi school video is 1500. The width of the frame is 640 pixels. The frame rate obtained is about 20 per second. The number of video used for training normal activity is 10 respectively.When an input data to an algorithm is too large to be processed and is suspected to be redundant, then it can be transformed into a reduced set of features. Feature extraction is related to dimensionality reduction.
Fig 5.3: Feature Extraction
Once matrix gets generated from above processing HOG is applied to extract useful information from each new matrix. HOG is used to efficiently describe shape and appearance of local object within an image by distribution of intensity gradients and edge directions. The HOG descriptor has a few key advantages over other descriptors. Since it operates on local cells, it is invariant to geometric and photometric transformations, except for object orientation. Such changes would only appear in larger spatial regions. The dimension of each block is determined by the number of orientation in the block.
The input video provided at a time of preprocessing and then frame conversion is performed. Then based on earlier the trained data it performs the classification of the activities as normal and abnormal and produces the above figures (A) and (B) as results.
(B)
Fig 5.4: Classification of abnormal (A) and normal (B) events
After the detection of abnormal and normal events, it is implemented using GUI (GRAPHICAL USER INTERFACE) which is used to make electronic device communicate with the user through graphical icons and visual indicators such as secondary notation.
Instead of text-based user interfaces, type command label or text navigation can be used. The GUI tool implementation for detection of normal and abnormal event in School is shown in Fig 5.5.
Fig 5.5: Implementation using GUI
After the classification is implemented in GUI tools, it is further processed in the Proteus software for obtaining the hex file and simulation results. Proteus 8.0 software is used for simulation. It is the best schematic software of all time. The simulation results for various kinds of inputs are discussed in the following sections to classify as normal and abnormal events.
The simulation result when the input from the MATLAB section is 1, then the output obtained is “ABNORMAL” and it is shown in fig 5.6,
Fig 5.6 – Simulation result- MATLAB section is 1 Similarly, the simulation result when both the inputs from the MATLAB section is 0,then the output obtained is “NORMAL” and it is shown in fig 5.9,
Fig 5.9 – Simulation result- MATLAB section is 0 The real time abnormal activity recognition in academic environments is designed using PIC16F877A microcontroller. The code for PIC is written in Embedded C language. The program written in the mikroC PRO for PIC v.5.6.1 is compiled and then uploaded to the PIC16F877A microcontroller.
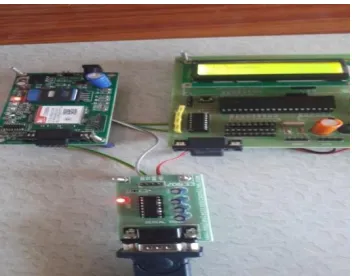
The hardware setup is shown in fig 5.10 and the interfacing of hardware setup with the PC is accomplished using RS232 serial cable and the interfacing part is shown in fig 5.11,
Fig 5.11: Interfacing of hardware setup with PC using RS232 Cable
Initially the video is tested for normal and abnormal events with the help of Matlab. In case of normal event, the serial signal of “1” is passed through the RS232 cable to the hardware kit. The microcontroller then processes, the output to get displayed in the LCD display as “normal”. The result is now shown in fig 5.12,
Fig 5.12: Result of “normal”
Finally the video is tested for normal and abnormal events with the help of Matlab. In case of abnormal event, the serial signal of “0” is passed through the RS232 cable to the hardware kit. The microcontroller then processes, the output to get displayed in the LCD display as “abnormal”. The result is now shown in fig 5.13,
Fig 5.13: Result of “abnormal”
A text message about the abnormal event is send to the corresponding authority. The result is shown in fig 5.14,
Fig 5.14(a): Result of “message sending”
Fig 5.14 (b): Result of “text message as abnormal”
6. PERFORMANCE MEASURE OF A
DATASET
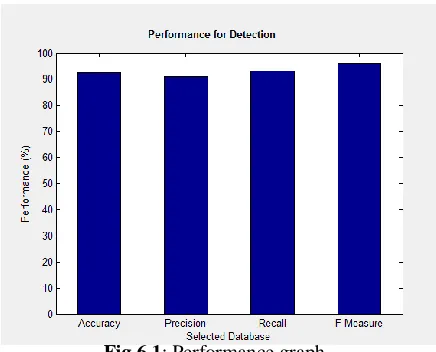
Accuracy refers to the closeness of a measured value to a standard or known value.
Precision is the ratio of the number of relevant action to the total number of irrelevant action in the dataset. It is usually expressed as a percentage. Recall is the ratio of the number of relevant action retrieved to the total number of relevant actions in the database. It is usually expressed as a percentage.
Fig 6.1: Performance graph
7. CONCLUSION
The project work is about the implementation of real time abnormal activity recognition in academic environments using PIC microcontroller and GSM module. The proposed system consists of three modules: normal and abnormal recognition module, embedded main board module and communication module. The real time video can be used as a source and it provides a better results. The normal and abnormal recognition module is implemented in MATLAB platform.
The embedded module comprises of PIC microcontroller PICF877A and is programmed using Embedded C and has a GSM for alerting a message about the abnormal. The communication module mainly involves a RS232 serial cable for interfacing purpose.
Also in this project, the electronic component is of low cost and provides perfect results. It will be a more promising and helpful tool for the security purposes, which applies to any vulnerable and valuable assets.
REFERENCES
[1] Junejo IN, Xiaochun C, Foroosh H (2007) Auto configuration of a Dynamic Nonoverlapping Camera Network. Syst Man Cyber B Cybern IEEE Trans 37:803–816
[2] Duque D, Santos H, Cortez P (2007) Prediction of abnormal behaviors for intelligent video surveillance systems. In: IEEE symposium on computational intelligence and data mining, 2007. CIDM 2007, pp 362–367
[3] Chris Stauffer (2008) Adaptive background mixture models for real-time tracking
[4] Maddalena L, Petrosino A (2008) A self-organizing approach to background subtraction for visual surveillance applications. Image Process IEEE Trans 17:1168–1177 [5] Elarbi-Boudihir M, Al-Shalfan KA (2012) Intelligent
Video Surveillance System Architecture for Abnormal Activity Detection. In: The international J on informatics
and applications (ICIA2012), pp 102–111
[6] Ahad, M.A.R., Tan, J.K., Kim, H., Ishikawa, S.: Motion history image: its variants and applications. Mach. Vision Appl. 23(2), 255–281 (2012)
[7] Yannick Benezeth(2012) Abnormality Detection Using Low-Level Co-occurring EventsPattern Recognition Letters, Elsevier, 32 (3), pp.423-431.
[8] Yahya Chetouani(2013) Use of a Multi-Layer Perceptron Artificial Neural Network (MLP-ANN) for the Dynamic Behavior Modelling pp. 267-278.
[9] Javan RM, Levine MD (2013) An on-line, real-time learning method for detecting anomalies in videos using spatio-temporal compositions. Comput Vis Image Underst 117:1436–1452
[10] Robertas damasecivius (2016) Human Activity Recognition in AAL Environments Using Random Projections. Computational and Mathematical Methods in Medicine