Iran J Public Health, Vol. 48, No.4, Apr 2019, pp.704-712
Original Article
Red Blood Cell Variables in Children and Adolescents regarding
the Age and Sex
*Jasmina PLUNCEVIC GLIGOROSKA
1, Serjoza GONTAREV
2, Beti DEJANOVA
1,
Lidija TODOROVSKA
1, Daniela SHUKOVA STOJMANOVA
2, Sanja MANCHEVSKA
11. Institute of Physiology and Anthropology, Faculty of Medicine, University Ss Cyril and Methodius, Skopje, Republic of Macedonia 2. Faculty of Physical Education, Health and Sport, University Ss Cyril and Methodius, Skopje, Republic of Macedonia
*Corresponding Author: Email: jasnapg65@yahoo.com
(Received 09 Aug 2018; accepted 19 Oct 2018)
Introduction
Having excellent knowledge of the referent val-ues of red blood cells (RBCs) variables with chil-dren and adolescents is profoundly important for proper interpretation of the results of complete blood count. Reference values for RBCs variables are lower with children in comparison with the adults (1). Several studies which investigated
he-matologic parameters have been done in different populations, racial, ethnic and gender subgroups, even in different seasons (2-5). In most of these studies, age, ethnic and sex differences were sig-nificant and therefore it was stressed the need for establishing normal reference values for different populations.
Abstract
Background: This study aimed to assess the basic red blood cell variables and hematological indices in chil-dren and adolescents and analyze the differences regarding age and sex.
Methods: Overall, 320 young participants, age 8 to 18 yr, were enrolled at Laboratory of Sport’s Medicine, Medical Faculty, Skopje, Macedonia in 2016. Capillary blood samples were drawn and following hematologic parameters were measured: the red blood cell count (RBC), hemoglobin concentration (Hb), hematocrit level (Hct) and hematological indexes: mean corpuscular volume (MCV), mean hemoglobin concentration (MCH), mean corpuscular hemoglobin concentration (MCHC) and red cell distribution width (RDW).
Results: RBC variables in male group showed high statistical level of significance between age different groups (P=0.001) for all studied parameters except MCHC (P=0.423) and RDW (P=0.174). ANOVA test and multi-variate tests in female group showed that there was no significant difference for all hematological parameters between age different groups. Regarding the sex differences, male participants had significantly higher red blood count (P<0.001), hemoglobin content (P<0.001) and hematocrit (P<0.001).
Conclusion: Hematological parameters in adolescent as inhomogeneous population are not quantified
suffi-ciently, especially hematological indices. RBC variables, regardless of the age, differ very much between male and female examinees, in favor of the male examinees. Hematological indices were insignificantly higher in males. Regarding the age of examinees, RBC variables showed significant inter-groups differences only within male adolescents. While with girls, ages span 8 to 18 yr, we did not find significant differences for most of the hematological variables.
RBC variables are fairly stable through adult life, but significant differences exist in the pediatric population. The newborn infant, older child, and adult show profound differences (6). Because hemoglobin level and red cell indices vary with age, it is crucial to take as reference standards that change in each period of life, from fetal life to adolescence. Adult value will be reached grad-ually during the second part of childhood, around 15 yr of age (7). To ensure that interpretation of hematology results in children are appropriate, the laboratory has to have established age-specific reference ranges (8).
The sex differences in hemoglobin level in adults are well documented, and the underlying mecha-nisms are probably a direct effect of sex hor-mones, both estrogen and androgens on erythro-poiesis (9). “In pre-pubertal humans no major differences can be found between the sexes in red blood cell count or hemoglobin and serum ferritin concentrations” (10). “The difference in hematological variables between sexes emerges after onset of menstruations and persistent until 10 yr after the menopause” (9, 10). Menstruation and nutritional intake are principal reasons for lower values of hemoglobin and iron of women regarding men (11).
The total amount of hemoglobin increases more in boys than in the girls in the period of puberty (12). Among children 6-14 yr old the values in-creased from about 12 to about 14 gr per 100 ml of blood. In girls between 14 and 20 yr of age, the hemoglobin values decreased slightly, reach-ing 13gr/100ml. In boys of correspondreach-ing ages, there was an increase to about 15gr/100ml. In both sexes, these values were attained at about 20 yr of age and remained characteristic of the third decade of life (13).
A few comparative studies have been conducted on children in pre-adolescent and adolescent years and the lack of studies and information on hematological parameters for this population is obvious. Assessment of RBC variables in young population and determination of normal values is necessary for identification of anemia.
The aim of this paper was to determine the val-ues of RBC variables with young population
from both sexes, within age span 8 to 18 years. Possible differences in the group(s) have to be determined regarding the age difference and be-tween the groups regarding the sex.
Methods
Subjects
Study participants consisted of 300 healthy young individuals (age span 8 to 18 yr) which participat-ed continuously in different kinds of sports activ-ities and were involved in regular medical pre-participation check-ups in 2016. A group with male subjects was composed of 240 participants and female group was composed of 80 partici-pants. Both groups were divided into subgroups regarding the two-year interval: under 10 (U10); under 12 (U12); under 14 (U14); under 16 (U16); under 18 (U18).
Blood collection
The hematological testing was part of complete medical checkup for sports pre-participation screening, during morning hours (from 8:00 to 12:00 am) in a controlled laboratory with con-stant temperature (between 20 C and 24 C) and humidity. To determine the blood count blood samples were collected from capillary vessel using sterile plastic containers with anticoagulant (EDTA K3) incorporated in its walls. An experi-enced evaluator was in charge of the collection procedures. Analysis was determined by automat-ed hematology analyzer ABX Micros 60-OT (ABX hematology, Montpelier, France). The tech-nical error intra rater measurement showed values lower than 1%. Reagents, calibrators, and controls were obtained from the instrument manufacturer. Analysis of samples was performed immediately after blood drawing. The testing was conducted at The Institute of Physiology, Medical Faculty Skop-je, Republic of Macedonia.
Definitions of analyzed hematological pa-rameters(14, 15)
6.1 x 10⁶ cells/mm3; female 4.2-5.4 x 10⁶ cells/mm3.
1. Hematocrit (Hct) is the percentage of blood that is represented by the red blood cells. Normal ranges for hematocrit are strongly dependent on the age, and well de-scribed from newborns to adult age. Optimal values for adult males are between 42% and 54% and for female 38% to 46%.
2. Hemoglobin level (Hb) is expressed as the amount of hemoglobin in grams per deci-liter of whole blood. Adult males should have between 14 to 18 g/dl, adult woman 12 to 16 g/dl.
3. Mean corpuscular volume (MCV) is the mean volume of all the red blood cells in the sample or the average size of the red blood cell. It can be calculated by dividing the hem-atocrit (volume of all RBC) by RBC number. The value is expressed in volume units, femtolitres (fL=10-15 L). The normal range is 80-94fL.
4. Mean corpuscular hemoglobin (MCH) represents the mean mass of hemoglobin in the one red blood cell and is expressed in the mass unit, picograms (pg= 10-12 gr). It is cal-culated by dividing the total mass of hemo-globin by the number of red blood cells. The normal range is 27-31 pg.
5. Mean corpuscular hemoglobin concentra-tion (MCHC) is the mean concentraconcentra-tion of hemoglobin in the red cell or average concen-tration of hemoglobin in one liter of red blood cells. It is calculated by dividing the hemoglobin by the hematocrit. MCHC fulfill the meaning of MCH considering the size of the cell. The normal range is 31.5-35 g/dl. 6. RDW or red cell distribution width is parameter that measures variation in red blood size or red blood cell volume. The reference ranges for RDW for adult is 11.6%-14.6%.
Ethics
Institutional ethical approval was received from the Ethics Committee of the Medical Faculty, Ss Cyril and Methodius University, Skopje, Republic
Macedonia (No=03-1197/5). Informed consents were obtained from the parents.
Statistical Analysis
Statistical analysis as performed using the com-puter software SPSS for Windows version 14.0 (SPSS Inc., Chicago, USA). Analysis of variance factorial analysis and post hoc multiple compari-sons were used to evaluate the significance of the differences. Differences in proportions were ana-lyzed using the Chi-square test or Fisher’s exact test when appropriate. All data were presented as mean (SD). Results were considered to be statis-tically significant when P-value was less than 0.05 (P<0.05).
Results
Hematologic parameters in males
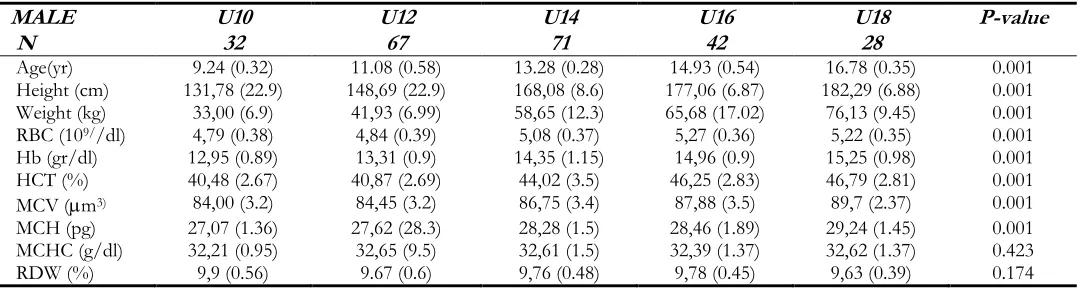
The mean value and standard deviations for gen-eral features (age, height and weight) and hemato-logic parameters (RBCs- red blood cells; Hb- hemoglobin, Hct – hematocrit; and hematological indices: MCV, MCH, MCHC and RDW) for group of male participants (N=240) are present-ed in Table 1. All parameters are shown for five age different subgroups. High statistically signifi-cant difference is found for all general features of participants: age, height, and weight.
Values are mean (SD): RBC- red blood cell count, Hct,- packed cell volume, Hb - hemoglo-bin concentration, MCV- mean corpuscular vol-ume, MCH- mean corpuscular hemoglobin, MCHC - mean corpuscular hemoglobin concen-tration, RDW- red cell distribution width
MCHC and RDW. The similar situation is within U16 and U18 group. They have insignificantly different results between themselves (for RBC, Hb, Hct, MCV, MCH) and significantly higher mean values for these parameters from the
younger groups. The subjects from U14 group showed statistically higher means for hematologi-cal parameters than U10 and U12 group, but sta-tistically lower means than U16 and U18 group.
Table 1: General characteristics and hematologic parameters of the male participants (8-18 yr, N=240) for age dif-ferent subgroups
MALE U10 U12 U14 U16 U18 P-value
N 32 67 71 42 28
Age(yr) 9.24 (0.32) 11.08 (0.58) 13.28 (0.28) 14.93 (0.54) 16.78 (0.35) 0.001
Height (cm) 131,78 (22.9) 148,69 (22.9) 168,08 (8.6) 177,06 (6.87) 182,29 (6.88) 0.001
Weight (kg) 33,00 (6.9) 41,93 (6.99) 58,65 (12.3) 65,68 (17.02) 76,13 (9.45) 0.001
RBC (109//dl) 4,79 (0.38) 4,84 (0.39) 5,08 (0.37) 5,27 (0.36) 5,22 (0.35) 0.001
Hb (gr/dl) 12,95 (0.89) 13,31 (0.9) 14,35 (1.15) 14,96 (0.9) 15,25 (0.98) 0.001
HCT (%) 40,48 (2.67) 40,87 (2.69) 44,02 (3.5) 46,25 (2.83) 46,79 (2.81) 0.001
MCV (m3) 84,00 (3.2) 84,45 (3.2) 86,75 (3.4) 87,88 (3.5) 89,7 (2.37) 0.001
MCH (pg) 27,07 (1.36) 27,62 (28.3) 28,28 (1.5) 28,46 (1.89) 29,24 (1.45) 0.001
MCHC (g/dl) 32,21 (0.95) 32,65 (9.5) 32,61 (1.5) 32,39 (1.37) 32,62 (1.37) 0.423
RDW (%) 9,9 (0.56) 9.67 (0.6) 9,76 (0.48) 9,78 (0.45) 9,63 (0.39) 0.174
Table 2: General characteristics and hematologic parameters in female participants (8-18 yr, N=80) for age different subgroups
Variable U10
U12 U14 U16 U18 ANOVA, P
N 10 18 18 20 14
Age(yr) 9.11 (0.42) 10.98 (0.56) 13.12 (0.25) 14.73 (0.51) 16.81 (0.45) 0.001
Height (cm) 133,87 (9.5) 149,34 (10.8) 162,46 (6.3) 164,71 (4.3) 170,25 (7.1) 0.001
Weight (kg) 32,0 (8.29) 44,78 (10.3) 51,85 (7.86) 58,18 (9.3) 62,94 (13.4) 0.001
RBC (109//dl) 4,99 (0.39) 4,71 (0.22) 4,71 (0.46) 4,68 (0.55) 4,59 (0.26) 0.349
Hb (gr/dl) 12,98 (1.26) 13,33 (1.0) 13,08 (1.38) 12,92 (1.1) 13,49 (1.5) 0.800
Hct (%) 40,61 (3.53) 40,50 (3.2) 40,72 (3.75) 40,6 (3.4) 41,27 (3.33) 0.990
MCV (m3) 81,75 (6.86) 86,25 (34.3) 82,43 (17.5) 87,0 (7.0) 89,75 (3.85) 0.362
MCH (pg) 26,15 (2.74) 27,98 (2.1) 28,25 (3.43) 27,62 (3.16) 29,32 (2.08) 0.253
MCHC (g/dl) 31,94 (0.97) 32,69 (1.3) 30,59 (6.2) 30,18 (6.38) 32,61 (1.12) 0.490
RDW (%) 9,94 (0.58) 9,89 (0.65) 9,82 (0.88) 10,15 (0.78) 10,16 (0.61) 0.712
Values are mean (SD): RBC- red blood cell count, Hct,- packed cell volume, Hb - hemoglo-bin concentration, MCV- mean corpuscular vol-ume, MCH- mean corpuscular hemoglobin, MCHC - mean corpuscular hemoglobin concen-tration, RDW- red cell distribution width
Hematologic parameters in girls
The mean values and standard deviations for general features and hematologic parameters for group of female participants are presented in Ta-ble 2. All parameters are shown for five age
Table 3: Comparison of hematologic parameters of physically active boys (N=240) and girls (N=80)
Variable groups mean SD SE 95% Confidence Interval for
Mean Lower
Bound Upper Bound f sig
RBC (1012/dl)
boys 5.02 0.42 0.274 4.97 5.08 24.450 0.001
girls 4.72 0.41 0.526 4.62 4.83
Hb
(gr/dl) boys girls 14.08 13.15 1.29 1.19 0.084 0.155 13.92 12.84 14.25 13.46 25.617 0.001
Hct (%) boys 43.37 3.85 0.249 42.88 43.86 23.622 0.001
girls 40.69 3.33 0.437 39.82 41.57
MCV (m3) boys 86.27 4.03 0.261 85.75 86.78 1.115 0.292
girls 85.40 9.87 1.274 82.85 87.95
MCH (pg) boys 28.07 1.83 0.118 27.84 28.31 0.335 0.563
girls 27.90 2.84 0.374 27.15 28.65
MCHC
(g/dl) boys girls 32.53 31.51 1.23 4.37 0.079 0.574 32.38 30.36 32.69 32.66 9.978 0.002
RDW (%) boys 9.75 0.49 0.319 9.68 9.81 8.496 0.004
girls 9.98 0.72 0.943 9.79 10.17
Values are mean, SD-standard deviation, SE-standard error.
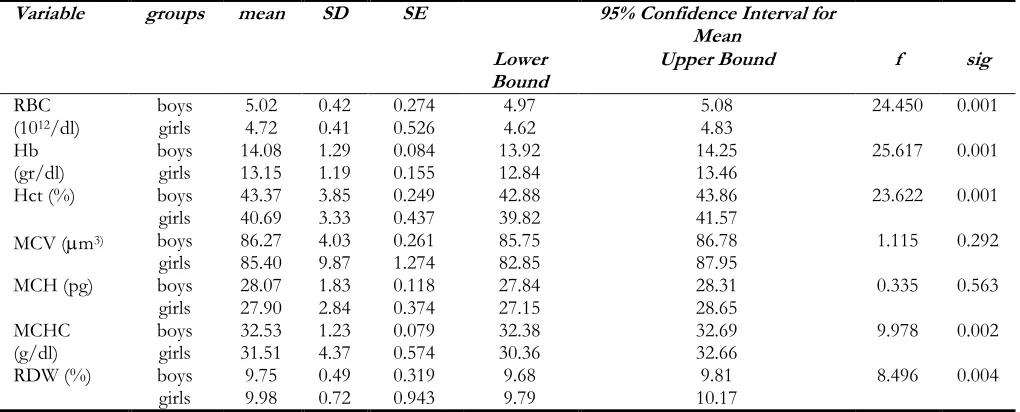
Comparison of red blood cell parameters by sex
The comparison of the hematologic parameters for total male and female group is presented in Table 3. All studied parameters, except MCV and MCH, showed sex-related differences. Analysis of variance factorial analysis applied to the whole male and female groups showed that male partic-ipants have significantly higher red blood count (P<0.001), Hemoglobin content (P<0.001) and hematocrit (P<0.001). No differences were found for mean corpuscular volume (MCV) and mean concentration of hemoglobin in one red blood
cell (MCH), (P=0.292; P=0.563). MCHC, mean corpuscular concentration of hemoglobin in 1 L of RBC was significantly higher in boys (P=0.002) and RDW, the range of red blood cells width distribution were significantly wider in girls (P=0.004).
The frequency of hemoglobin concentration is fewer than the lower boundary in nominal values, 12g/dl. With the boys, 4.6% showed subnormal values, i.e. the rest 95.4% used to have normal values. Frequency of suboptimal values of Hb with girls (13.3%) was significantly higher than with the boys (P=0.013) (Table 4).
Table 4: Frequency of normal and low hemoglobin concentration in boys and girls
Variable Hb lower than 12g/dl Hb normal values Total Chi-square test
(Pearson)
Male Count 11 229 240 0.013
% 4.6% 95.4% 100%
Female Count 8 52 60
% 13.3% 86.7% 100%
Total Count 19 281 300
% 6.4% 93.6% 100%
Hb – hemoglobin
Discussion
In the Republic of Macedonia, there are no elab-orate studies used as local reference ranges for
varia-bles values. The results of the present study sup-port findings resup-ported by number of authors that the red blood cell variables undergo age different changes in adolescents, and sex-related difference between boys and girls.
Dependence of the hematologic parameters of age
Children’s reference ranges for routine hemato-logical testing are usually stratified as reference values for newborn at birth, at 2 wk, 4 wk, 2-6 months, 6 months to year, 1 to 6 yr and 6-12 yr, for both sexes. Reference values for children old-er than 12 yr are diffold-erent for male and female subjects (16). Some authors suggest different ref-erence values for hematologic parameters for girls and boys after 13 yr of age (17). In this paper we decided to divide the examinees from 8 to 18 yr of age, into age different groups from 2-year intervals, groups.
The mean values for RBC, Hct, Hb, MCV and MCH in male group showed tendency of increas-ing with the growth of the age. These parameters in groups U10 and U12 show significantly lower values than other (older) groups, and U16 and U18 show higher values for these parameters from other (younger group). Therefore, the U14 group has significantly higher values for most of the hematologic indices than U10 and U12, and significantly lower values than two older groups U16 and U18. These data indicate that boys older than 12 but younger than 14 year of age, are in the intermediate period regarding the hematolog-ical parameters.
As far as the hematological indices with the male participants are concerned, the average size of erythrocyte (MCV) grows with the age. Average content, mass of hemoglobin in one erythrocyte (MCH), also grows gradually, with significantly highest values with U18, but with boys younger than 12 (U10 and U12) and boys older than 12 (U14, U16 and U18) there is a significant differ-ence. The average concentration of hemoglobin in one erythrocyte (MCHC) does not show intergroup difference because the size of the cell is taken into consideration. The explanation is simple, with the age of the young examinees, the
size of the cell grows and the average content of hemoglobin in it. But their ratio, i.e. concentra-tion of hemoglobin in the cell remains approxi-mately the same. Another parameter, RW, which describes the span of the size of different eryth-rocytes shown in percentages, does not show mutual difference which leads to equality of the size of erythrocytes in all different groups.
U14, U15, and U16 groups, except for the RBC variable (20). Hemoglobin contents and the RBCs gradually rise to adult levels by the age of puberty (21). Investigation of hematological parameters in population 1 to 14 yr of age in Bangladesh showed difference between age groups and no difference was found between two sex groups (22).
Dependence of hematologic parameters of sex
Men and women have different mean hemoglo-bin levels in health in venous blood — women have mean levels approximately 12% lower than men. Since no difference is noticed in the level of erythropoietin with different sexes, the difference in the intensity of erythropoiesis comes from the physiological changes in the kidneys not in bone marrow (9). There is no evidence showing re-duced cellular mechanisms for hem synthesis in women, and there is no difference in the iron ab-sorption between women and men (23). The es-tablished reference ranges for woman are under the influence of large proportion of those with iron deficiency. (11). The difference in hemoglo-bin concentration regarding sex has not been found in infants and preschool children (24), but it has been shown in teenagers and adolescents (25). In our research, we compare the hematological parameters with male and female examinees, as well as whole groups regardless of their age. The male examinees showed significantly higher val-ues of RBC (5.02 *1012/l vs 4.72 *1012/l; P<0.001); higher values of Hb (14.08 g/dl vs
13.15 g/dl; P<0.001); Hematocrit (43.37% vs 40.69%; P<0.001). The average size of red blood cells (MCV) and medium content of Hb in them (MCH) insignificantly higher with the boys. Due to the similar size of the cells and higher total amount of hemoglobin with the males, MCHC, concentration of Hb in erythrocyte, is higher with the boys (P=0.002). The size span of erythrocytes is wider with the girls which lead to bigger varia-bility of the erythrocytes size.
For the clinical reference values of RBC, Hb, and Hct no sex differences were observed bellow the age of 12. The values for males were significantly higher than in females in the age range 13-79
(26). Unusual results are reported regarding the hematologic indices in male and female children younger than 12 yr. Mean Hb, Hct, MCV, and MCH of school-aged boys were significantly low-er than girls (27). In the survey on haemoglobin level in the different age groups in man and woman in Indian population in the group aged 12 to 19 yr, males showed Hb mean concentration of 11.76 g/dl and female showed higher mean value, 12.31 g/dl (28). The research on hemato-logical indices in in Kuwaiti children aged 7-12 yr, were RBC=4.780.42; Hb=127.39.4 /dl for boys and RBC=4.70.4; Hb=126.99.8 /dl for girls. Same parameters for older children, 13-17 yr, were RBC=5.180.48; Hb=14514.4 /dl for boys and RBC=4.680.43; Hb=129.69.8 /dl for girls (29). As we can see these results are con-cordant with ours, regarding the sex differences (in favor of boys), and regarding the existing sub-stantial age difference in male group and no age difference in female group.
Normal hemoglobin levels according to WHO for children aged 5-12 yr above 11.5 gr/dl and teenag-ers aged 12-15 yr equal or above 12g/dl. Above 15 yr the adolescent are referred to as adults, and normal Hb level for adult male is 13.8-17.2 g/dl, and for adult female 12.1- 15.1 g/dl (30).
The primary aim of analyzing red blood cells var-iables is to discover and diagnose type of anemia in case it is present. Anemia was defined as he-moglobin concentration <11g/dL for children aged between 6 and 59 months, while 11.5 g/dl for children aged 5 and 11 yr and < 12 g/dl for children older than 12 yr according to WHO (30). As a lower boundary of nominal values for hemoglobin concentration in our laboratory is considered the value of 12 g/dl. In our laboratory that value is the same for both children and adults. Only 4.6% of our male examiners had low values of hemoglobin, and much more in the fe-male group 13.3%.
Conclusion
special emphasis that hematological variables in boys aged 12 to 14 yr have the intermediate val-ues between those with pre-puberty (<12 yr) to-wards those adolescent boys (>14 yr). RBC vari-ables with girls from different age subgroups did not show significant differences. Significant dif-ference is found only in red blood cell counts between the oldest (U18 group) and youngest (U12 group) in favor of the younger girls. RBC variables, regardless of the age, differ very much between male and female examiners, in favor of the male examinees. Hematological indices were insignificantly higher in males.
Ethical considerations
Ethical issues (Including plagiarism, informed consent, misconduct, data fabrication and/or fal-sification, double publication and/or submission, redundancy, etc.) have been completely observed by the authors.
Acknowledgements
The researchers want to thank the Institute of Physiology, Medical Faculty, UKIM, Skopje, and all the people who had been involved in this study.
Conflict of interest
The authors declare that there is no conflict of interests.
References
1. World Health Organization, 2008. Worldwide prevalence of anaemia 1993-2005. Geneva: WHO. ISBN 978-92-2-159665. Archived from the original on 12 March 2009.
2. Kaestner L, Bogdanova A (2014). Regulation of red cell life span, erythropoiesis, senescence and clearance. Front Physiol, 5:269.
3. Evans DM, Frazer IH, Martin NG (1999). Ge-netic and environmental causes of variation in basal levels of blood cells. Twin Res, 2(4):250-257.
4. El-Hazmi MAF, Warsy AS (2001). Normal ref-erence values for haematological parameters, red cell indices, HbA2 and Hbf from early childhood through adolescence in Saudis.
Ann Saudi Med, 21(3-4):165-169.
5. Taylor MR, Holland CV, Spencer R et al (1997). Haematological reference ranges for school children. Clin Lab Haematol, 19(1):1-15. 6. Roda k BF, Fritsma GA (2002). Hematology:
Clini-cal Principles and Applications. Elsevier Health
Sciences, Amazon.com
7. Tchernia G (1989). [Erythropoiesis and erythro-cytes in children, physiology and standards].
Rev Prat, 39(24): 2111-6.
8. Greenway A, Monagle P (2004). Abnormal haematology results in children. Aust Prescr, 27: 64-61.
9. Murphy WG (2014). The sex differences in haemoglobin levels in adults - Mechanisms, causes, and consequences. Blood Rev, 28(2):41-47.
10. Wish JB (2006). Assessing iron status: Beyond serum ferritin and transferrin saturation. Clin J
Am Soc Nephrol, 1(1):S4-S8.
11. Rushton DH, Dover R, Sainsbury AW, Norris MJ (2001). Why should woman have a lower reference limits for hemoglobin and ferritin concentrations than men? BMJ, 322(7298): 1355-1357.
12. Lakshmi A, Govindaraj J (2015). Correlation of Haemoglobin with Body Mass Index in Male and Female Medical Students in North East Karnataka. Biosci Tech, 6(3): 709-712.
13. Hawkins WW, Speck E, Leonard VG (1954). Variation of hemoglobin level with age and sex. Blood, 9:999-1007.
14. Henry JB (1996). Clinical Diagnosis and management
by Laboratory Methods. W.B. Saunders Co, New
York.
15. Chernecky C, Berbger B (2001). Laboratory Tests
and Diagnostic Procedures, 3rd ed. W.B. Saunders
Company, Philadelphia.
16. Children’s reference ranges for FBC, Q Pulse
Reference No: HA/WE/003.
https://www.childrensmn.org/references/la b/hematology/cbc-reference-value-table.pdf 17. Appendix B, Pediatric Normal Laboratory
18. Romeo J, Warnberg J, Gomez-Martinez S et al (2009). Haematological reference values in Spanish adolescents: the Avena study. Eur J
haematol, 83(6):586-94.
19. Lugada ES, Mermin J, Kaharuza F et al (2004). Population-based hematologic and immuno-logic reference values for healthy Ugandan population. Clin and Diagn Lab Immunol, 11(1): 29-34.
20. Joksimovic A, Stankovic D, Ilic D et al (2009). Hematological profile of Serbian youth na-tional soccer teams. J Hum Kinet, 22: 51-60. 21. Maude GH, Hayes RJ, Sejeant GR (1987). The
hematology of steady state homozygous sickle cell disease: interrelationships between hema-tological indices. Br J Haematol, 66(4):549-558. 22. Absar MN (2012). Hemoglobin level in children
of northern district of Bangladesh. Journal of
Bangladesh College of Physicians and Surgeons,
30(3):127-131.
23. Hallberg L, Hulten L, Gramatkovski E (1997). Iron absorption from the whole diet in men: how effective is the regulation of iron absorp-tion. Am J Clin Nutr, 66 (2): 347-56.
24. Domelof M, Dewey KC, Lonnerdal B et al (2002). The diagnostic criteria for iron defi-ciency in infants should be reevaluted. J Nutr, 132(12): 3680-3686
25. Nicklas TA, Frank GC, Weber LS, et al (1987). Racial Contrasts in Hemoglobin Levels and Dietary Patterns Related to Hematopoiesis in Children: The Bogalusa Study. Am J Public
Health, 77(10):1320-1323.
26. Shiqa S, Koyanagi I, Kanuagi R (1990). [Clinical reference values for laboratory hematology tests calculated using iterative truncation method with correction: Part 1. Reference values for erythrocyte parameters including MCV, MCH, MCHC and RDW]. Rinsho
Byori, 38(1): 93-103.
27. Behera S, Bulliyya G (2016). Magnitude of ane-mia and hematologic predictors among chil-dren under 12 years in Odisha, India. Anemia, 1729147.
28. Ayyana Y, Naayudu Y (2013). Survey on hemo-globin level in the different age groups of male and femae human beings in the rural and urban area. Int J Ph Sci, 5(2): 2086-2089 29. Hasan Al-Jafar (2016). Provisional Kuwaiti
chil-dren hematology reference range. J Hematol
Thromb, 2(2):1-6.