HYPOGLYCEMIA AND BRAIN DEVELOPMENT
H. Peter Chase, M.D., Robert A. Marlow, B.A., Carol 5. Dabiere, B.S.,and N. Noreen Welch, B.A.
From the University of Colorado Medical Center, Denver, Colorado
ABSTRACT. Though hypoglycemia has been a common clinical condition known to affect human brain development, little has been done to define the resultant brain biochemical alterations. Because a controlled study of hypoglycemia in the newborn human infant is impossible, the infant rat was chosen as a model. Hypoglycemia induced once daily for 18 days following birth resulted in a generalized diminution of brain weight, cellularity, and protein content. The rate of formation of the
myelin lipid sulfatide was decreased, as was the quantity of cerebroside-sulfatide in brains of hypo- glycemic animals. Phospholipids, gangliosides, and cholesterol were decreased only in proportion to the decrease in brain weight. Brain glucose and glycogen concentrations were low in the brains of hypoglycemic animals, although ATP and phos- phocreatine levels were not decreased. Pediatrics, 52:513, 1973, HYPOGLYCEMIA, BRAIN DNELOP- h l E h T , BRAIN DNA, BRAIN PROTEIN, BRAIN LIPIDS.
Brain damage in human infants has been associated with neonatal hypoglycemia, particularly when not treated early and when the infants are sy~nptomatic.l-~ The incidence of hypoglycemia in term infants appropriate for gestational age ( A G A ) is lO!Z and in term infants small for gesta- tional age (SGA) is 25%; preterm AGA in- fants have an incidence of 15% and preterm SGA infants
67%.=
In addition to neonatal hypoglycemia related to gestational age and size, infants of mothers with diabetes or toxemia and infants with hereditary metabolic or endocrine disorders have an increased incidence of hypoglycemia. Clini- cal problems associated with hypoglycemia have been thoroughly r e v i e ~ e d . ~ The pur- pose of the present study was to evaluate the biochemical changes occurring in the brain as a result of hypoglycemia.Previous studies have demonstrated alterations in brain amino acids in fasted hypoglycemic adult Pathologic studies in rats following insulin injections have shown neuronal changes primarily in
the cerebral cortex and hippocampus." Neurologic and pathologic alterations re- sulting from hypoglycemia had been studied in adult rhesus The pathologic studies have shown primarily involvement of the cerebral cortex, particu- larly of the posterior halves and the deep s ~ l c i . ' ~ ~ ~ ~ The pathologic changes in mon- keys, as in adult h u m a n ~ , l ~ - ~ ~ have re- sembled those of anoxia. In three infants in whom hypoglycemia was considered a major cause of death, but who also suffered from other problems, extensive degenera- tion of nerve cells throughout the nervous system was d e s ~ r i b e d . ~ ~ In three other in- fants the reduction in nerve cells was pri- marily in the cerebral cortex, basal gang-
Abbreviations
AGA: Appropriate for gestational age
NANA: N-acetyl-neuraminic acid SGA: Small for gestational age
(Received February 20; revision accepted for publication April 10, 1973.)
This study was supported by grant NS 07537-05 from the National Institute of Neurologic Disease and Stroke, National Institutes of Health, Bethesda, Maryland.
Dr. Chase is the recipient of a Career Research Development Award IK4 HD-38,839-04 from the Na- tional Institute of Child Health and Human Development.
This paper was presented in part to the Western Society for Pediatric Research in Camel, California, February 1973.
ADDRESS FOR REPRINTS: (H.P.C.) University of Colorado Medical Center, 4200 Ninth Avenue, Denver, Colorado 80220.
lia, and thalamus.22 In addition to the path- ologic studies, alterations in EEG's have been described in infants of diabetic mothers23 and in monkeys following hypo- glycemia.12 The present study examines the influence of once daily hypoglycemic episodes in infant rats on brain weight, cellularity, protein content, lipid formation and content, and on brain energy reserves.
METHODS
Nursing litters of Sprague-Dawley rats were reduced to six pups at birth, three for daily insulin injections
(50
units/kg of body weight subcutaneously) and three to receive a similar volume of 0.9% sodium chloride. In initial experiments, serum glu- cose levels following insulin injections were measured by the glucose oxidase method2' in 10-day-old rat pups to determine the severity and duration of hypoglycemia. In all other experiments, injections were once daily from the age of 1 day to the day of death. Pups were returned to their mother immediately following the injections. In two litters the pups were not returned to the mother until the test pups had recov- ered from their hypoglycemic seizures, and the control pups were then kept away for one to two hours longer than the test pups to keep all body weights identical.Animals were killed by decapitation ex- cept when levels of brain glucose, glycogen, ATP, and phospocreatine were to be deter- mined and they were then killed by immer- sion into liquid nitrogen as previously d e s ~ r i b e d . ~ ~ For determination of DNA and protein, the cerebellum was dissected free of the remainder of the brain. DNA was determined by the method of Zamen- hof et ~ 1and protein by the method of . ~ ~ Lowry et aL2' with modifications as previ- ously noted.28
Sodium sulfate," 0.32 ,uCi/gm of body weight, was injected intraperitoneally into 12 control and 8 test animals to determine the rate of brain sulfatide formation. The radioactive sulfate ( ) was injected at
*
New England Nuclear, Boston, Massachusetts.age 18 days, after the test animals had re- covered from hypoglycemia, and animals were not given further insulin injections prior to sacrifice at age 19 days. Incorpora- tion of radioactive label into brain lipids was determined as previously des~ribed.~"
Brain lipids for quantitative analyses were extracted as described by Rouser et CZZ.,~'' and separated by Unisilt column chromatography. Cholesterol was quanti- tated from the chloroform eluate (fraction one), cerebroside and sulfatide from the acetone eluate (fraction two), and phospho- lipid and lipid NANA from the methanol eluate (fraction three). Column fractions were monitored by thin layer chromatogra- phy to verify that there was no fraction overlap. Quantitative lipid analyses were done using methods previously des~ribed.~'
ATP, phosphocreatine, glycogen, and glucose were determined on brain tissue pulverized in the frozen state as described by Lowry et al.25 Duplicate samples of approximately 100 mg of brain powder were weighed and transferred to a 2-ml homogenizer with 0.3 ml of 3M perchloric acid frozen in the bottom. The samples were allowed to thaw while the tubes were swirl- ed in a 1:l water-methanol solution at -10' for three minutes. To remove any bone calcium contamination, 1.25 ml of
1
mM ethylenediamine tetraacetic acid disodium salt (EDTA), pH 7.25 was added. Follow- ing homogenization 100 samples were re- moved in duplicate for determination of glycogen (see below). The remaining ho- mogenate was centrifuged in a refrigerated centrifuge at 18,000 x g. One milliliter of supernatant was then brought to a pH of 7.5 with tris buffer and4N
potassium hyd- roxide, and the sample was again centri- fuged for 30 minutes at 18,000 x g. Glu- c o ~ e , ~ ~ ATP,3%nd phosphocreatineSS were then determined on the supernatant as pre- viously described. The glycogen samples taken from the original homogenates were hydrolyzed in 1 N hydrochloric acid for515
ARTICLESthree hours at 100'. The samples were then BLOOD GLUCOSE
filtered, adjusted to pH
7.5,
-and the total- hydrolyzed glucose determined as above. Total hydrolyzed glucose minus the free glu- cose represents glucose primarily from gly- cogen.lUThe Student's t-test was used for statis- tical analyses. In an attempt to further eval- uate the influence of body weight on changes in brain weight, cellularity, and protein content, control and test pups of identical body weights were matched and these three parameters compared using the t-test for paired samples.34
RESULTS
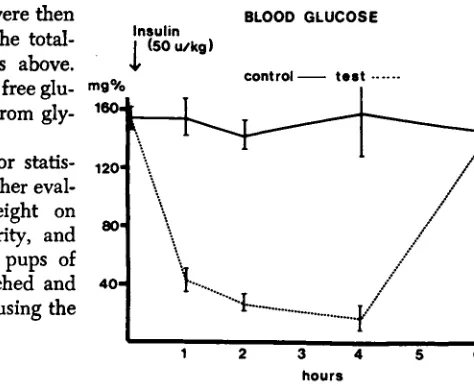
Initial studies showed that blood glucose levels decreased markedly in the first hour after insulin injection, and remained low for at least four hours in animals receiving a dose of insulin of 50 units/kg of body weight (Fig. 1 ) . Glucose levels rose to nor- mal within four hours when animals re- ceived only 10 unitslkg and a dose of 100 unitslkg resulted in a high mortality. As 50 unitslkg of body weight was compatible with normal body growth and produced sus- tained hypoglycemia, it was used through- out the study.
Body weights were not statistically dif- ferent in the control and hypoglycemic ani- mals (Table I ) . Total brain wet weight was significantly decreased ( p
<
.01) in hypoglycemic animals, as were cortex-brain stem and cerebellar wet weights (Table I ) . Total DNA was significantly reduced ( p<
.01) in both the cortex-brain stem and cerebella of brains from hypoglycemic ani- mals (Table 11). Total protein content was also reduced ( p< . O l )
in both the cortex- brain stem and cerebella of test animals (Table 11).Cell size, as indicated by the ratio of brain weight or protein to DNA was not statistically altered in either the cerebellum or cortex-brain stem. When control and test animals were paired on the basis of having identical body weights, the differences in brain weight, DNA, and protein content remained statistically lower
Insulin
1
(50 u/kg)control
-
test --.--- I1 2 3 hours 4 5 6
FIG. 1. Changes in blood glucose levels following injection of insulin, 50 unitsdg of body weight, subcutaneously (
---
) ; control animals (-
1 received a similar volume of saline. Each point represents at least four animals studied and thevertical lines represent 1 SD.
( p
<
.01) in the test animals. In the two litters in which control pups were kept from the mothers for a longer period than the test pups, to keep littermate body weights identical, the brain weight, DNA, and protein were again statistically lower( p
<
.Ol ) in the hypoglycemic pups.The total brain quantities of cerebroside- sulfatide, cholesterol, and lipid phosphorous were statistically reduced in hypoglycemic animals (Table I11 )
.
The concentrations of these three lipids were not statistically reduced ( p>
.05). The total quantity and the concentration of lipid NANA, repre- senting ganglioside content, were not statis- tically different in control and test animals. Sulfate incorporation into brain sulfatide at age 18 days was 44% lower ( p<
.01) in brains of hypoglycemic animals compared to controls (Table 111).Number of Bod F Total Brain Cortex-Brain Stem Cerebellum
Animals Weight Wezght Weight Weight
Control 18 43.1 1.454 1.249 0.175
f 5 . 8 f 0.081 f 0.055 +0.017
Hypoglycemic 13 37.5 1.292 1.150 0.144
+4.4
- - +0.090 f 0.062 f0.014
p value >.05 <.01 <.01 <.01
TABLE I1
BRAIN DNA A N D PROTEIN I N CONTROL A N D HYPOGLYCEMIC ANIMALS
I I N A (mg ) Protein I m g ) Cell Size
Cortex-Brain Stem Cerebellum Cortex- Ctre- Cortex- Cere-
Brain bellum Brain bellum Weight ( g m ) Protein ( m g ) Weight ( g m ) Protein ( m g ) Stem Stem D N A ( m g ) D N A f m g ) D N A ( m g ) D N A ( m g )
Control 18* 1.24 1.19 94.6 12.8 1.01 76.3 0.15 10.7
50.08 f0.12 f 7 . 6 f 2 . 0 f0.04 f 5.6 f 0.0 I f 1.0
Hypoglycemic 1.08 1.00 86.1 10.9 1.02 80.1 0.14 10.8
13* 50.04 f0.10 f 4 . 5 4 fO.05 f 4.3 f 0.01 f 0.6
p value <.01 <.01 <.01 <.01
>
.05>
.05>
.05>
.05* Number of animals.
TABLE 111
BRAIN LIPID FORMATION IN HYPOGLYCEMIC RATS*
36&'o~
Cerebrosidelncmpmation Sulfnt ide Cholesterol Lipid Phosphorous Lipid N A N A
*g "'A' "'g mg mg mg mg
C P M l g m W e t
mSt
~~~-~~~
Weight of Brain gm Brain gm Brain gm Brain g m Brain
Control 33,643 4.62 6.90 11.50 17.17 1.67 2.49 0.70 1.04
f 10,762 50.23 50.44 5 0 . 6 6 zk0.98 50.06 50.06 f0.02 f 0 . 0 4
Hypoglycemic 18,970 4.12 5.40 11.45 14.98 1.68 2.20 0.69 0.90
f 6,284 f 0.65 f 1 . 0 1 f 0 . 3 6 50.85 50.09 rt0.16 50.07 zkO.11
p value <.01 >.05 <.05 >.05 <.02 >.05 <.02 >.05 >.05
Ojo Decrease 44 11 22 . .
.
13 . . . 12. . .
13ARTICLES
TABLE IV
.\o. of Samples G l u c o s ~ G l ~ c o s e n A T P Phosphocreaf~nc
--
Control 4 0.83 3.03 2.27 1.58
f O . l l k0.35 f 0 . 5 3
+
0.65Hypoglycernic 4 0.07 1.96 1.92 3.19
+
0.04 k0.57 k0.36 20.77p value <.01 < .05 >.05 < .02
*
.\I1 values are expressed in ccmoles/grn wet weight of brain.DISCUSSION
In a review of the literature, other studies dealing with biochemical altera- tions in brain cellularity, protein, and lipids secondary to hypoglycemia were not found. Brain cellularity is estimated biochemically by measuring total DNA, assuming a con- stant amount of DNA per cell. The de- crease in weight, DNA, and protein in both the cortex-brain stem and the cerebellum suggests diffuse brain biochemical altera- tions resulting from hypoglycemia. These findings agree with the pathologic descrip- tion of "extensive degeneration of nerve cells throughout the central nervous sys- tem" previously described in three infants dying from untreated hypoglycemia.?'
There were no statistical differences in body weights between control and hypogly- cemic animals. The biochemical alterations were more diffuse following hypoglycemia than have been described following under- nutrition, where the reduction in brain weight, DNA, and protein is primarily in the c e r e b e l l ~ m . ~ ~ 3 5 3 36 Further precautions
were taken, however, to rule out undernu- trition as an etiologic factor in this study. When pups were randomly paired on the basis of having identical body weights, the brain weight, DNA, and protein remained statistically lower in the test pups. Also, when control pups were kept from the nurs- ing mother for longer periods during the day than test pups to keep body weights identical, statistical differences in these three brain parameters again were found.
Generalized undernutrition would thus not appear to be an important factor in the present study.
Sulfatide is found in higher concentra- tions in myelin than throughout the re- mainder of the brain and has thus been used as a marker of myelin formation. Labeled sufate incorporation into brain in 18-day-old rats has been shown to be pri- marily into the sulfatide of m ~ e l i n . ~ ~ The decreased rate of myelin lipid formation in 18-day-old pups was shown by the marked reduction in radioactive sulfate incorpora- tion into brain lipids (Table 111). This represents the rate of sulfatide formation in the 24 hours following injection, whereas the quantitative cerebroside-sulfatide levels are a reflection of a longer period of devel- opment. Total cerebroside-sulfatide levels were reduced to a greater extent (22%) than brain weight, cellularity, or other lipids, (13%) again suggesting a greater reduction in myelin lipids.
Phospholipids and cholesterol are found in membranes throughout the brain, and the decrease of 12% to 13% in the total brain levels of these lipids, but not in their con- centrations, reflects the generalized reduc- tion in brain weight and cellularity. Mean lipid NANA levels showed a similar percent decrease, and are used as an estimate of gangliosides, which are located primarily within neurons.
were also observed by King et
~
1
in adult.
~
~
mice given a similar dose of insulin to the dose used in this study. Tarr et~
1
also.
~
~
found no fall in brain ATP and phospho- creatine levels after insulin injections in in- fant rats. As insulin does not apparently cross the blood-brain the de- creased brain glucose and glycogen levels are likely a reflection of the reduced blood glucose levels (Fig. 1). Direct intracisternal injection of insulin, without lowering of blood glucose, has been shown to increase brain glycogen content.42 Current concepts of brain metabolism consider glucose the major substrate utilized by the developing brain, and the reductions of brain protein and lipids resulting from hypoglycemia may be a result of decreased brain substrate availability. Other effects of hypoglycemia, such as secondary changes in other hor- mone levels, may also be damaging to the central nervous system.Studies in laboratory animals obviously necessitate caution when extrapolating the results to humans. We do not yet know the duration or number of hypoglycemic epi- sodes that will result in brain alterations. Studies in the monkey have shown neuronal mitochondria1 swelling following 15 to 30 minutes of hypogly~emia.'~ Initial studies in our laboratory in rat pups made hypogly- cemic between 5 and 18 days after birth have shown similar alterations to those oc- curring in the present study following once daily insulin injections for the first eight days after birth. This period in rat brain development is approximately similar to human brain development in the six months following birth in regard to DNA and myelin lipid formation and represents the time of most rapid brain growth for both specie^.'^ It is likely that hypoglycemia would not have a similar effect on cellular- ity or other biochemical parameters mea- sured in this study if studied after the period of rapid brain growth. Pathologic studies of infants dying following hypogly- cemia have indeed shown more diffuse
alteration^^','^ than are found in hypogly-
cemic adult humans or monkeys, where the lesions more closely resemble those of ischemic cell change.
It has been difficult to differentiate the pathologic alterations resulting from hypo- glycemia from those resulting from anoxia- i ~ c h e m i a . ' ~ ~ ' ~ The infant rat has been a good model to elucidate the effects of hypo- glycemia because brain biochemical altera- tions are very resistant to anoxia. In a study in progress in our laboratory once daily anoxic episodes from birth to age 18 days have not resulted in similar brain biochemi- cal reductions to those described in this study.
A second problem in studying the ef- fects of hypoglycemia in human infants relates to the frequent administration of large doses of corticosteroids. As excess steroids damage the developing brain, at least in laboratory animal^,^' analyses of specimens from human infants dying with hypoglycemia may not be representative of hypoglycemic damage. Brain damage oc- curring in other diseases with a high inci- dence of secondary hypoglycemia, such as hypothyroidism and r n a l n ~ t r i t i o n , ~ ~ ~ 4 G may
also be due in part to low blood sugars.
SPECULATION
Hypoglycemia causes diffuse biochemi- cal alterations in the brains of infant rat pups. These alterations may also occur in human infants following hypoglycemia. The present model will allow further studies of hypoglycemia, such as the evalu- ation of effective means to prevent the described brain alterations.
SUMMARY
ARTICLES
REFERENCES
1. Cornblath, M., Odeil, G. B., and Levin, E. Y.:
Symptomatic neonatal hypoglycemia asso- ciated with toxemia of pregnancy. J. Pediat., 55:545, 1959.
2. Brown, R. J. K., and Wallis, P. G.: Hypogly- cemia in the newborn infant. Lancet, 1: 1278, 1963.
3. Haworth, J. C., and McRae, K. N.: The neuro- logical and developmental effects of neo- natal hypoglycemia. Canad. Med. Assoc. J., 92:861, 1965.
4. Chance, G. W., and Bower, B. D.: Hypogly- cemia and temporary hypoglycemia in in- fants of low birth weight for maturity. Arch. Dis. Child, 41:279, 1966.
5. Knobloch, H., Sotos, J. F., Sherard, Jr., E. S., Hodson, W. A., and Wehe, R. A,: Prog- nostic and etiologic factors in hypoglycemia. J. Pediat., 70:876, 1967.
6. Lubchenco, L. O., and Bard, H.: Incidence of hypoglycemia in newborn infants classi- fied by birth and gestational age. Pediatrics,
47:831, 1971.
7. Cornblath, M., and Schwartz, R.: Disorders of Carbohydrates in Infancy. Philadelphia: W. B. Saunders Co., 1966.
8. Dawson, R. M. C.: Studies on glutamine and glutamic acid content of the rat brain dur- ing insulin hypoglycaemia. Biochem. J., 47: 386, 19%.
9. De Ropp, R. S., and Snedeker, E. H.: Effect of drugs on amino acid levels in the rat brain: Hypoglycemic agents. J. Neurochem., 7:128, 1961.
10. Davis, J. M., Hirnwich, W. A., and Pederson, V. C.: Hypoglycemia and developmental changes in free amino acids of rat brain. J. Appl. Physiol., 29:210, 1970.
11. Jones, E. L., and Smith, W. T.: Hypogly- caemic brain damage in the neonatal rat. Clin. Develop. Med., 39/40:231, 1971. 12. Finley, K. H., and Brenner, C.: Histologic
evidence of damage to the brain in monkeys treated with Metrazol and insulin. Arch. Neurol. Psychiat., 45:403, 1941.
13. Kahn, K. J., and Myers, R. E.: Insulin-induced hypoglycaemia in the non-human primate.
I. Clinical consequences. Clin. Develop. Med., 39/40: 185, 1971.
14. Myers, R. E., and Kahn, K. J.: Insulin-induced hypoglycaemia in the non-human primate. 11. Long-term neuropathological conse- quences. Clin. Develop. Med., 39/40: 195, 1971.
15. Meldrum, B. S., Horton, R. W., and Brierley, J. B.: Insulin-induced hypoglycaemia in the primate: Relationship between physiological changes and neuropathology. Clin. Develop. Med., 39/40: 207, 1971.
16. Brierley, J. B., Brown, A. W., and Meldrum, B. S.: The neuropathology of insulin-in- duced hypoglycaemia in a primate (M.
mulatta); Topography and cellular nature. Clin. Develop. Med., 39/40:225, 1971. 17. Brierley, J. B., Brown, A. W., and Meldrum,
B. S.: The nature and time course of the neuronal alterations resulting from oligaemia and hypoglycaemia in the brain of Macaca mulatta. Brain Res., 25:483, 1971.
18. Lawrence, R. D., Meyer, A., and Nevin, S.: The pathological changes in the brain in fatal hypoglycaemia. Quart. J. Med., 11: 181, 1942.
19. Hoff, E. C., Grenell, R. G., and Fulton, J. F.: Histopathology of the central nervous sys- tem after exposure to high altitudes, hypo- glycemia and other conditions associated with central anoxia. Medicine, 24: 161, 1945. 20. Winkelman, N. W., and Moore, M. T.: Neuro- histopathologic changes with metrazol and insulin shock therapy. Arch. Neurol. Psych., 43: 1108, 1940.
21. Anderson, J. M., Milner, R. D. G., and Strich, S. J.: Effects of neonatal hypoglycaemia on the nervous system: a pathological study. J. Neurol. Neurosurg. Psychiat., 30:295, 1967.
22. Banker, B. Q.: The neuropathological effects of anoxia and hypoglycemia in the newborn. Develop. Med. Child Neurol., 9:544, 1967. 23. Schulte, F. J., Michaelis, R., Nolte, R., Albert,
G., Parl, U., and Lasson, U.: Brain and behavioural maturation in newborn infants of diabetic mothers. Part I: Nerve conduc- tion and EEG patterns. Neuropediatie, 1: 24, 1969.
24. O'Brien, D., Ibbott, F. A., and Rodgerson, D. 0 . : Laboratory Manual of Pediatric Microchemical Techniques. New York: Hoeber Medical Division, Harper and Row Publishers, 1968, p. 153.
25. Lowry, 0. H., Passonneau, J. V., Hasselberger, F. X., Schulz, D. W.: Effect of ischemia on known substrates and cofactors of the gly- colytic pathway in brain. J. Biol. Chem., 239:18, 1964.
26. Zamenhof, S., Bursztyn, H., Rich, K., and Zamenhof, P. J.: The determination of de- oxyribonucleic acid and of cell number in brain. J. Neurochem., 11:505, 1964. 27. Lowry, 0. H., Rosebrough, N. J., Farr, A. L.,
and Randall, R. J.: Protein measurement with the folin phenol reagent. J. Biol. Chem., 193:265, 1951.
28. Chase, H. P., Lindsley, W. F. B., Jr., and O'Brien, D.: Undernutrition and cerebellar development. Nature, 221:554, 1969. 29. Chase, H. P., Dorsey, J., and McKhann, G. M.:
of a myelin lipid. Pediatrics, 40:551, 1967.
30. Rouser, G., Kritchevsky, G., and Yamamoto, A.: Column chromatographic and associated procedures for separation and determina- tion of phosphatides and glycolipids. In
Marinetti, G. V., ed: Lipid Chromatographic Analysis. New York: Marcel Dekker, 1967, p. 99.
31. Chase, H. P., Welch, N. N., Dabiere, C. S., Vasan, N. S., and Butterfield, L. J.: Altera- tions in human brain biochemistry following intrauterine growth retardation. Pediatrics, 50:403, 1972.
32. Greengard, P.: Adenosine-5-triphosphate: De- termination by fluorimetry. In Bergmeyer, H. U., ed.: Methods of Enzymatic Analysis. New York: Academic Press, 1965, p. 551. 33. Lamprecht, W., and Stein, P.: Creatine phos-
phate. In Bergmeyer,, H. U., ed.: Methods of Enzymatic Analysis. New York: Academic Press, 1965, p. 610.
34. Remington, R. D., and Schork, M. A.: Statis- tics with Applications to the Biological and Health Sciences. Englewood Cliffs, New Jersey: Prentice-Hall, Inc., 1970, p. 213. 35. Winick, M., Fish, I., and Rosso, P.: Cellular
recovery in rat tissues after a brief period of neonatal malnutrition. J. Nutr., 95:623, 1968.
36. Neville, H. E., and Chase, H. P.: Undernutri- tion and cerebellar development. Exp.
Neurol., 33:485, 1971.
37. King, L. J., Lowry, 0. H., Passonneau, J. V., and Venson, V.: Effects of convulsants on
energy reserves in the cerebral cortex. J.
Neurochem., 14: 599, 1967.
38. Tam, M., Brada, D., and Samson, F. E.:
Cerebral high-energy phosphates during in- sulin hypoglycemia. Amer. J. Physiol., 203: 690, 1962.
39. Haugaard, N., Vaughan, M., Haugaard, E. S.,
and Stadie, W. C.: Studies of radioactive injected labeled insulin. J. Biol. Chem., 208:549, 1954.
40. Elgee, N. J., Williams, R. H., and Lee, N. D.: Distribution and degradation studies with insulin '311. J. Clin. Invest., 33: 1252, 1954. 41. Sloviter, H. A., and Yamada, H.: Absence of
direct action of insulin on metabolism of the isolated perfused rat brain. J. Neurochem., 18: 1269, 1971.
42. Mellerup, E. T., and Rafaelson, 0. J.: Brain glycogen after intracisternal insulin injec- tion. J. Neurochem., 16:777, 1969.
43. Chase, H. P.: The effects of intrauterine and postnatal undernutrition on normal brain development. Ann. N.Y. Acad. Sci., 205: 231, 1973.
44. Howard, E.: Effects of coticosterone and food restriction on growth and on DNA, RNA and cholesterol contents of the brain and liver in infant mice. J. Neurochem., 12:181,
1965.
45. Alleyne, G. A. O., and Scullard, G. H.: Altera- tions in carbohydrate metabolism in Jamai- can children with severe malnutrition. Clin. Sci., 31:631, 1969.
46. Wharton, B.: Hypoglycaemia in children with
1973;52;513
Pediatrics
H. Peter Chase, Robert A. Marlow, Carol S. Dabiere and N. Noreen Welch
HYPOGLYCEMIA AND BRAIN DEVELOPMENT
Services
Updated Information &
http://pediatrics.aappublications.org/content/52/4/513
including high resolution figures, can be found at:
Permissions & Licensing
http://www.aappublications.org/site/misc/Permissions.xhtml
entirety can be found online at:
Information about reproducing this article in parts (figures, tables) or in its
Reprints
http://www.aappublications.org/site/misc/reprints.xhtml
1973;52;513
Pediatrics
H. Peter Chase, Robert A. Marlow, Carol S. Dabiere and N. Noreen Welch
http://pediatrics.aappublications.org/content/52/4/513
the World Wide Web at:
The online version of this article, along with updated information and services, is located on
American Academy of Pediatrics. All rights reserved. Print ISSN: 1073-0397.