Impact Factor (PIF): 2.675
Global Journal of Advance Engineering Technologies and Sciences
ANALYSIS OF PLASTIC MOLD FILLING PROCESS WITH UNIQUE
GATE AND RUNNER SYSTEMS
G.Rajendra Prasad
#1, Dr. S.Chakradhar Goud
*2Research Scholar, S.J.J.T. University
*1, Rajasthan, India
Principal, Sana Engineering College, Kodad, T.S, India
*2A
BSTRACTThis paper presents the design of plastic injection mould for producing a plastic product. The plastic part was designed into two different types of product, but in the same usage function. One part is using clip function and another part is using tick function. In the computer-aided design (CAD), two plastic parts were drawn in 3 dimension (3D) view by using SIEMENS 8.0 parametric software.For mould design, the product was designed into two changeable inserts to produce two different types of plastic product in one mould base. Before proceeding to injection machine and mould design, this part was analyzed and simulated by using Ansys 15.0. From the analysis and simulation we can define the most suitable injection location, material temperature and pressure for injection. In the present work Component selected for conveyor chain locking links.
Key words:
Mould filling analysis, hot metal distribution, case study.INTRODUCTION
The mould typically consists of two mould halves. Usually one mould half contains the cavity and forms the outer shape of the part. This part of the mould is called the cavity side. The other mould half contains a protruding shape and forms the inner shape of the part, this mould part is called the core. When the core is clamped against the cavity, the hollow space that is formed defines the shape of the part to be moulded. A mould basically consists of properly designed sprue, runner, gate, and cavity. The sprue is the channel, cut in the stationary platen that transports the melt from the plasticator nozzle to the runner. Once the plastic melt enters the mould, it flows through a distribution system, called the runner system, and then through the gates into the mould cavities. In a so-called cold runner system, a new runner is moulded in each moulding cycle and the runner is ejected together with the moulded parts. The plastic of the runner can often be reprocessed and moulded again. In the design of the runner system the objective is to have the plastic reach all gates at the same time. This is an important issue in multi-cavity moulds. In a rectangular runner system, the number of cavities is a multiple of two. In a circular runner any number of cavities can be used. The gate connects the runner to the actual part. The cross section of the gate is usually small so that the runner can be easily removed from the part and does not leave a large gate mark on the part.During the moulding cycle, heat is first required to be put into the material and then that heat must be removed as quickly, and as consistently as possible, if the rapid production of consistent products is to be obtained. As most modern injection moulding machines are screw machines, heat input is relatively easy. Heat removal from the plastics material contained in the mould is, however, difficult as plastics material contains a lot of heat and has a low thermal conductivity. Cooling allows the plastic to solidify and become dimensionally stable before ejection. Heat that has been transferred to the mould by the molten plastic is carried away by a coolant that circulates through cored passages in the mould.
OBJECTIVES
1. To study about the preparation of core inserts.
2. To verify the preparation of single mould base for multipurpose usage with the change of insert.
3. .Design of component and mold base by using Siemens 8.0 mold wizard.
4. The flow analysis will be observed and simulations will generate with different temperatures and pressures
by using ANSYS.
LITERATURE REVIEW
Impact Factor (PIF): 2.675
Lee and Lin et al. [2] designed a runner and gating system for a multi-cavity injection mould using Finite Element Method (FEM) and neural network. In order to select the optimal runner system parameter to minimise the warp of an injection mould, FEM, Taguchi’s method and an adductive network were used. A satisfactory result as compared to the corresponding finite element verification was obtained.Fan et al. [3] studied real time flow rate estimation in injection molding. Experimental and analytical methods were employed in this study in order to estimate the flow rate and pressure at multiple points in an injection mold. In the experiments, melt pressure transducers were positioned at the inlet and the outlets of the feed system. A non-Newtonian, nonisothermal, faster than real time simulation utilised the feedback from the experiments to estimate the flow rates delivered through each branch of the feed system, and also provided feedback with regards to the apparent viscosity of the polymer melt provided by the molding machine. A two-cavity mold with a valve-gated hot runner system was studied.
Kumar et. al. [4] performed a computer simulation for the transport processes during an injection mold filling and managed to optimise the molding condition. The computer simulation of injection mold filling at constant flow rate was modeled for the production of a cylindrical part under isothermal and non-isothermal conditions. The finite difference method used to solve the governing differential equation for both the processes yield good agreement with the analytical solutions.
CONSIDERATIONS FOR ANALYSIS
Material injection and filling, flow analysis, packing, cooling analysis.
RUNNER LAYOUT AND CONFIGURATION
A technique to calculate desired length and radius of a runner is already available. By following Kazmer method [5], the entire runner network layout was modeled as a flow network, consists of elements and nodes. For research purpose, a traditional and H-branching will be used. Since this layout is symmetrical, analysis will be taken on the half side of the runner, with assumption that melt will flow equally to the other half. Also, on the half side, analysis will be performed on the lower half of the runner.
MODELING OF MOLD CAVITY
SIEMENS 8.0v software is one of the world’s most advanced and tightly integrated CAD/CAM/CAE software package developed by Siemens PLM Software, offers several pre-packaged Mach Series solutions for NC machining. Available in a range of capability levels, these solutions accelerate programming and improve productivity for a variety of typical manufacturing challenges, from basic machining to complex, multiple-axis and multi-function machining, as well as mould and die manufacturing it also merges solid and surface modeling techniques into one powerful tool set.
By using PLM soft wares 3d design development with core, cavity extractions and mould design become easy with mold wizard techniques in the software. Runner and gate design techniques become easier for the development of mold with optimal solutions.
Impact Factor (PIF): 2.675
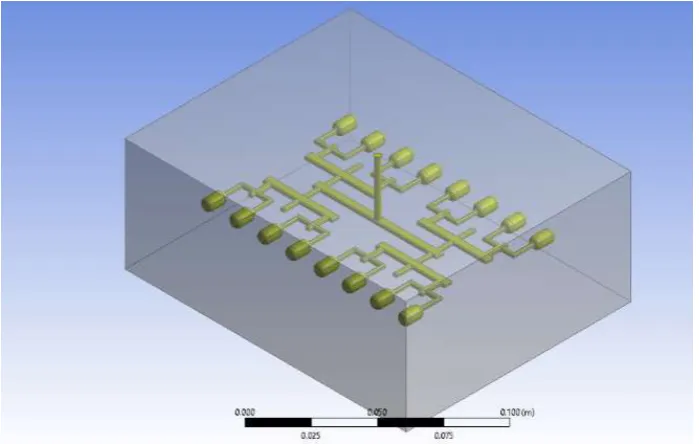
The whole model has been convert to IGES file systems to convert the file to ANSYS fluent environment to check the mold flow analysis with flow boundary conditions
Figure 2 shows the import layout of mathematical model for analysis
RULES OF ESTIMATION
The estimation process of each boundary condition to achieve certain desired runner length and diameter is governed by flow rate and pressure distribution. In order to complete the equation, melt flow rate and pressure distribution need to be known.
RESULTS & DISCUSSIONS
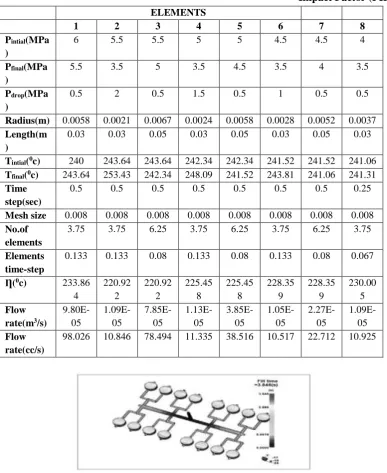
Results for 16 cavity traditional runner :In this simulation, a traditional type of runner layout was used. The cavity is placed at a desired position inside the mold with distance that has been derived using values from the analysis with random element points and results given in the table.
Impact Factor (PIF): 2.675
ELEMENTS1 2 3 4 5 6 7 8
Pintial(MPa
)
6 5.5 5.5 5 5 4.5 4.5 4
Pfinal(MPa
)
5.5 3.5 5 3.5 4.5 3.5 4 3.5
Pdrop(MPa )
0.5 2 0.5 1.5 0.5 1 0.5 0.5
Radius(m) 0.0058 0.0021 0.0067 0.0024 0.0058 0.0028 0.0052 0.0037
Length(m )
0.03 0.03 0.05 0.03 0.05 0.03 0.05 0.03
Tintial(0c) 240 243.64 243.64 242.34 242.34 241.52 241.52 241.06
Tfinal(0c) 243.64 253.43 242.34 248.09 241.52 243.81 241.06 241.31
Time step(sec)
0.5 0.5 0.5 0.5 0.5 0.5 0.5 0.25
Mesh size 0.008 0.008 0.008 0.008 0.008 0.008 0.008 0.008
No.of elements
3.75 3.75 6.25 3.75 6.25 3.75 6.25 3.75
Elements time-step
0.133 0.133 0.08 0.133 0.08 0.133 0.08 0.067
Ƞ(0c) 233.86
4 220.92 2 220.92 2 225.45 8 225.45 8 228.35 9 228.35 9 230.00 5 Flow rate(m3/s)
9.80E-05 1.09E-05 7.85E-05 1.13E-05 3.85E-05 1.05E-05 2.27E-05 1.09E-05 Flow rate(cc/s)
98.026 10.846 78.494 11.335 38.516 10.517 22.712 10.925
Figure 4 shows the analysis of 16-cavity runner with H-type and the
Figure 4.2 shows the result of fill time for 16 cavity H-branching runner. The pressure distribution result for the same configuration is shown in Figure4.3 and temperature distribution shown in Figure 4.4. At each gate, it was observed that similar color was plotted indicating an equal fill time and temperature has been achieved. However, on the flow path, it was seen that one of the cavities has slightly lower pressure compared to the others.
Impact Factor (PIF): 2.675
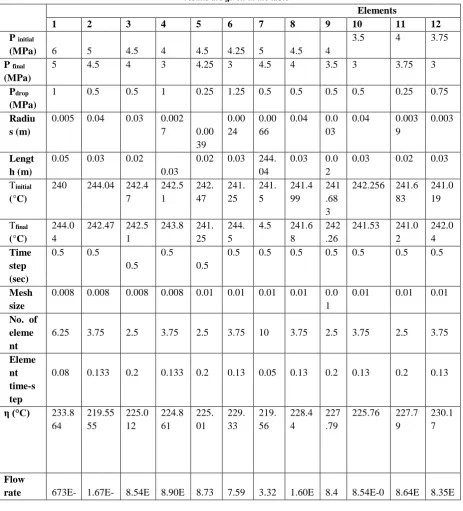
Figure 6 shows Temperature distribution for 16 cavity H-branching runner
Table 4.2 shows Temperature distribution for 16 cavity H-branching runner results are given in the table
Elements
1 2 3 4 5 6 7 8 9 10 11 12
P initial
(MPa) 6 5 4.5 4 4.5 4.25 5 4.5 4
3.5 4 3.75
P final (MPa)
5 4.5 4 3 4.25 3 4.5 4 3.5 3 3.75 3
Pdrop (MPa)
1 0.5 0.5 1 0.25 1.25 0.5 0.5 0.5 0.5 0.25 0.75
Radiu s (m)
0.005 0.04 0.03 0.002
7 0.00
39
0.00 24
0.00 66
0.04 0.0
03
0.04 0.003
9
0.003
Lengt h (m)
0.05 0.03 0.02
0.03
0.02 0.03 244.
04
0.03 0.0
2
0.03 0.02 0.03
Tinitial (°C)
240 244.04 242.4
7 242.5 1 242. 47 241. 25 241. 5 241.4 99 241 .68 3
242.256 241.6 83 241.0 19 Tfinal (°C) 244.0 4
242.47 242.5
1
243.8 241.
25
244. 5
4.5 241.6
8
242 .26
241.53 241.0
2 242.0 4 Time step (sec)
0.5 0.5
0.5
0.5
0.5
0.5 0.5 0.5 0.5 0.5 0.5 0.5
Mesh size
0.008 0.008 0.008 0.008 0.01 0.01 0.01 0.01 0.0
1
0.01 0.01 0.01
No. of eleme nt
6.25 3.75 2.5 3.75 2.5 3.75 10 3.75 2.5 3.75 2.5 3.75
Eleme nt time-s tep
0.08 0.133 0.2 0.133 0.2 0.13 0.05 0.13 0.2 0.13 0.2 0.13
η (°C) 233.8
64 219.55 55 225.0 12 224.8 61 225. 01 229. 33 219. 56 228.4 4 227 .79
225.76 227.7
9
230.1 7
Flow
Impact Factor (PIF): 2.675
(m3/s) 05 05 -06 -06 E-06 E-06 E-05 -05
4E-06
6 -06 -06
Flow rate (cc/s)
67.32 3
16.654 8.543 8.9 8.73 7.59 33.1
8
16.01 8.4
4
8.54 8.63 8.35
Figure 7 Flow rate comparison in element 2 for 16 cavity traditional runner
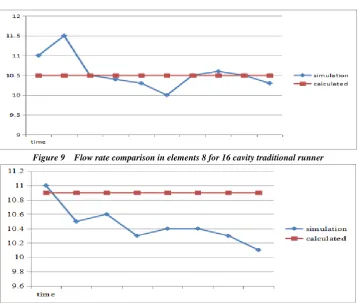
Figure 8 Flow rate comparison in element 5 for 16 cavity traditional runner
Figure 9 Flow rate comparison in elements 8 for 16 cavity traditional runner
Impact Factor (PIF): 2.675
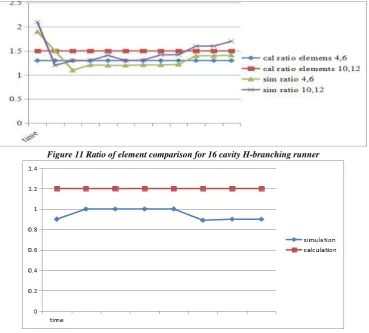
Figure 11 Ratio of element comparison for 16 cavity H-branching runner
Figure 12 Flow rate ratio between elements 4 and 6 for 16 cavity H-branching runner
Figure 13 Flow rate ratio between element 10 and 12 for 16 cavity H-branching runner
DISCUSSIONS
The errors when comparing the calculated and simulated ratio of flow rate between elements 4 and 6 was 9.7%, while the error for the ratio of flow rate between elements 10 and 12 was 5.14%. An equal pressure at each gate for this configuration was still observed as shown in graphs.Overall, both the predicted parameters obtained from calculation and the values produced by Mold FLow analysis were in general agreement. However, there were few departures of values such as at the initial and final values of the flow rate, shown in Figures .
CONCLUSIONS
Impact Factor (PIF): 2.675
melts recital. However, the increased number of model coefficients significantly increases the analysis time. This approach is to assume Ellis Viscosity model with temperature dependence for a given material. Added to flow rate with Ellis model relationship, a number of estimations can be made in the feed system of injection molding. This
thereby reduce the number of rheological parameters e.g. the Newtonian limit and the critical shear stress.The results
have shown, especially for pressure in elements, that molders can predict and control the shape and size requirements of molds in order to achieve the required parameter at the entrance of the gate. Initial pressure at the inlet was not that important; in that any values depending on number of cavity can be used. This was true given that larger number of cavity requires larger injection pressure. Flow rate at each element entering the gate, must be equal so that, it can achieve the required pressure drop. From all these constraints, size of runner length and diameter can be adjusted to achieve the desired results.
REFERENCES
I. B. Zhao, S.P. Vanka and B.G. Thomas, "Numerical study of flow and heat transfer in a molten flux layer",
International Journal of Heat and Fluid Flow, Vol. 26, No. 1, pp. 105- 118, Feb, 2005.
II. K.S. Lee and J.C. Lin, “Design of the runner and gating system parameters for a multi-cavity injection mould
using FEM and neural network”, The International Journal of Advanced Manufacturing Technology, Vol. 27, No. 11-12, pp. 1089-1096, Feb, 2006.
III. B. Fan, D. Kazmer and R. Mukhari, “Real Time Flow Rate Estimation in Injection Molding”, Molding
Technology Symposium at the 20th Annual Meeting of the Polymer Processing Society, Akron, OH, June, 2003.
IV. A. Kumar, P. S. Ghoshdastidar and M. K. Muju, "Computer simulation of transport processes during injection
moldfilling and optimization of the molding conditions", Journal of Materials Processing Technology, Vol. 120, No. 1-3, pp. 438-449, Jan, 2002.
V. D. O. Kazmer, "Professor David Kazmer for Plastic Part Design and Manufacturing", WebMaster Mag.,