Abiotic Stresses Shift Belowground
Populus
-Associated
Bacteria Toward a Core Stress Microbiome
Collin M. Timm,
a,bKelsey R. Carter,
cAlyssa A. Carrell,
aSe-Ran Jun,
a,dSara S. Jawdy,
aJessica M. Vélez,
aLee E. Gunter,
aZamin Yang,
aIntawat Nookaew,
a,dNancy L. Engle,
aTse-Yuan S. Lu,
aChristopher W. Schadt,
aTimothy J. Tschaplinski,
aMitchel J. Doktycz,
aGerald A. Tuskan,
aDale A. Pelletier,
aDavid J. Weston
aaBiosciences Division, Oak Ridge National Laboratory, Oak Ridge, Tennessee, USA bJoint Institute for Biological Sciences, University of Tennessee, Knoxville, Tennessee, USA
cSchool of Forest Resources and Environmental Science, Michigan Technological University, Houghton,
Michigan, USA
dUniversity of Arkansas for Medical Sciences, Little Rock, Arkansas, USA
ABSTRACT
Adverse growth conditions can lead to decreased plant growth,
produc-tivity, and survival, resulting in poor yields or failure of crops and biofeedstocks. In
some cases, the microbial community associated with plants has been shown to
al-leviate plant stress and increase plant growth under suboptimal growing conditions.
A systematic understanding of how the microbial community changes under these
conditions is required to understand the contribution of the microbiome to water
utilization, nutrient uptake, and ultimately yield. Using a microbiome inoculation
strategy, we studied how the belowground microbiome of
Populus deltoides
changes
in response to diverse environmental conditions, including water limitation, light
limitation (shading), and metal toxicity. While plant responses to treatments in terms
of growth, photosynthesis, gene expression and metabolite profiles were varied, we
identified a core set of bacterial genera that change in abundance in response to
host stress. The results of this study indicate substantial structure in the plant
micro-biome community and identify potential drivers of the phytomicro-biome response to
stress.
IMPORTANCE
The identification of a common “stress microbiome” indicates tightly
controlled relationships between the plant host and bacterial associates and a
con-served structure in bacterial communities associated with poplar trees under
differ-ent growth conditions. The ability of the microbiome to buffer the plant from
ex-treme environmental conditions coupled with the conserved stress microbiome
observed in this study suggests an opportunity for future efforts aimed at
predict-ably modulating the microbiome to optimize plant growth.
KEYWORDS
drought, microbiome, poplar, shading
T
he microbiome has the capacity to act as an extension of the host genotype that
can respond to changes in environmental conditions and evolve rapidly (1).
Changes in the host organism or environment have been shown to shift the
compo-sition of the associated microbiota in humans (2, 3), mice (4), coral (5), and plants (6).
The additional functions encoded by members of the plant microbiome can modify
nutrient uptake (7, 8), produce (9) or degrade (9–11) plant hormones, prime host
defense pathways against pathogens (12) and pests (13), and ultimately affect both the
above- and belowground growth of the host plant (14–16). In communities, effects of
individual members can be additive (17), synergistic (18–20), or antagonistic (21, 22). As
a complex community, the plant belowground microbiome has been shown to adapt
rapidly to water limitation conditions and alleviate host stress (23, 24). This ability of
Received14 June 2017Accepted20 December 2017 Published23 January 2018
CitationTimm CM, Carter KR, Carrell AA, Jun S-R, Jawdy SS, Vélez JM, Gunter LE, Yang Z, Nookaew I, Engle NL, Lu T-YS, Schadt CW, Tschaplinski TJ, Doktycz MJ, Tuskan GA, Pelletier DA, Weston DJ. 2018. Abiotic stresses shift belowgroundPopulus-associated bacteria toward a core stress microbiome. mSystems 3:e00070-17.https://doi.org/10.1128/ mSystems.00070-17.
EditorJoshua R. Herr, University of Nebraska-Lincoln
Copyright© 2018 Timm et al. This is an open-access article distributed under the terms of theCreative Commons Attribution 4.0 International license.
Address correspondence to Collin M. Timm, collin.timm@jhuapl.edu.
Environmental stresses shift the plant root microbiome in the same direction
RESEARCH ARTICLE
Host-Microbe Biology
crossm
January/February 2018 Volume 3 Issue 1 e00070-17 msystems.asm.org 1
on September 8, 2020 by guest
http://msystems.asm.org/
individual microbes and microbial communities to modify plant growth characteristics
and alleviate stress suggests an opportunity to optimize plant growth for biomass and
yield, either by increasing plant growth and productivity or by modulating metabolite
profiles for downstream biomass processing. Toward this goal, a thorough
understand-ing of the plant-microbiome relationship along with the response of the microbiome to
changes in the host and environment is required.
Members of the
Populus
genus, fast-growing trees that are candidate
second-generation biofuel feedstocks, are an attractive system for studying such microbiome
intervention strategies. Recent 16S rRNA gene profiling studies of
Populus
growing in
its natural habitat have contributed to our understanding of the
Populus
root
micro-biome community structure (25–28). These studies have demonstrated that
Populus
roots are host to a diverse bacterial community that differs on the basis of soil,
geographic location, season, and host genotype but is most strongly influenced by the
ecological niche (e.g., rhizosphere versus endosphere). Rhizosphere communities
dem-onstrate an abundance of
Acidobacteria
that were greatly diminished in the
endo-sphere (defined as within surface-sterilized root tissues), while
Alphaproteobacteria
and
Gammaproteobacteria
, along with
Actinobacteria
, were enriched in the root
endo-sphere. Understanding the interplay between rhizosphere and root communities is
critical for tailored microbiome intervention strategies to improve plant productivity.
The production of biomass for food or energy crops will ultimately be affected by
environmental conditions such as water and light availability and the presence of
toxins. Climate change has led to changing precipitation regimes and more extreme
weather events (29), and the ability of the microbiome to buffer against water limitation
(23) provides an opportunity to mitigate the effect of these conditions in the field.
Water limitation conditions have been shown to affect the microbiome by decreasing
mycorrhizal colonization, ultimately decreasing nutrient acquisition by the host plant
(30). Shading and cloud cover are natural limitations on light, decrease overall biomass
production, and lead to structural changes in
Populus
species (31). These inhibitors have
been shown to impact metabolite profiles in tomato (32) and tea (33) plants. Shading
can significantly affect plant metabolite profiles and has been proposed as a method
for optimizing secondary metabolite production (34). Shading, and the ultimate effect
on plant photosynthesis and carbon allocation, also shifts the association of the plant
with beneficial microbes in the environment (35). Finally, the presence of toxins and
inorganic chemicals in the environment impacts the microbial community directly as
antimicrobial compounds (36) or indirectly by either inhibiting the proliferation of other
community members (37) or modifying the host exudate and chemical profile. Copper
is an essential micronutrient for plants, but at high concentrations, it can inhibit plant
growth in rice (38). In
Populus
, excess copper is accumulated in roots and decreases leaf
chlorophyll content and photosynthesis (39, 40).
Responses to diverse stresses have been used to study the biology of bacteria (41,
42), yeast (43, 44), and plants (45–47). These studies identified core responses that were
conserved across stress treatments which helped map the functions of genes and
proteins in stress response. Gene expression studies show that while plants encode a
wide range of mechanisms to deal with unique stresses, there is a subset of genes that
are regulated in response to generic stress (45–51). For example, similar patterns of
unique and core responses were observed in metabolite profiles in
Zea mays
(maize)
responses to drought and heat stress (52). Similar to analysis of individual genes on
host function, individual microbiome members have been shown to modulate gene
expression on the basis of the presence of plant metabolites (53, 54), suggesting a
response to changes in the host metabolome, and indeed, the microbiome community
has been linked to changes in the chemical environment of the host in engineered
lignin mutants of
Populus
(55). In this work, we aimed to determine if a core response
occurs in the microbiome of plants subjected to diverse stresses. Understanding how
the plant and its associated microbiome respond to changes in the environment is
critical for harnessing the protective and adaptive powers of the microbiome. We
hypothesized that subsets of the plant belowground microbiome community (root and
on September 8, 2020 by guest
http://msystems.asm.org/
rhizosphere) would mirror the host response to stress, showing both a
treatment-specific response and a core stress response showing microbial abundance changes
that are shared between stress treatments. Using a microbiome inoculation strategy,
we studied how
Populus deltoides
and its associated belowground microbiome respond
to abiotic stresses of water limitation, shading, and copper toxicity.
RESULTS
Stress conditions reduced plant growth and altered physiology.
Inoculation of
P. deltoides
WV94 rooted cuttings (eight plants per conditions) with the wild
micro-biome resulted in increased leaf mass per area (LMA; 4.70 versus 5.13 mg/cm
2;
P
⬍
0.05
[Student’s
t
test]) and a decrease in the Ball-Berry parameter (summarizes the
relation-ship between stomatal conductance and net photosynthesis [0.024 versus 0.020;
P
⬍
0.05 by Student’s
t
test]) and different microbiome communities compared to
unin-oculated controls (
P
⬍
0.001, Fig. S1; see Data Set S1 [Clustering Statistics] in the
supplemental material), indicating that the plants were colonized by the natural
microbiome when this microbiome inoculation method was used. Uninoculated control
plants were colonized by microbes from the greenhouse environment and were
included primarily to ensure that the inoculation strategy resulted in a microbiome
representative of that in other
Populus
studies. After acclimation to greenhouse
con-ditions (~2 weeks), inoculated plants were subjected to one of three environmental
stressors, water limitation (cyclic drought based on individual plant responses with
plants reaching drought conditions three to five times throughout the treatment
period; Fig. S1), shade (80% light interception), or heavy metal toxicity (30
M CuSO
4in nutrient solution). Stem height and leaf number were measured weekly during
treatments (Fig. 1A and B) and were significantly reduced by the end of the treatment
in shaded plants (height,
P
⬍
0.001; leaf number,
P
⬍
0.001 [Student’s
t
test]) and
water-limited plants (height,
P
⬍
0.001; leaf number,
P
⬍
0.001 [Student’s
t
test]). In
water-limited plants, the LMA was increased (5.80 versus 5.13 mg/cm
2;
P
⬍
0.05
[Student’s
t
test]), consistent with a decreased surface area to reduce water loss to the
environment (Fig. S2). In shaded plants, the total leaf area and LMA were significantly
reduced (leaf area, 600 versus 1,890 cm
2;
P
⬍
0.001; LMA, 3.26 versus 5.13 mg/cm
2;
FIG 1 Plant growth and physiology. (A) Stem height was measured to the apical meristem. (B) Leaves longer than 2 cm were counted for leaf numbers. Error bars in panels A and B are standard errors from eight plants per condition at each point. (C) CO2gas exchange rate at a PAR level of 400mol m⫺2s⫺1
for control (ctrl) and copper (cu)-, drought (dr)-, and shade (sh)-treated plants. Error bars in panel C are 1 standard error of the mean (standard deviation/mean) from 10, 8, 10, and 9 (control, copper, drought, and shade, respectively) measurements across 3 days. (D) Photosynthesis rate for two drought plants (gray lines) and one control plant (black line) throughout a drought cycle. Watering events are indicated by vertical dotted lines.
Effects of Stresses onPopulusRoot Microbiome
January/February 2018 Volume 3 Issue 1 e00070-17 msystems.asm.org 3
on September 8, 2020 by guest
http://msystems.asm.org/
P
⬍
0.001 [Student’s
t
test]), consistent with similar light limitation studies with
P.
deltoides
⫻
P. trichocarpa
hybrids (31). Copper treatment resulted in the accumulation
of copper in leaf tissues (1.39
⫻
increase;
P
⬍
0.05 [Student’s
t
test]) (Fig. S2).
Plant chlorophyll fluorescence and gas exchange parameters were measured in two
sets: on days 17 and 18 of stress conditions for four plants per condition and daily on
days 12 to 18 for two drought plants and two control plants to track drought cycles.
Plants were randomly selected to complete measurements between 10 am and 2 pm
on subsequent days. Net photosynthesis and water use were significantly reduced in
water-limited plants (6.4 versus 10.7
mol CO
2m
⫺2s
⫺1;
P
⬍
0.01 [Student’s
t
test]) and
shade-treated plants (8.1 versus 10.7
mol CO
2m
⫺2s
⫺1;
P
⬍
0.01 [Student’s
t
test])
(Fig. 1D; Fig. S2). Interestingly, we observed an increase in instantaneous water use
efficiency in copper-treated plants (5.8 versus 3.5
mol CO
2/
mol H
2O;
P
⬍
0.01
[Student’s
t
test]). The CO
2respiration rate was significantly reduced in water-limited
and shade-treated plants (water limited, 1.5 versus 2.1
mol CO
2m
⫺2s
⫺1,
P
⬍
0.01;
shade treated, 1.0 versus 2.1,
P
⬍
0.001 [Student’s
t
test]), suggesting decreased
metabolic activity in the leaves of stressed plants.
Plant transcriptional response to stress.
Plant tissue was collected at the end of
the stress treatments and measured for transcriptional response by transcriptome
sequencing (three plants per condition, excluding uninoculated controls).
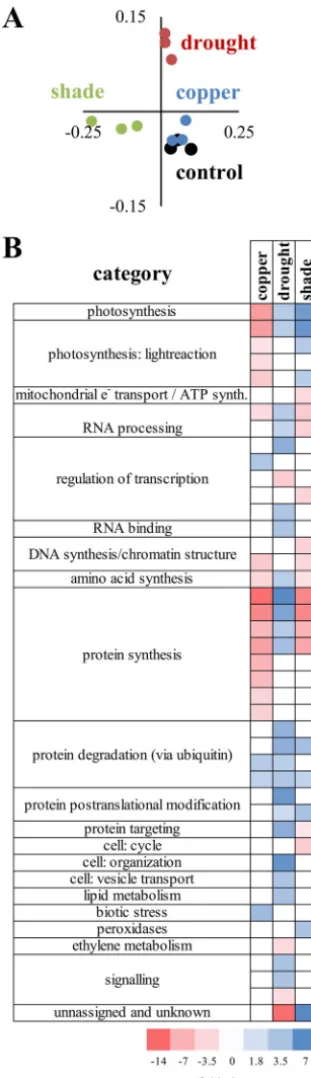
Transcrip-tional profiles clustered by treatment (Fig. 2A) and were analyzed to determine
significant over- and underrepresentation of responsive groups (Fig. 2B). Genes
anno-tated to participate in photosynthesis were downregulated relative to the control in
copper-treated plants. Specifically, photosystem I (PSI) was decreased (
⫺
2.51-fold), with
the gene ontology (GO) category for PSI polypeptide subunits decreased
⫺
3.05-fold.
Photosystem II (PSII) was also decreased (
⫺
6.07-fold), with both LHC-II (
⫺
2.97-fold) and
PSII polypeptide subunits decreased (
⫺
4.63-fold). In drought and shade treatments,
photosynthesis genes were upregulated, consistent with carbon starvation. Specifically,
the GO category annotated as light reaction was upregulated 2.92-fold in water-limited
plants and 6.4-fold in light-limited plants, with the ATP synthase and cytochrome
b
6/f
GO categories upregulated in light-limited plants (3.1- and 2.1-fold). Additionally, the
GO category annotated as PSII genes was upregulated 4.1-fold, with the PSII
polypep-tide subunit group upregulated 3.0-fold. RNA, DNA, and protein metabolism were
downregulated in copper- and shade-treated plants but upregulated in drought plants
relative to the controls. Copper-treated plants showed downregulation relative to the
control of chloroplast ribosomal proteins, consistent with the copper ion interacting
with photosynthetic membranes. Drought-treated plants showed an increase in the
expression of genes associated with lipid metabolism, as well as cellular organization
and vesicle transport, relative to the controls (Fig. 2). The common change observed
across treatments was an increase in the expression of protein degradation pathways.
We also observed responses in hormone signaling, cell structure, and stress pathways.
These results are supported by complementary quantitative reverse transcription
(qRT)-PCR analysis of the expression of a panel of selected genes (Data Set S1). Together,
these results indicate a unique response of plants to each treatment.
Global metabolite shifts indicate a specific host response to stress.
Leaf
me-tabolites were measured at the end of the treatments by using gas
chromatography-mass spectrometry (GC-MS) for four plants per treatment. We detected 122 unique
peaks and partially or fully identified 95 metabolites, which were further classified into
groups on the basis of host pathways or chemical functionality (Fig. 3). Consistent with
the transcriptome response, metabolites in the lipid synthesis group were upregulated
in water-limited plants. In copper-treated plants, we observed high levels of aromatics
and sugar conjugates, including phenolic glycosides. Central metabolites were
mod-erately affected by water limitation and copper treatments. Though copper induced a
moderate decrease in citrate, light limitation resulted in a decrease in multiple
tricar-boxylic acid (TCA) cycle metabolites (glycerate, succinate, methylmalonate), and
signif-icant increases in aconitate (Student’s
t
test,
P
⬍
0.05). These changes are consistent
on September 8, 2020 by guest
http://msystems.asm.org/
with other studies of the TCA cycle response to light (56). Metabolites in the amino acid
group showed similar response patterns between stresses and in general followed
patterns predicted by transcriptome analyses. Alanine, glutamate, aspartate, and the
precursor 5-oxo-proline were all decreased in response to the copper, water limitation,
and shade treatments, while glycine increased. In light-limited plants, glutamate and
gamma-aminobutyric acid increased while serine decreased. Lipids and
membrane-FIG 2 Plant transcriptional responses to treatments. Plant transcriptomes were sequenced (three per condition) and analyzed. (A) PCoA of normX expression profile. (B) PageMan analyses to determine over-and underrepresentation in treatments.
Effects of Stresses onPopulusRoot Microbiome
January/February 2018 Volume 3 Issue 1 e00070-17 msystems.asm.org 5
on September 8, 2020 by guest
http://msystems.asm.org/
associated metabolites were affected the most by copper treatment, with mono- and
digalactosylglycerol decreased 1.7-fold. The aromatic group includes a distinct set of
metabolites (including gallate, ferulate, coumarate, 1,2,4-benzene triol, 3- and
4-hydroxybenzoate, and catechin) that decreased in response to all treatments.
Salic-ylate (2-hydroxybenzoate) also increased moderately in all stresses. In the water
limitation treatment, multiple aromatic conjugates (purpurin and five partially
identi-fied caffeoyl conjugate peaks) increased. Copper treatment and water limitation
showed similar responses in the phenolic glycosides, with increases in nearly all of the
metabolites detected in this group. Overall, the shade-treated plants responded in
the opposite direction of copper and water limitation treatments with respect to the
phenolic glycoside group. Water and light limitation resulted in similar expression
patterns of sugar and sugar acids, though the changes were more pronounced in
light-limited plants. In light-limited plants, fructose decreased from 8,800
g/g of fresh
weight (gFW) in controls to only 835
g/gFW. Raffinose and sugar alcohols (including
arabitol, ribitol, glycerol, and
myo
-inositol) increased in water-limited plants. Both
erythronate and threonate were decreased in response to all treatments, and other
conjugated sugars decreased in shade plants, consistent with decreased metabolism in
leaves. We next correlated gene expression data with metabolite concentrations
(Pear-FIG 3 Leaf metabolite profile changes. Log2expression values are shown. Blue indicates a decrease
relative to the control, and yellow indicates an increase. Colors are z scaled within each compound group (i.e., amino acids, sugars, etc.).
on September 8, 2020 by guest
http://msystems.asm.org/
son
R
, Data Set S1). Of the 1,000 most significant correlations, azelaic acid was the most
highly correlated with gene expression data (60 genes), followed by the amino acids
lysine (35 genes) and serine (28 genes). In
Arabidopsis
, azelaic acid is a signaling factor
in systemic resistance that affect salicylic acid signaling and resistance to
P. syringae
pathogens (57).
Microbiome changes in response to stress.
Microbiome community composition
in the root and rhizosphere was measured by 16S amplicon sequencing and, at the
phylum level, is similar to that observed in other poplar microbiome studies, with a
high abundance of
Proteobacteria
and representation of
Actinobacteria
and
Verrucomi-crobia
(25, 26). Primary analyses of root (including both the internal and external root
environments) and rhizosphere communities showed clustering on the basis of
isola-tion compartment, and thus, further analyses were performed separately (Fig. S1; Data
Set S1).
Bacterial diversity, as measured by the Shannon H index, increased in root
commu-nities under water limitation and shade treatment but decreased in rhizosphere
com-munities under the same treatments (Fig. 4A and B). Microbial comcom-munities were
compared by using a weighted UniFrac distance metric and clustered by treatment
(Adonis,
P
⬍
0.001) for both root and rhizosphere communities (Fig. 4C and D; part 1of
Data Set S1). Analysis of clusters showed that treatments resulted in significant shifts in
FIG 4 Belowground microbiome community responses. (A) Shannon diversity index (H) for OTUs with
⬎0.01% relative abundance in the root compartment. (B) Shannon diversity index (H) for OTUs with
⬎0.01% relative abundance in the rhizosphere compartment (ctrl, control; cu, copper; dr, drought; sh, shade). (C) Weighted UniFrac PCoA of root communities showing clustering of communities by condi-tion. (D) Weighted UniFrac PCoA of rhizosphere communities showing clustering of communities by condition. (E) Bacterial OTUs upregulated (blue) or downregulated (dn.; orange) in response to stress in the root microbiome, with distance-based clusters identified by using the hclust and dynamic tree cut packages in R. (F) Bacterial OTUs up- or downregulated in response to stress in the rhizosphere, with distance-based clusters identified by using the hclust and dynamic tree cut functions in R.
Effects of Stresses onPopulusRoot Microbiome
January/February 2018 Volume 3 Issue 1 e00070-17 msystems.asm.org 7
on September 8, 2020 by guest
http://msystems.asm.org/
communities relative to the control and that treatments also resulted in different
communities relative to each other (Table 1). Clustering analysis of the community data
(Fig. 4E and F) indicated that a cluster of operational taxonomic units (OTUs) either
increase or decrease in abundance in response to treatment, with directionality and
magnitude similar between treatments.
We next investigated which specific root OTUs changed in response to each stress
condition. By this approach, we found 97 OTUs representing
Proteobacteria
,
Bacte-roidetes
,
Actinobacteria
,
Firmicutes
, and
Verrucomicrobia
(representing 10.3 to 14.9%
relative abundance) significantly increased or decreased (Student’s
t
test with
false-discovery rate [FDR] correction,
P
⬍
0.05, with
␣
⫽
0.10) in at least one treatment
(Fig. 5A; Data Set S1). Of the 97 OTUs that were significantly increased or decreased in
abundance, 68 were significant in more than one treatment, with the direction of
change consistent in every case. We observed similar behavior in rhizosphere data, with
only one example of an OTU having an opposite directional change (Data Set S1).
Overall, OTUs representing 10 to 14% of the total increased or decreased in all stress
treatments, while additional OTUs representing 0.3 to 7% of the total increased or
decreased in abundance in response to specific treatments only (Table 2).
To determine the predictability of stress responses in rhizosphere and root microbial
communities, we built a naive Bayes classifier using OTUs (present in at least 80% of the
samples) as features and treatments as labels. Prediction accuracy was tested by using
a leave-one-out strategy (Data Set S1). In the root microbial community, the classifier
predicted 21/31 treatments correctly. Within the stress treatments, the classifier
pre-dicted 21/23 cases as stress conditions (gray box in part 3 of Data Set S1). Further,
control samples were correctly predicted eight of eight times, with only two instances
of stress-treated samples predicted as controls. Analysis of the rhizosphere community
showed similar results, with 19/24 stress treatments predicted correctly as stress.
Control and copper samples overlapped, with two controls predicted as copper
treat-ments and four copper treattreat-ments predicted as controls. Interestingly, one of the
drought-treated plants (plant J) was predicted as a control in both root and rhizosphere
analyses.
To study microbial community structure, we calculated correlations between taxa
within the microbiome community by using SparCC (58). The top 10,000 edges were
used to generate networks for each treatment, and then the 20 most connected nodes
from each treatment and their immediate neighbors were selected to visualize
sub-networks for each treatment (Fig. S4). The subsub-networks from each treatment were then
merged to determine OTUs with correlations unique to treatments or shared between
treatments (Fig. 5B). Of the 807 OTUs included in the merged network, 108 were only
correlated with others in the control treatment, with 87, 130, and 107 in the three
stresses (copper, drought, and shade). These treatment-specific subnetworks had
sim-ilar taxonomic profiles dominated by
Proteobacteria
,
Actinobacteria
, and
Bacteroidetes
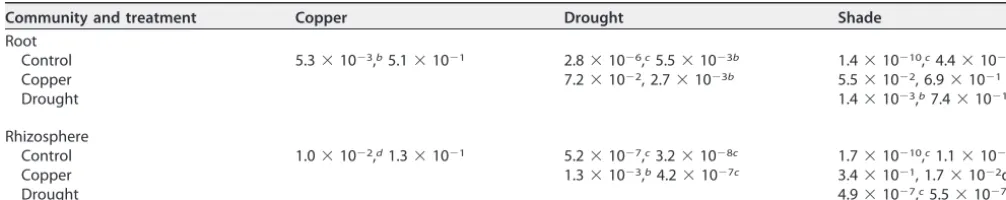
TABLE 1 Statistical tests of treatmentsa
Community and treatment Copper Drought Shade
Root
Control 5.3⫻10⫺3,b5.1⫻10⫺1 2.8⫻10⫺6,c5.5⫻10⫺3b 1.4⫻10⫺10,c4.4⫻10⫺2d
Copper 7.2⫻10⫺2, 2.7⫻10⫺3b 5.5⫻10⫺2, 6.9⫻10⫺1
Drought 1.4⫻10⫺3,b7.4⫻10⫺1
Rhizosphere
Control 1.0⫻10⫺2,d1.3⫻10⫺1 5.2⫻10⫺7,c3.2⫻10⫺8c 1.7⫻10⫺10,c1.1⫻10⫺11c
Copper 1.3⫻10⫺3,b4.2⫻10⫺7c 3.4⫻10⫺1, 1.7⫻10⫺2d
Drought 4.9⫻10⫺7,c5.5⫻10⫺7c
aResults of 999 Monte Carlo permutations to determine the significance of differences between weighted UniFrac distance metrics for communities subjected to
different treatments. The first value is the result of a pairwise test of distance within a column treatment compared to the distance between column and row treatments. The second value is for the distance within a row treatment compared to the distance between row and column treatments.
bP⬍0.01. cP⬍0.001. dP⬍0.05.
on September 8, 2020 by guest
http://msystems.asm.org/
FIG 5 Summary of the core genera in the root microbiome and their correlation structure. (A) OTUs were identified as significantly (sig.) up- or downregulated by using Student’sttests with FDR correction (␣⫽ 0.1). Significantly increased OTUs are indicated by yellow fill, decreased OTUs are indicated by blue fill, and no change is indicated by white fill. On the right are the genus level identifications of core OTUs (U stands for unidentified, to distinguish OTUs classified to higher taxonomic levels). Phyla are mapped to colors as shown by the key in panel A, with green shades representingAlphaproteobacteria,
Betapro-(Continued on next page)
Effects of Stresses onPopulusRoot Microbiome
January/February 2018 Volume 3 Issue 1 e00070-17 msystems.asm.org 9
on September 8, 2020 by guest
http://msystems.asm.org/
OTUs. There were 15 OTUs correlated with OTUs in all treatments (center subnetwork),
including seven
Proteobacteria
and four
Bacteroidetes
OTUs (Data Set S1). Bacteria
within these OTUs may be important in shaping the overall structure of the poplar root
microbiome.
The 97 OTUs identified as increased or decreased in abundance, which we term the
“core stress OTUs,” were analyzed for correlation with gene expression data or
metab-olite concentrations (Pearson correlation with a
P
value cutoff of
⬍
0.05; Data Set S1).
Genes that showed the highest number of correlations with OTUs included a
trans-membrane protein kinase (
Populus trichocarpa
013G030100,
Arabidopsis thaliana
ho-molog At1g057000) that was previously identified in a stress response study (59). OTUs
with the highest number of correlations included an OTU identified in the A4b family
of the
Anaerolineae
class which have little described function in ecosystems but are
hypothesized to contribute to carbohydrate degradation in anaerobic digesters (60).
Other uncultured OTUs included the NKB19 and WPS-2 phyla. OTUs within the
Rhizo-biales
order and the
Acidobacteriaceae
family were also identified as more frequently
correlated with gene expression data (Data Set S1). Core stress OTUs were correlated
(positively and negatively) with multiple metabolites in the phenolic glycoside and
sugar conjugate groups. OTUs correlated with multiple phenolic glycosides (2-
O
-salicyloylsalicin, salicortin, salicin, and grandidentatin) or sugar conjugates (purpurein
caffeoyl-3-
O
-quinic acid) include
Brevibacillus
,
Oxalobacteraceae
,
Paenibacillus
, and
Nia-bella
, which all have plant growth-promoting representatives. Within the
drought-responsive group, we observed OTU correlations between amino acid metabolites and
aromatic metabolites.
Burkholderia
,
Verrucomicrobia
,
Xanthomonadaceae
, and
Aci-dobacteria
OTUs show correlations with lysine and glutamine, catechol, and
caffeoyl-shikimate conjugates. Finally, in shade-responsive OTUs, we observed correlations in
the phenolic glycoside, sugar metabolism, and sugar conjugate groups, consistent with
significant changes in these metabolite groups in shade-treated plants.
Aeromicrobium
,
Spirosoma
, and
Luteolibacter
OTUs and an unidentified
Betaproteobacteria
OTU
corre-late with multiple metabolites in these groups.
DISCUSSION
In both natural and agronomic ecosystems, poor growth conditions can limit plant
productivity and ultimately decrease the biomass yield. In this work, we present a
systems level approach to the study of the phytobiome response to environmental
treatments that induce plant stress. Using a belowground microbiome inoculation
study and functional measures of plant growth, including gas exchange and
fluores-cence, plant transcriptional response, metabolite profile response, and microbiome
community response, we show that the plant and associated belowground bacteria
exhibit both stress-specific and core stress responses. This study suggests that the core
microbiome members identified above appear to be tightly coupled to the physiology
of the host plant and highlights the need for further testing to identify mechanisms of
community change and consequences for phytobiome function and fitness.
FIG 5Legend (Continued)
teobacteria,Gammaproteobacteria, orDeltaproteobacteriaas shown and white segments corresponding to unlisted phyla. (B) Correlation network analysis indicates individual treatment networks and OTUs correlated under multiple treatments. Pie charts indicate the taxonomy of nodes in subnetworks.
TABLE 2 Distribution of stress-responsive OTUs
No. of treatments/total
Relative abundance as % of total community (no. of OTUs)
Copper Drought Shade
3/3 10 (32) 13 (32) 14 (32)
2/3 12 (23) 16 (21) 18 (28)
1/3 0.3 (2) 7 (12) 0.5 (8)
on September 8, 2020 by guest
http://msystems.asm.org/
Plant responses, as measured by growth patterns, gas exchange and productivity,
and leaf gene and metabolite expression profiles, indicated that plants were stressed in
response to metal toxicity, water, and light limitation. However, the severity of the
stress was likely different among copper, drought, and shade treatments. Consistent
with previous studies, we observed decreases in plant productivity, shifts in gene
expression toward the production of cell wall components, and decreases in
photo-synthetic processes (61) in water-limited plants. Previous work has shown that stress
severity in drought treatments impacts the plant response at the physiological and
gene expression levels (62), which presumably has subsequent downstream effects on
the microbiome of the plant. The drought treatment in this study was cyclic, acute, and
implemented in accordance with the individual plant response. With this approach,
some plants experienced two drought cycles and others as many as five throughout the
treatment period; however, a consistent response in terms of a microbiome effect was
observed (Fig. 4 and 5). There may be a differential response in plants maintained under
long-term low-water conditions. Drought conditions affect both plant and soil
envi-ronments, and these soil environmental effects likely contributed to the observed
changes in the microbiome, especially in the rhizosphere (63). In contrast, the light
limitation treatment is more specifically a host effect, limiting changes in the soil
environment compared to water limitation. However, the reduced water requirements
of shaded plants, as well as the decreased soil temperature owing to lack of direct
sunlight may have affected environmental conditions and indirectly contributed to
changes in the microbiome. In this work, copper stress was likely the least severe of the
three treatments, as indicated by growth measurements and transcriptional responses.
The lower stress severity may explain the observed weaker changes in the microbiome
response. Conversely, the antimicrobial properties of copper may also have affected
root-associated microbes directly or indirectly (37), which might contribute to the
significant response in the gene expression results, which showed increases in the
biotic stress pathway. Despite the diverse environmental changes imposed by these
treatments, we did observe a common response in the microbiome community
struc-ture (Fig. 4 and 5) that is best explained by the influence of the stressed host plant. The
observation of a core stress microbiome was further supported by the results from a
naive Bayes classifier in which stress samples that were incorrectly identified were
primarily identified as one of the complementary stress treatments (Data Set S1).
The metabolic environment of the host contributes to the structure of the
micro-biome, either by modifying the metabolites available and the resulting competition or
by direct inhibition of specific microbes. In water-limited plants, we observed consistent
changes in metabolite profiles as consistent with other studies, which show increases
in amino acids, phenolic compounds, and soluble sugars and sugar derivatives in leaves
(64–67). Similarly, we observed changes in shaded plant metabolite profiles consistent
with other studies of light limitation (32, 33, 68). In Scots pine (
Pinus sylvestris
) trees,
shading leads to lipid-dominated respiration, as opposed to the
carbohydrate-dominated respiration that is observed in water-limited trees (69). In
Stellaria
, shading
changed the composition of gibberellins and auxin (70). Both shade and drought
conditions have been shown to modulate carbohydrate, amino acid, and lipid contents
in
Pinus
trees (69). However, it is not possible to conclude from this study or past studies
whether changes in leaf metabolite profiles are a direct response to the environment
and lead to changes in the microbiome or if the changes are a feedback result of
changes in the microbial community. Plant metabolites have been shown to impact the
microbial community (55), and inoculation by root microbes has been shown to impact
leaf metabolite profiles (17), confounding the cause-effect relationship between the
plant and its microbiome. Correlation analyses between OTUs and metabolites suggest
that phenolic glycosides or other sugar conjugates may be driving plant-microbe
interactions in this system, supporting the hypothesis that the plant host controls
microbiome community members through differential feeding or inhibition of
com-petitors. In addition, the identification of azelaic acid as highly correlated with gene
expression data suggests some level of systemic resistance response to stresses (57),
Effects of Stresses onPopulusRoot Microbiome
January/February 2018 Volume 3 Issue 1 e00070-17 msystems.asm.org 11
on September 8, 2020 by guest
http://msystems.asm.org/
potentially contributing to the microbes associated with the plant.
Anaerolineae
,
un-cultured phyla,
Rhizobiales
, and
Acidobacteriaceae
OTUs were correlated with gene
expression data, indicating a potential relationship between the microbiome response
and the plant response (Data Set S1). Further work is needed to elucidate the
relation-ships among gene expression, metabolite production, and OTU abundances in order to
understand and predict microbiome interactions with host plants.
In this work, we studied the endpoint response of the belowground microbiome to
plant stress. The analyses performed here and additional studies may enable strategies
for controlling the microbiome to achieve reduced stress in plants. Of great future
interest will be the dynamic response of the phytobiome to environmental stressors to
determine both the time scale of functional responses and the implications for the
microbial community associated with the plant. We did measure the photosynthesis
kinetics of drought-treated plants and observed a functional response at the
phytobi-ome level, but it is unclear how the microbiphytobi-ome responds during this dynamic time in
the environment. Some microbes may be fast responders, on the order of hours, while
others respond on the order of weeks. Additionally, the recovery of the plant
biome as a community after host stress is unknown. Understanding how the
micro-biome rebounds after stress will also help us identity which microbes are important
contributors to phytobiome function. Ultimately, it is the hope of the phytobiome
community that we will be able to use this to harness the adaptive power of the
microbiome and predictably modulate the system response.
Our bacterial community results indicate that high-level taxonomy may be
indica-tive of microbiome structure, with detailed functional changes attributed to specific
OTUs. Despite changes in relative abundances and correlation structures, we did
observe that high-level taxonomy (phylum and order) was similar between treatments
and similar to other poplar (25, 26) and other plant microbiome (71) studies.
Unique-ness thus appears at lower taxonomic levels (family and below). This pattern may be
associated with the broad phylogenetic relationship of complex phenotypes in the
Bacteria
kingdom. While some unique bacterial phenotypes are distributed within a
phylum, complex phenotypes tend to be conserved at the family level or a higher level
(72). Therefore, there is likely some commonality in the stressed environment or
community that imposes the observed distribution of phyla in plant microbiomes.
Further analyses identifying mechanisms leading to the observed stress response in the
microbiome are required.
In this work, we showed the response of the plant-microbiome system to diverse
environmental conditions. Ideally, these results will inform future studies to generate
and modulate communities with predictable and beneficial effects on the host plant.
MATERIALS AND METHODS
Germfree plants.P. deltoidesWV94 clones were maintained in greenhouses at Oak Ridge National Laboratory (Oak Ridge, TN) with 16-h days supplemented with 1,000-W high-pressure sodium halide lamps. Shoot tips collected from actively growing plants were sterilized by washing in 10% bleach, 70% ethanol, and five times in deionized water. Tips were rooted in tissue culture medium (1⫻Murashige and Skoog basal salt mixture, 5 g/liter charcoal, 30 g/liter sucrose, 1 ml/liter plant preservative mixture) to produce rooted cuttings. Initial rooted cuttings were serially cultured in the same medium to generate germfree experimental plants.
Microbiome isolation.The natural microbiome used for inoculation in the microbiome inoculation study was collected by harvesting 20 g of fine roots from aP. deltoidestree in the Oak Ridge National Laboratory complex in September 2014. Roots were washed with sterile water, ground in 10 mM MgSO4
with a mortar and pestle, and then centrifuged at 10,000⫻gfor 10 min to pellet the root-associated microbes. The pellet was resuspended in 25% glycerol and then stored at⫺80ºC until inoculation. After freezing, a sample was thawed to determine the number of CFU per milliliter to use for subsequent inoculation calculations. Axenic rooted cuttings ofP. deltoidesWV94 were planted in double-autoclaved soil inoculated with a natural microbiome isolated from wildP. deltoides.
Greenhouse conditions and treatments.P. deltoidesWV94 rooted cuttings were subcultured and rerooted in fresh medium. Rooted cuttings were selected and planted in 150 ml of autoclaved potting mix (Farfard 4M) mixed with 100 ml of microbiome inoculum at ~106 CFU/ml suspended in sterile
Hoagland’s No. 2 Basal Salt Mixture (Caisson Laboratories) (32 plants for stress study) or 100 ml of sterile Hoagland’s No. 2 Basal Salt Mixture (8 plants for uninoculated controls). After inoculation, plants were acclimated to greenhouse conditions via growth chamber (12 days) and then greenhouse (17 days at a
on September 8, 2020 by guest
http://msystems.asm.org/
photosynthetically active radiation [PAR] level of 500mol m⫺2s⫺1), and plant stress treatments (eight
plants per treatment) were initiated when plants reached a height of ~20 cm. Control plants were watered every day with Southern Ag 20/10/20 at 100 ppm dissolved in MilliQ-treated water. Cyclic water limitation stress was implemented on the basis of the individual plant response; specifically, plants were watered when the first fully expanded leaf drooped with the main vein parallel to the primary stem. Shade cloth that blocked 90% of the incoming radiation was used for light limitation, and shaded plants were watered as needed (about every 2 to 3 days). Copper sulfate (30M) was added to nutrient solution to achieve a final concentration of 34M to induce metal toxicity stress, and plants were watered daily. Treatments were applied for 22 days.
Plants were acclimated to the greenhouse, and the stress experiment was performed between 23 October and 14 November 2014 with a day/night cycle of 16/8 h. Natural light was supplemented with 1,000-W high-pressure sodium halide lamps. Control plants were watered to capacity every day with a 100 ppm Southern Ag nutrient solution. Water limitation stress was applied in cycles on the basis of the response of each plant. Plants were watered to capacity at extreme wilting (first full leaf vein parallel to stem). Plants were watered with the same nutrient solution with added 30M CuSO4(pH balanced to
nutrient solution, pH 5.34). Shade-treated plants were grown under 90% shade, leading to a maximum PAR level of 80mol m⫺2s⫺1. Shaded plants were watered as needed, approximately every 3 days.
Plant growth and physiology.Once every 7 days, all plants (eight per condition) were measured for chlorophyll content, shoot height, leaf number (leaves longer than 2 cm), and branch count (any branch containing a leaf longer than 2 cm). Chlorophyll content was measured on the fourth, fifth, and sixth fully expanded leaves with a SPAD-502Plus (Konica Minolta, Ramsey, NJ). Shoot height was measured from the base of the stem to the highest actively growing leaf. Leaves were counted beginning at the first leaf
⬎2 cm long. When the experiment was concluded, all leaves were scanned to measure the total leaf area and leaf samples were collected and measured for average LMA (mg/cm2) by using three 1-cm leaf
punches per plant taken from mature leaves, with statistical tests comparing the eight plants per treatment.
Gas exchange and chlorophyll fluorescence measurements were taken with an open photosynthesis system (LI6400XT; LI-COR, Lincoln, NE) fitted with a chlorophyll fluorescence chamber (6400-40; LI-COR Inc.). On days 12 to 18, gas exchange and chlorophyll fluorescence were measured once daily on two representative plants from the water limitation and control treatments at dark-adapted and PAR levels of 400 and 2,000mol m⫺2s⫺1. On days 15 and 16, gas exchange and chlorophyll fluorescence were
measured in four additional plants from the copper, water limitation, shade, and control treatments. The first fully expanded leaf of each plant measured was selected on day 12; gas exchange and fluorescence measurements were taken on this same leaf throughout the experiment. Before beginning the photosynthesis measurements, the leaves were dark adapted for 30 min. Each measurement included one dark-adapted fluorescence measurement that was combined with a gas exchange mea-surement. The dark-adapted measurement was followed by gas exchange measurements at ambient and maximum light levels. The ambient and maximum photosynthetic photon flux densities (PPFDs) were measured at 400 and 2,000mol m⫺2s⫺1, respectively. Chamber conditions were kept at a constant CO
2
flow rate of 400 ppm, and the relative humidity was controlled at 60 to 70%. Before measurement, the dark-adapted leaf was given 2 to 3 min to stabilize inside the chamber. For PPFD measurements at both 400 and 2,000mol m⫺2s⫺1, samples were allowed to stabilize for 5⫾1 min inside the chamber.
RNA sequencing and analysis.Stored leaf tissue was ground in liquid nitrogen, and total RNA was extracted by combining a cetyltrimethylammonium bromide (CTAB) lysis buffer method and a Spectrum plant total RNA extraction kit (Sigma-Aldrich, St. Louis, MO). Approximately 100 mg of flash-frozen ground tissue was incubated in 850l of CTAB buffer (1.0%-mercaptoethanol) at 56°C for 5 min, 600l of chloroform-isoamyl alcohol (24:1) was added, and samples were centrifuged at 14,000⫻gfor 8 min. The supernatant was removed and applied to the Spectrum plant total RNA extraction kit filter column (Sigma-Aldrich, St. Louis, MO). RNA was precipitated in 500l of 100% ethanol and applied to the Spectrum plant total RNA extraction kit binding column, and subsequent washes and elution were completed in accordance with the manufacturer’s instructions, including the optional on-column DNase treatment to rid the samples of residual genomic DNA. RNA quality and quantity were determined with a NanoDrop 1000 spectrophotometer (Thermo Scientific, Waltham, MA) and a Qubit fluorometer (Thermo Scientific, Waltham, MA).
Total RNA (1g) was sequenced at Oak Ridge National Laboratory by using a single lane of an Illumina MiSeq (Illumina Inc., San Diego, CA) per plant for three biological replicates. Data handling and processing were performed on the basis of our pipeline (73). The raw reads were first evaluated for quality with SolexaQA⫹⫹toolkits (74). The high-quality reads (phred quality score,⬎25; length after trimming,⬎25 bases) were obtained with the BWA dynamic trimming algorithm in the SolexaQA⫹⫹ toolkits, aligned with theP. trichocarpav3.0 genome with bowtie2 (75), and then used to generate read counts for statistical analysis. The count tables were normalized for statistical analysis as proposed by Law et al. (76). The MapMan software (77) was used for analysis and statistical testing for pathway differential expression (P⬍0.05, Wilcoxon rank sum test, Benjamini-Hochberg correction). Gene expression was further investigated by qRT-PCR analysis of a panel ofPopulus genes (Data Set S1). A RevertAid first-strand cDNA synthesis kit (Thermo Scientific, Waltham, MA) was used to synthesize cDNA from 3g of total RNA for subsequent qRT-PCR analysis. qRT-PCRs for plant targets were done by using SYBR green with ROX (Bio-Rad, Hercules, CA) in accordance with the manufacturer’s instructions, and reactions were run on an Applied Biosystems 7900HT instrument (Applied Biosystems, Foster City, CA).
Metabolomics and elemental analyses.Bulk leaf tissue was collected, flash frozen, and ground in liquid nitrogen, and then 50g was twice extracted overnight with 2.5 ml of 80% ethanol in water at
Effects of Stresses onPopulusRoot Microbiome
January/February 2018 Volume 3 Issue 1 e00070-17 msystems.asm.org 13
on September 8, 2020 by guest
http://msystems.asm.org/
room temperature. Sorbitol was added (to achieve a 10-ng/l final concentration) before extraction as an internal standard to correct for differences in extraction efficiency, subsequent differences in deriva-tization efficiency, and changes in sample volume during heating. Extracts were pooled, and 1 ml of the extract was dried with a nitrogen stream. Dried extracts were dissolved in acetonitrile,N-methyl-N -trimethylsilyltrifluoroacetamide with 1% trimethylchlorosilane was added, and samples were then heated for 1 h at 70°C to generate trimethylsilyl (TMS) derivatives (78, 79). After 2 days, aliquots were injected into an Agilent 5975C inert XL gas chromatograph-mass spectrometer (Agilent, Santa Clara, CA). The standard quadrupole gas chromatograph-mass spectrometer is operated in the electron impact (70 eV) ionization mode, targeting 2.5 full-spectrum (50 to 650 Da) scans per second, as described previously (79). Metabolite peaks were extracted by using a key selected ion, characteristicm/zfragment, rather than the total ion chromatogram, to minimize the integration of coeluting metabolites. The extracted peaks of known metabolites were scaled to the total ion current by using predetermined scaling factors. Peaks were quantified by area integration, and the concentrations were normalized to the quantity of the internal standard recovered and the amount of sample extracted, derivatized, and injected. A large user-created database (~2,300 spectra) of mass spectral electron impact ionization fragmentation patterns of TMS-derivatized compounds, as well as the Wiley Registry 10th edition combined with the National Institute of Standards and Technology 2014 mass spectral library, was used to identify the metabolites of interest to be quantified. There were four replicate plants per treatment, and treatment differences were tested for statistical significance with Student’sttests. Data are presented as log2fold
changes, which were calculated by determining fold changes defined as absolute values of changes up or down and then scaled by taking the logarithm of the data and applying a plus or minus sign to indicate an increase or decrease in expression, respectively. Flash-frozen leaf tissues were ground in liquid nitrogen and then dried. Samples were analyzed in triplicate for 60 s with the Bruker Tracer III-SD X-ray fluorescence instrument (Bruker, Billerica, MA) and the included vacuum pump at a voltage of 15 kV and a current of 25A. Spectra were collected with the S1PXRF software and analyzed with the ARTAX software provided by Bruker. Data were exported and further analyzed with Microsoft Excel (Data Set S1). Bacterial community analysis.Roots were collected from plants after 21 days of treatment. For 16S rRNA gene community analysis, the rhizosphere fraction was prepared by vortexing ~50 mg of roots in water and then pelleting the wash at 14,000⫻gfor 5 min. DNA was extracted from the pellet with the Mo Bio PowerSoil kit (Mo Bio Laboratories, Inc., Carlsbad, CA) in accordance with the manufacturer’s instructions. DNA was extracted from the remaining root material (here, the root) by homogenizing root tissue with three rounds of LN2 freeze and 1 min of bead beating, followed by the Mo Bio PowerPlant kit (Mo Bio Laboratories, Inc., Carlsbad, CA) in accordance with the manufacturer’s instructions.
The bacterial 16S rRNA gene was selectively amplified and barcoded by using established protocols utilizing PNA blockers to prevent plastid and mitochondrial 16S rRNA gene amplification (80). For initial primer ligation and amplification, the KAPA 2G PCR system was used with 515 forward and 806 reverse staggered primers for five PCR cycles. Following initial amplification, samples were bead purified (Agencourt AMPure XP) and then amplified with barcoded primers with the KAPA HiGi PCR system for 32 cycles. A total of 83 samples (root and rhizosphere for 40 plants plus three replicates of the inoculum) were pooled and then sequenced at Oak Ridge National Laboratory with a single 2⫻300 paired-end sequencing kit on Illumina MiSeq (Illumina Inc., San Diego, CA) with Nextera P1 primer. Reads were joined with the QIIME join_paired_ends script (81) by using default settings, unjoined reads were discarded, and then assembled reads were assigned to samples from barcodes by using split_libraries. Primers were removed with cutadapt (82) with a maximum error rate of 10%. OTUs were identified by open reference OTU picking by using the GreenGenes 13_5 97% database (83). Diversity analyses were run with the QIIME core_diversity_analysis script by using default parameters. Read counts ranged from 126,618 to 440,696 for root samples and 20,492 to 351,940 for rhizosphere samples, with one sample (root K) failing to sequence. Plant OTUs defined as reads clustering with mitochondrial chloroplast sequences were removed with QIIME (filter_taxa_from_otu_table). Samples were analyzed with the QIIME core_diversity-_analysis script and rarefied to 19,000 reads to accommodate samples with the lowest read counts for combined analysis of root and rhizosphere communities. The resulting OTU table was analyzed with the weighted UniFrac distance metric (84) by using principal-coordinate analysis (PCoA) and clustered by root or rhizosphere (Adonis,P⬍0.001), and the data were thus subsequently analyzed separately with QIIME, R (dynamicTreeCut) (85), and Microsoft Excel as described in Data Set S1. For Shannon diversity calculations, OTUs present at ⬎0.01% in samples were included to reduce noise associated with low-abundance taxa, and diversity was calculated with the formulaH⫽ ⌺pi ·ln(pi), wherepirepresents
the normalized population fraction of speciesi. Shannon diversity was averaged for eight plants per condition and compared in Student’sttests. A naive Bayes classifier was built with the python sklearn package by assuming a Gaussian distribution. OTUs present in at least 80% of the samples were use as features with treatments used as labels. For predictions, a leave-one-out strategy was implemented in which each sample was omitted from the training set and classified.
Community structure analysis. Co-occurrence correlation networks were determined for root samples by the SparCC method (58) for each stress condition. To capture OTUs consistently associated with plants in our experiment, OTU tables were filtered before network generation by omitting any OTU that occurred in⬍80% of the samples as a cutoff for potential contaminants and spurious reads. The average correlation out of 20 iterations was calculated, and then edges were selected to be significant atPvalues of⬍0.1 on the basis of 100 resampled OTU data sets, resulting in⬎100,000 edges per network. Network edges were reduced first by determining the relationship between the numbers of edges and nodes (Fig. S4A and B) and then by stepwise correlation (Fig. S4C to H). By this method, we selected the top 10,000 edges (sorted by descending correlation score) for analysis.
on September 8, 2020 by guest
http://msystems.asm.org/
Accession number(s).Raw data obtained in this study were deposited in the Sequence Read Archive (SRA) database under accession numberSRS1879507. Amplicon data obtained in this study are available in the SRA database under accession numberPRJNA400863.
SUPPLEMENTAL MATERIAL
Supplemental material for this article may be found at
https://doi.org/10.1128/
mSystems.00070-17
.
FIG S1,
TIF file, 0.2 MB.
FIG S2,
TIF file, 1.7 MB.
FIG S3,
TIF file, 0.5 MB.
FIG S4,
TIF file, 2.6 MB.
DATA SET S1,
XLSX file, 0.4 MB.
ACKNOWLEDGMENTS
This report was authored by UT-Battelle, LLC, under contract DE-AC05-00OR22725
with the U.S. Department of Energy (DOE). This research was funded by the U.S. DOE
Office of Biological and Environmental Research Genomic Science Program under Plant
Feedstock Genomics project DE-SC001043 and the Plant-Microbe Interfaces Scientific
Focus Area at Oak Ridge National Laboratory. Oak Ridge National Laboratory is
man-aged by UT-Battelle, LLC, for the U.S. DOE under contract DEAC05-00OR22725.
REFERENCES
1. Barnard RL, Osborne CA, Firestone MK. 2013. Responses of soil bacterial and fungal communities to extreme desiccation and rewetting. ISME J 7:2229 –2241.https://doi.org/10.1038/ismej.2013.104.
2. Jiang H, Ling Z, Zhang Y, Mao H, Ma Z, Yin Y, Wang W, Tang W, Tan Z, Shi J, Li L, Ruan B. 2015. Altered fecal microbiota composition in patients with major depressive disorder. Brain Behav Immun 48:186 –194.https:// doi.org/10.1016/j.bbi.2015.03.016.
3. Morgan XC, Tickle TL, Sokol H, Gevers D, Devaney KL, Ward DV, Reyes JA, Shah SA, LeLeiko N, Snapper SB, Bousvaros A, Korzenik J, Sands BE, Xavier RJ, Huttenhower C. 2012. Dysfunction of the intestinal micro-biome in inflammatory bowel disease and treatment. Genome Biol 13:R79.https://doi.org/10.1186/gb-2012-13-9-r79.
4. Turnbaugh PJ, Ley RE, Mahowald MA, Magrini V, Mardis ER, Gordon JI. 2006. An obesity-associated gut microbiome with increased capacity for energy harvest. Nature 444:1027–1031.https://doi.org/10.1038/ nature05414.
5. Vega Thurber RV, Willner-Hall D, Rodriguez-Mueller B, Desnues C, Ed-wards RA, Angly F, Dinsdale E, Kelly L, Rohwer F. 2009. Metagenomic analysis of stressed coral holobionts. Environ Microbiol 11:2148 –2163.
https://doi.org/10.1111/j.1462-2920.2009.01935.x.
6. Lebeis SL, Paredes SH, Lundberg DS, Breakfield N, Gehring J, McDonald M, Malfatti S, Glavina del Rio T, Jones CD, Tringe SG, Dangl JL. 2015. PLANT MICROBIOME. Salicylic acid modulates colonization of the root microbiome by specific bacterial taxa. Science 349:860 – 864.https://doi .org/10.1126/science.aaa8764.
7. Carvalhais LC, Dennis PG, Fan B, Fedoseyenko D, Kierul K, Becker A, von Wiren N, Borriss R. 2013. Linking plant nutritional status to plant-microbe interactions. PLoS One 8:e68555. https://doi.org/10.1371/journal.pone .0068555.
8. Hacquard S, Garrido-Oter R, González A, Spaepen S, Ackermann G, Lebeis S, McHardy AC, Dangl JL, Knight R, Ley R, Schulze-Lefert P. 2015. Microbiota and host nutrition across plant and animal kingdoms. Cell Host Microbe 17:603– 616.https://doi.org/10.1016/j.chom.2015.04.009. 9. Naveed M, Qureshi MA, Zahir ZA, Hussain MB, Sessitsch A, Mitter B. 2015.
L-Tryptophan-dependent biosynthesis of indole-3-acetic acid (IAA) im-proves plant growth and colonization of maize byBurkholderia phyto-firmansPsJN. Ann Microbiol 65:1381–1389.https://doi.org/10.1007/ s13213-014-0976-y.
10. Glick BR. 2005. Modulation of plant ethylene levels by the bacterial enzyme ACC deaminase. FEMS Microbiol Lett 251:1–7.https://doi.org/ 10.1016/j.femsle.2005.07.030.
11. Zahir ZA, Munir A, Asghar HN, Shaharoona B, Arshad M. 2008. Effective-ness of rhizobacteria containing ACC deaminase for growth promotion of peas (Pisum sativum) under drought conditions. J Microbiol Biotech-nol 18:958 –963.
12. Weston DJ, Pelletier DA, Morrell-falvey JL, Tschaplinski TJ, Jawdy SS, Lu TY, Allen SM, Melton SJ, Martin MZ, Schadt CW, Karve AA, Chen JG, Yang X, Doktycz MJ, Tuskan GA. 2012. Pseudomonas fluorescens induces strain-dependent and strain-independent host plant responses in de-fense networks, primary metabolism, photosynthesis, and fitness. Mol Plant Microbe Interact 25:765–778.https://doi.org/10.1094/MPMI-09-11 -0253.
13. Bates SL, Zhao JZ, Roush RT, Shelton AM. 2005. Insect resistance man-agement in GM crops: past, present and future. Nat Biotechnol 23: 57– 62.https://doi.org/10.1038/nbt1056.
14. Kurepin LV, Park JM, Lazarovits G, Hüner NPA. 2015. Involvement of plant stress hormones in Burkholderia phytofirmans-induced shoot and root growth promotion. Plant Growth Regul 77:179 –187.https://doi.org/ 10.1007/s10725-015-0049-7.
15. Fan L, Dalpé Y, Fang C, Dubé C, Khanizadeh S. 2011. Influence of arbuscular mycorrhizae on biomass and root morphology of selected strawberry cultivars under salt stress. Botany 89:397– 403.https://doi .org/10.1139/b11-028.
16. Dhawi F, Datta R, Ramakrishna W. 2015. Mycorrhiza and PGPB modulate maize biomass, nutrient uptake and metabolic pathways in maize grown in mining-impacted soil. Plant Physiol Biochem 97:390 –399.https://doi .org/10.1016/j.plaphy.2015.10.028.
17. Timm CM, Pelletier DA, Jawdy SS, Gunter LE, Henning JA, Engle N, Aufrecht J, Gee E, Nookaew I, Yang Z, Lu TY, Tschaplinski TJ, Doktycz MJ, Tuskan GA, Weston DJ. 2016. Two poplar-associated bacterial isolates induce additive favorable responses in a constructed plant-microbiome system. Front Plant Sci 7:497.https://doi.org/10.3389/fpls.2016.00497. 18. Labbé JL, Weston DJ, Dunkirk N, Pelletier DA, Tuskan GA. 2014. Newly
identified helper bacteria stimulate ectomycorrhizal formation in Popu-lus. Front Plant Sci 5:579.https://doi.org/10.3389/fpls.2014.00579. 19. Chiu HC, Levy R, Borenstein E. 2014. Emergent biosynthetic capacity in
simple microbial communities. PLoS Comput Biol 10:e1003695.https:// doi.org/10.1371/journal.pcbi.1003695.
20. Zelezniak A, Andrejev S, Ponomarova O, Mende DR, Bork P, Patil KR. 2015. Metabolic dependencies drive species co-occurrence in diverse microbial communities. Proc Natl Acad Sci U S A 112:6449 – 6454.https:// doi.org/10.1073/pnas.1421834112.
21. Pekkonen M, Ketola T, Laakso JT. 2013. Resource availability and com-petition shape the evolution of survival and growth ability in a bacterial community. PLoS One 8:e76471. https://doi.org/10.1371/journal.pone .0076471.
22. Foster KR, Bell T. 2012. Competition, not cooperation, dominates inter-actions among culturable microbial species. Curr Biol 22:1845–1850.
https://doi.org/10.1016/j.cub.2012.08.005.
23. Lau JA, Lennon JT. 2012. Rapid responses of soil microorganisms
im-Effects of Stresses onPopulusRoot Microbiome
January/February 2018 Volume 3 Issue 1 e00070-17 msystems.asm.org 15