Abstract: The main objective of this study is to examine the non-linear link between export upgrading and economic growth for 58 advanced and developing countries over the period of 1995-2015. For this purpose, an innovative dynamic panel threshold regression model (CS-ARDL) that allows control for cross-country heterogeneity, cross-sectional dependence, and feedback effects is employed to capture this non-linear relationship. The empirical results indicate that there exist threshold effects in the export upgrading-growth relationship. In particular, our findings suggest an inverted U-shaped relation between export sophistication and output growth. Below a critical level (1.3 for advanced countries and –0.7 for developing countries), more export complexity fosters economic growth. However, excessive export complexity might have adverse spillovers on long-term economic growth. Furthermore, we show that the effect of export sophistication on economic growth is asymmetric to advanced and developing countries when it is above and below the threshold level.
I INTRODUCTION
A
recent stream of the economic literature has shed new light on the role of export upgrading as an engine of economic growth. Rodrik (2006), in a pioneering study, observes that the sophistication level of China’s exports far exceeds what would be expected from its overall development level. The author concluded that what matters to a country’s economic growth is not purely how much it exports, but what it exports. In other words, countries that export products with a relatively high technological content benefit from positive externalities that help their economies grow faster (Sheridan, 2014). In a related study, Hausmann et al. (2007), based on a sample of 133 countries and highly disaggregated product categories,437
Re-Examining the Relationship Between Export
Upgrading and Economic Growth: Is there a
Threshold Effect?
Saafi Sami*
Monastir University, Tunisia
Nouira Ridha
Monastir University, Tunisia
show that the composition of a country’s export basket has important consequences for the pattern of development, and suggest that some goods have higher spillover effects than others. Similar evidence is provided by Jarreau and Poncet (2012) for Chinese provinces; they find that regions specialising in more sophisticated goods subsequently grow faster.
Hidalgo et al. (2007) and Hidalgo and Hausmann (2009) supplement Rodrik’s findings by showing that not all products carry the same consequences for a country’s development. Countries with more “complex” goods appear to grow faster. This result is confirmed by Felipe et al. (2012) and Poncet and de Waldemar (2013) who found that the complexity of a country’s exports is predictive of its future growth. Further insight is offered by Ferrarini and Scaramozzino (2016) who argue that a higher average level of complexity would positively affect the growth rate of the economy through the channel of human capital accumulation.
Although the aforementioned studies have provided valuable insights into whether and how export upgrading may affect growth, they rely exclusively upon a linear framework. This means that researchers often neglect a possible non-linear relationship between export upgrading and economic growth. Recent empirical evidence, however, suggests that this relationship is very likely to be non-linear in that the growth effect of export upgrading may vary under alternative economic or financial conditions (Sheridan, 2014; Zhu and Li, 2016; Teixeira and Queirós, 2016). In a number of earlier empirical studies, this type of non-linear behaviour has been parsimoniously captured by including an interaction term between export upgrading and some variables such as human capital (Zhu and Li, 2016), export share (Maggioni et al., 2016), and initial GDP per capita (Gala et al., 2018). Nevertheless, this modelling strategy a priori assumes that the effect of a variable that is interacted raises or declines monotonically with export upgrading and therefore may not detect a certain level of export upgrading that has to be attained. In this regard, employing an interaction term might be too restrictive to set up a non-monotonic and non-linear relationship between export upgrading and growth. Thus a more flexible estimation strategy should be adopted for a more accurate detection of the possible non-linearities in the export upgrading-growth relationship. In this paper, we aim to contribute to the current empirical literature by employing an innovative dynamic panel threshold regression model (CS-ARDL) developed by Chudik et al. (2017) to examine whether there exist threshold effects of export upgrading on economic growth. This modelling strategy has many advantages. First, it takes into account dynamics, country heterogeneity, cross-sectional dependence and feedback effects.1 Second, it captures the potentially non-monotonic effects without imposing any specific non-linear functional form. Third, the number and position of thresholds are not predetermined and they are both endogenously derived from the data. Fourth, it allows for more robust estimates by
utilising variation between countries as well as variation over time. To the best of our knowledge, this is the first study to employ Chudik et al.’s threshold model to examine the relation between export upgrading and economic growth.
From a policy perspective, exploring the potential existence of threshold effects in the export upgrading-growth nexus is of paramount importance. If there is clear evidence a that less sophisticated export basket significantly impedes economic growth, or that a threshold level exists, then policymakers should formulate and implement sound policies that promote the development of new more sophisticated products, rather than just expanding the export sector in boosting economic growth and development. In addition, knowing the tipping point in the relationship between export upgrading and growth is useful for policymakers, who should focus on other growth-enhancing policies if the appropriate export upgrading threshold has been reached.
The remainder of the paper is structured as follows. Section II describes the measurement methods of export upgrading. Section III presents the model and econometric methodology used in our analysis. Section IV describes the data sources and discusses the empirical results. Section V concludes.
II MEASURING EXPORT UPGRADING
In this paper, in line with Felipe et al. (2012); Poncet and De Waldemar (2013); Zhu and Li (2016); and Lectard and Rougier (2018), among others, we use the economic complexity index (ECI) developed by Hidalgo and Hausmann (2009) to measure the sophistication of a country’s export basket. The ECI is computed by combining relevant information on countries’ diversification and a product’s ubiquity. The former is defined as the number of products that a country exports with RCA (revealed competitive advantage), while the latter is defined as the number of countries that export the product with RCA. The intuition behind this measure is that a more complex economy is not just diverse, but it also primarily produces (and exports) less ubiquitous goods that are generally made by a few countries endowed with the required and specific capabilities. An economy is qualified as less complex when it makes a limited number of ubiquitous goods (Hartman et al., 2017).
Several other measures of export complexity (or sophistication), such as the one proposed by Rodrik (2006)2 and Hausmann et al. (2007), is also widely used in the empirical trade literature. This measure (called EXPY), however, has been questioned as it is computed by comparison to the income per capita level of countries with similar export structures, giving rise to a circular issue that “rich countries export rich-country products” (Hidalgo, 2009). Another caveat of the
EXPY measure is that it is still sensitive to the size of the country under investigation (Kumakura, 2007), and the choice of product nomenclature (Yao, 2009). To address these issues, Hidalgo and Hausmann (2009) propose an innova -tive measure of export complexity, which separates information on income per capita from that on network structure of economies and the goods they export. They identify complex products as those requiring a wide set of diverse and exclusive capabilities. Complex goods, therefore, are less ubiquitous – not easily achievable everywhere – and are expected to be produced by a limited number of countries endowed with numerous and exclusive capabilities (Maggioni et al., 2016).
In this regard, the recent work of Hidalgo and Hausmann (2009) is a novel contribution to the structural change literature. It allows us to provide a refined measure of the complexity of an economy’s productive structure. Ubiquity and diversification are the simplest proxies for complexity of a product and a country, respectively; they are computed as follows:
Ubiquity:
Kj = SlMjl (1)
Diversification:
Kj,0 = SlMjl (2)
where j denotes the country, l the product, and Mjl = 1 if country j exports product l with RCA3 and M
jl = 0, otherwise.
Then by making use of a new approach, so-called method of reflections, Hidalgo and Hausmann (2009) derive a refinement of the complexity measures in Equations (1) and (2):
1
Kl,n = ––– SjMjlKj,n–1 (3) Kl,0
1
Kj,n = ––– SlMjlKl,n–1 (4) Kj,0
where n stands for the number of iterations. Equations (3) and (4) are iterated until no additional information can be retrieved from the previous iteration, that is when the relative rankings of the values estimated using (3) and (4) in two subsequent iterations, n and n + 1, are the same.4
3 The index of RCA is defined following Balassa (1964) as the ratio of the export share of a given
commodity in the country’s export basket to the same share at the worldwide level. The algebraic expression is given by:
4See Felipe et al. (2012) and Poncet and De Waldemar (2013).
cjl@
Xj
RCAjl = –––––– S(cjl@
Xj)
Substituting (3) into (4), we obtain
1
Kj,n = ––– SlM~jj'Kj',n–2 (5) Kj,0
where
1 MjlMj'l
M~jj' = ––– Sl –––––– (6) Kj,0 Ml0
The economic complexity index (ECI) is then computed following Hidalgo and Hausmann (2009) as:
Kj – <K>
ECIj = –––––––– (7) stdev
Here, Kj refers to the eigenvector of M~jj' associated with the second largest eigenvalue. < > denotes an average and stdev is the standard deviation (Hausmann et al., 2014; Hartman et al., 2017).
The proposed ECI has three key features in comparison to other measures of export upgrading. First, it may reflect numerous product technological capabilities, such as technological diversification, the need for specific investments or a higher human capital content (Maggioni et al., 2016). Second, it circumvents the circularity issue whereby rich countries export rich-country goods (Lectard and Rougier, 2018). Third, as noted by Hidalgo and Hausmann (2009), it captures information about the complexity of the set of capabilities available within a country.
III ECONOMETRIC METHODOLOGY
To investigate the relationship between export upgrading and economic growth, we start with the traditional linear model which can be briefly defined as follows;
Yit = ai + bEXPUit + l'X'it + eit (8)
In order to examine whether there is a threshold effect between export upgrading and economic growth, Equation (8) according to Hansen (1999) can be written as:
Yit = b1'(1 EXPUitXit)'I(EXPUit < t) + b2'(1 EXPUitXit)'I(EXPUit³ t) + eit (9)
In Equation (9), the level of export upgrading (EXPU) is the threshold variable used to split the sample into different regimes or groups and t denotes the threshold parameter. I(.) is an indicator function taking on the value 1 if the value of the threshold variable EXPU is below a certain threshold value of t and takes 0 other -wise.This type of modelling framework allows the role of export upgrading to differ depending on whether EXPU is below or above a specific threshold value t.
A Method to estimate t in the case of non-dynamic panel models with fixed effects and homogeneous slopes is developed in a pioneer work by Hansen (1999). One of the appealing features of this approach is that it provides endogenous estimation of the threshold parameter. However, in its original setup, the method requires that all regressors are exogenous. Caner and Hansen (2004) extended the analysis of Hansen (1999) by allowing for endogenous regressors, but they continued to assume the threshold variable to be exogenous. More recently, Seo and Shin (2016) proposed a dynamic extension of Hansen’s (1999) panel threshold model to allow for endogenous threshold variable and regressors. Nevertheless, their model depends heavily on the assumption of slope homogeneity. To address this issue and account for cross-sectional dependence and feedback effects between export upgrading and growth, the cross-sectionally augmented ARDL (CS-ARDL) approach suggested by Chudik et al. (2017) and originally proposed by Chudik and Pesaran (2015) and Chudik et al. (2016) is employed, where Equation (10) can be expressed as follows:5
p p
Yit = ai + j'g(EXPUit, t) +
o
jilYit – l +o
bilEXPUit– l (10) l =1 l=0p p
+
o
g'ilX'it– l +o
y'ilZ–t–1 + w'i,gg– (t) + eit l =1 l =0Where, Xit= (Log(OPEN), Log(HC), Log(INV))', _ _ _____ __________ ________ _________ Zt = (Yt, EXPUt, Log(OPEN)t, Log(HC)t, Log(INV)t)',
__ 1 N _ _____ 1 N _____ __________ 1 N __________ Yt = —
o
Yit, EXPUt = —o
EXPUit,, Log(OPEN)t = —o
Log(OPEN)it, N i=1 N i=1 N i=1______ 1 N _______ _______ 1 N
Log(HC)t = —
o
Log(HC)it, Log(INV)t = —o
Log(INV)it. N i=1 N i=15 Following Chudik et al. (2016), we also consider the alternative approach of estimating the long-run effects
p
using the distributed lag (DL) counterpart of (8), given by Yit = ai + j'g(EXPUit, t) +
o
bil EXPUit–1 p i=0g(EXUPit, t) is the threshold variable, which takes the value of 1 if EXPU is above t and zero otherwise. The threshold coefficient, t, can then be determined by a covering search method (for more details see Chudik et al., 2017). Similarly to Chudik et al. (2017), we estimate the threshold panel model Equation (10) by the MG estimator introduced by Chudik et al. (1995). However, before estimating the equation, we first need to test for threshold effects. To this end, we follow Chudik et al. (2017) to use the Sup and Ave test statistics. They are computed as follows:
SupFtÎH = suptÎH [FNT(t)] (11)
1 AveF = –––
o
FNT(t) (12) #H tÎH(RSSr – RSSu)
/
r
where FNT(t) = –––––––––– ; RSSu stands for the residual sum of squares of the RSSu
/
(n–s)
unrestricted model and RSSr for the residual sum of squares of the restricted model under the null j = 0; n is the number of observations and s is the total number of estimated coefficients in the unrestricted model; H represents the admissible set of values for t, and #H is the number of elements of H. As mentioned in Chudik et al. (2017), the distributions of the SupF and AveF test statistics are non-standard, but they can be easily simulated.
IV DATA AND EMPIRICAL RESULTS 4.1 Data
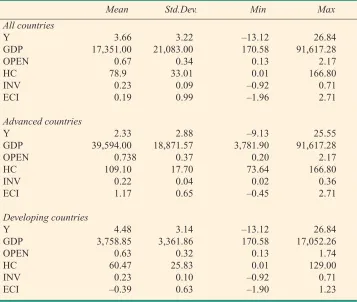
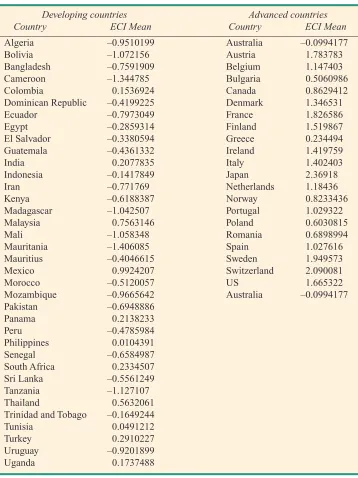
The annual data used in this study cover the period 1995-2015 for 58 advanced and developing countries. The selection of countries and sample period are dictated by data availability, especially the availability of data on the export upgrading indicator. Data on per capita GDP, trade openness, investment, and school enrolment are sourced from the online World Bank’s World Development Indicators database. The economic complexity index is from MIT’s Observatory of Economic Complexity6 (see Appendix A Table A3 for the list of countries and their mean values of the economic complexity index (ECI)). Descriptive statistics and correlation matrix between variables are summarised in Appendix A (Table A1 and Table A2).
4.2 Export Upgrading and Economic Growth: Evidence from Linear CS-ARDL Approach
We begin our analysis by considering a standard cross-sectionally autoregressive distributive lag panel model (CS-ARDL). The empirical results of the linear CS-ARDL model using Mean Group (MG) estimators are presented in Table 1.
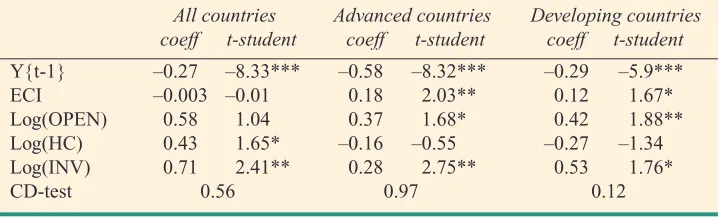
Table 1: Mean Group (MG) Estimates of the Long-Run Effects Based on the Linear CS-ARDL Approach
All countries Advanced countries Developing countries coeff t-student coeff t-student coeff t-student
Y{t-1} –0.27 –8.33*** –0.58 –8.32*** –0.29 –5.9*** ECI –0.003 –0.01 0.18 2.03** 0.12 1.67* Log(OPEN) 0.58 1.04 0.37 1.68* 0.42 1.88** Log(HC) 0.43 1.65* –0.16 –0.55 –0.27 –1.34 Log(INV) 0.71 2.41** 0.28 2.75** 0.53 1.76* CD-test 0.56 0.97 0.12
Source: Authors’ analysis.
Note: Statistical significance is denoted by: *** significant at 1 per cent, ** significant at
5 per cent, * significant at 10 per cent. CD statistic is associated to the Pesaran (2004) test. This statistic is shown to have a N (0,1) distribution under the null hypothesis of independence. This test is presented in Appendix B.
The findings indicate that export complexity (ECI) has a positive and significant effect on economic growth in both advanced and developing countries. This finding, which is consistent with those of Poncet and de Waldemar (2013) and Ferrarini and Scaramozzino (2016), implies that countries with a more complex export basket tend to grow faster than countries with a less complex export basket.
As regards the control variables, trade openness has a significantly positive effect on growth in most estimations, which is consistent with both the theoretical and empirical growth literature (see e.g. Dollar, 1992; Sachs and Warner, 1995; Harrison, 1996; Edwards, 1998; Easterly and Levine, 2001; Irwin and Tervio, 2002; Dollar and Kraay, 2003). Economic growth is also affected positively and significantly by the share of investment in GDP. On the other hand, the coefficient of the schooling variable, the proxy for human capital stock, is ambiguous in sign and insignificant in most cases.7 This finding may be surprising in light of the importance attached to human capital in endogenous growth models and the regressions results of Barro, 1991; Mankiw et al., 1992; Bassanini and Scarpetta, 2002; and Sala-i-Martin et al., 2004. A possible explanation is that we are able to obtain more optimistic outcomes about the role of human capital when threshold effect is properly taken into account.
4.3 Tests of Export Upgrading-Threshold Effects
In this sub-section, we examine the existence of threshold effects and the possibility of asymmetry in the impact of export upgrading on economic growth. To this end, we use the dynamic panel threshold approach recently developed by Chudik et al.
7Note that this finding is broadly consistent with Ben Habib and Spiegel (1994), Islam (1995), Barro (2001),
(2017). Table 2 reports the Sup and Ave test statistics for the whole sample as well as separately for advanced and developing economies.
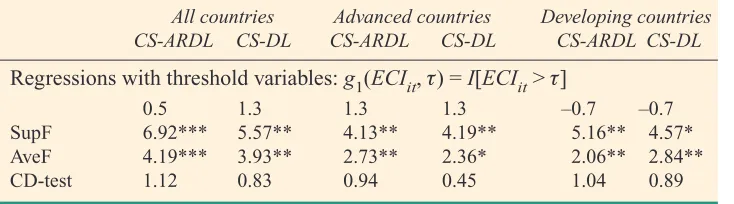
Table 2: Tests of Export Sophistication-Threshold Effects on Economic Growth
All countries Advanced countries Developing countries CS-ARDL CS-DL CS-ARDL CS-DL CS-ARDL CS-DL
Regressions with threshold variables: g1(ECIit, t) = I[ECIit > t]
0.5 1.3 1.3 1.3 –0.7 –0.7 SupF 6.92*** 5.57** 4.13** 4.19** 5.16** 4.57* AveF 4.19*** 3.93** 2.73** 2.36* 2.06** 2.84** CD-test 1.12 0.83 0.94 0.45 1.04 0.89
Source: Authors’ analysis.
Note: * Statistical significance is denoted by: *** significant at 1 per cent, ** significant
at 5 per cent, * significant at 10 per cent. We used lags (3,3,3) for all estimation. CD statistic is associated to the Pesaran (2004) test. This statistic is shown to have a N (0,1) distribution under the null hypothesis of independence. This test is presented in Appendix B.
The table shows that most results are statistically significant in all of the three panels, irrespective of the estimation procedure (CS-ARDL or CS-DL). Therefore, there is support for the presence of export sophistication–threshold effects on economic growth, with the estimates of the threshold being 1.3 for the entire sample, 1.3 for the advanced economies, and –0.7 for the developing economies. Interestingly, it appears that the effect of export sophistication on economic growth is more complex than the simple monotonic relation previously documented in the literature (e.g. Poncet and de Waldemar, 2013; Lectard and Rougier, 2018). Our results also indicate that the estimated threshold level of ECIin advanced countries is significantly higher compared to that of developed countries. This finding confirms to some extent the observation by Felipe et al. (2012) that the shares of complex products in exports increase with income, while the export share of the less complex products decreases with income.
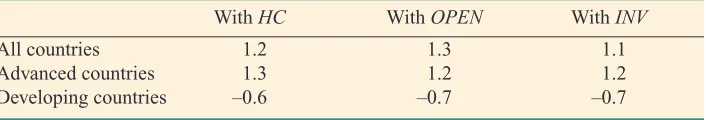
In order to further check the robustness of the estimated threshold values with respect to the inclusion of other control variables, we employ three additional growth determinant variables, namely human capital, investment, and trade openness. The empirical results for this extended set-up are summarised in Table 3. The results are quite similar8 to those reported in Table 2, thus confirming the robustness of our previous findings.
8 From Tables 2 and 3, it can be seen that there are very small differences in threshold estimates with and
Table 3: Robustness to the Inclusion of Hc, Openand Inv in the
Regressions: Tests of ECI-Threshold Effects (t^)
With HC With OPEN With INV
All countries 1.2 1.3 1.1 Advanced countries 1.3 1.2 1.2 Developing countries –0.6 –0.7 –0.7
Source: Authors’ analysis.
4.4 Results from a Panel Threshold-CS-ARDL Model
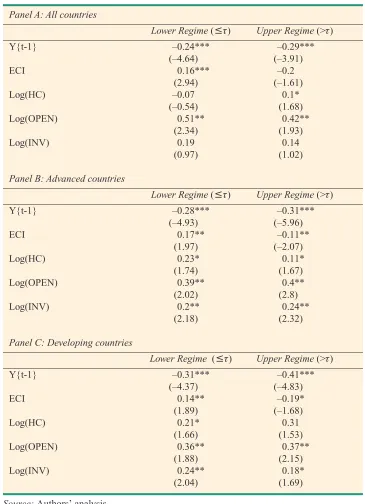
Once the threshold is obtained, we turn now to estimate the effects of export upgrading on economic growth. Table 4 presents the results of estimating Equation (8), with export complexity index (ECI) as an export upgrading indicator. Panel A shows the results for the full sample, whereas Panels B and C present the results for advanced and developing countries respectively.
As can be seen in Panel A of Table 4, for the full sample, export sophistication is positively related with economic growth at the 1 per cent significance level in the first regime regression in which the export complexity index is smaller than the threshold value (1.3). While the index increases and goes beyond the estimated threshold value, the initial positive relation vanishes and the effect of export sophistication on economic growth becomes negative. This is suggestive of an inverted U-shaped relationship between export sophistication and economic growth in the entire sample. Such an inverted U-shaped relationship remains valid even if we split our sample to advanced and developing countries with estimated thresholds equal to 1.3 and –0.7 respectively. This pattern is opposite to that obtained by Lectard and Rougier (2018) who conclude that export sophistication linearly increases with GDP per capita. This is the first study, to our knowledge, to report such a non-monotonic relation between export complexity and economic growth.9 What our results indicate is that excessive complexity may lead to lower growth. This “vanishing effect” could be channelled through the distributional effects of vertical specialisation trade or through the skilled-bias technical change. As shown by Ferrarini and Scaramozzino (2016), growth benefits from increased complexity depend on the potential trade-off between the gains from specialisation and the O-ring effects. Furthermore, our results tally with Teixeira and Queirós (2016), who provide empirical evidence suggesting that structural change can slow economic growth due to the huge mismatch between structural change processes and available skills of countries’ workforces.
It is also noteworthy with regard to the distribution of the export complexity index, that the majority of the developing countries in our sample are still on the
9 A similar inverted U-shaped relationship was also found between the share of manufacturing exports and
Table 4: Threshold Regression for Growth: Threshold Variable ECI
Panel A: All countries
Lower Regime (£t) Upper Regime (>t)
Y{t-1} –0.24*** –0.29*** (–4.64) (–3.91) ECI 0.16*** –0.2
(2.94) (–1.61) Log(HC) –0.07 0.1*
(–0.54) (1.68) Log(OPEN) 0.51** 0.42**
(2.34) (1.93) Log(INV) 0.19 0.14
(0.97) (1.02)
Panel B: Advanced countries
Lower Regime (£t) Upper Regime (>t)
Y{t-1} –0.28*** –0.31*** (–4.93) (–5.96) ECI 0.17** –0.11**
(1.97) (–2.07) Log(HC) 0.23* 0.11* (1.74) (1.67) Log(OPEN) 0.39** 0.4** (2.02) (2.8) Log(INV) 0.2** 0.24**
(2.18) (2.32)
Panel C: Developing countries
Lower Regime (£t) Upper Regime (>t)
Y{t-1} –0.31*** –0.41*** (–4.37) (–4.83) ECI 0.14** –0.19* (1.89) (–1.68) Log(HC) 0.21* 0.31
(1.66) (1.53) Log(OPEN) 0.36** 0.37**
(1.88) (2.15) Log(INV) 0.24** 0.18* (2.04) (1.69)
Source: Authors’ analysis.
Note: t-student are given in parentheses. Statistical significance is denoted by:
upward slopping part of the “complexity curve”. This in turn suggests that they can benefit from an increase in their export upgrading. On the other hand, the average level of export complexity for most advanced countries is relatively close to their estimated threshold.
Furthermore, we find that for developing economies the negative effect of a larger than critical level of export sophistication is more significant quantitatively than the positive effect from export sophistication below critical level. In addition, advanced economies have stronger positive effects when export sophistication increases from a level below critical level, compared to the negative effects when it is above the estimated threshold. As a result, there is an asymmetric impact of export sophistication on economic growth in advanced and developing countries around the estimated threshold. This finding may stem from the fact that the developed countries have more advanced productive capabilities (human and physical capital, the legal system, institutions, etc.) that allow them to exploit all the benefits from engaging in a process of export-sophistication and mitigate its adverse effects. Felipe et al. (2012) point out that the accumulation of capabilities in developing economies is generally hindered by information and coordination externalities that may give rise to market failures and inadequate action by the private sector. Cadot et al. (2011) also argue that in the case of countries that are not endowed with sufficient capabilities to produce more sophisticated goods, no industrial policy will make them successful exporters.
Among other results on the long-run estimates in Table 4, the coefficient of human capital stock is positive and weakly significant in most specifications for advanced and developing countries. This result seems to confirm the important role played by human capital in the growth process. On the other hand, the openness to trade appears statistically significant in all of the three panels. In addition, the coefficient estimate of the lagged GDP per capita variable is highly significant and negative, which is consistent with the hypothesis of conditional convergence (see Barro and Sala-i-Martin, 1991; 1992; Mankiw et al., 1992; Temple, 1999).
V CONCLUSION
The main objective of this paper was to re-examine the non-linear relationship between export upgrading and economic growth for 58 advanced and developing countries over the period of 1995-2015. For this purpose, a novel dynamic panel threshold model that allows control for cross-country heterogeneity, cross-sectional dependence, and feedback effects has been deployed.
However, excessive export complexity might have adverse spillovers on long-term economic growth. Furthermore, we found that the effect of export sophistication on economic growth is asymmetric to advanced and developing countries when it is above and below the threshold level.
We believe that our findings are of potential importance to policymakers in terms of optimising the export structure that needs to be undertaken to ensure that the maximum possible benefit for the economy can be achieved through the export sector. Specifically, a moderate level of complexity should be associated with optimal economic growth. Increasing export complexity for its own sake, therefore, may be counter-productive. Rather, policymakers should implement sound policies that will promote the development of new, more sophisticated products rather than expanding the export sector per se. Especially for developing countries with imperfect factor markets and unfavourable factor prices, upgrading exports by defying comparative advantage seems to be a real policy option (Lectard and Rougier, 2018). They could then focus on other growth-enhancing strategies if the appropriate export sophistication threshold has been achieved.
For future work, it would be interesting to investigate the circumstances under which export upgrading is growth-enhancing. That is to say, to what extent the effects of export sophistication are contingent on the level of economic, financial and institutional development, the capital and human stock, the degree of trade openness, and sound macroeconomic policies. Another question is whether there are more than two regimes. Is the effect of export upgrading on growth permanent or transitory? We leave these issues for future research.
REFERENCES
Acemoglu, Daron, Francisco A. Gallego and James A. Robinson, 2014. “Institutions, Human Capital,
and Development”, Annu. Rev. Econ. No. 6 (1), pp. 875-912.
Balassa, Bela, 1964. “The Purchasing-Power Parity Doctrine: A Reappraisal”, Journal of Political
Economy, No. 72 (6), pp. 584-596.
Barro, Robert J., 1991. “Economic Growth in a Cross Section of Countries”, The Quarterly Journal
of Economics, No. 106 (2), pp. 407-443.
Barro, Robert J., 2001. “Human Capital and Growth”, The American Economic Review, No. 91 (2),
pp. 12-17.
Barro, Robert and Sala-i-Martin Xavier, 1991. “Convergence Across States and Regions”, Brook.
Pap. Econ. Act. 1.
Barro, Robert and Sala-i-Martin Xavier, 1992. “Convergence”, Journal of Political Economy, No.
100 (2), pp. 223-251.
Bassanini, Andrea and Stefano Scarpetta, 2002. “Does Human Capital Matter for Growth in OECD
Countries? A Pooled Mean-Group Approach”, Economics letters, No. 74 (3), pp. 399-405.
Benhabib, Jess and Mark M. Spiegel, 1994. “The Role of Human Capital in Economic Development
Evidence from Aggregate Cross-Country Data”, Journal of Monetary Economics, No. 34 (2),
Cadot, Olivier, Céline Carrère and Vanessa Strauss-Kahn, 2011. “Export Diversification: What’s
Behind the Hump?”, Review of Economics and Statistics, No. 93 (2), pp. 590-605.
Caner, Mehmet and Bruce E. Hansen, 2004. “Instrumental Variable Estimation of a Threshold Model”,
Econometric Theory, No.20, pp. 813-843.
Chudik, Alexander and M. Hashem Pesaran, 1995. “Estimating long-run Relationships from Dynamic
Heterogeneous Panels”, Journal of Econometrics, No. 68 (1), pp. 79-113.
Chudik, Alexander and M. Hashem Pesaran, 2015. “Common Correlated Effects Estimation of
Heterogeneous Dynamic Panel Data Models With Weakly Exogenous Regressors”, Journal of
Econometrics, No. 188 (2), pp. 393-420.
Chudik, Alexander, Kamiar Mohaddes, M. Hashem Pesaran and Mehdi Raissi, 2016. “Long-Run Effects in Large Heterogeneous Panel Data Models with Cross-Sectionally Correlated Errors”,
Advances in Econometrics, in: Essays in Honor of Aman Ullah, Vol. 36, pp. 85-135 Emerald Publishing Ltd.
Chudik, Alexander, Kamiar Mohaddes, M. Hashem Pesaran and Mehdi Raissi, 2017. “Is There a
Debt-threshold Effect on Output Growth?”, Review of Economics and Statistics, No. 99 (1),
pp. 135-150.
Delgado, Michael S., Daniel J. Henderson and Christopher F. Parmeter, 2014. “Does Education Matter
for Economic Growth?”, Oxford Bulletin of Economics and Statistics, No. 76 (3), pp. 334-359.
Dollar, David, 1992. “Outward-oriented Developing Economies Really Do Grow More Rapidly:
Evidence From 95 LDCs, 1976-1985”, Economic Development and Cultural Change, No. 40
(3), pp. 523-44.
Dollar, David and Aart Kraay, 2001. “Trade, Growth and Poverty”, mimeo, Washington, D.C.: World Bank.
Easterly, William and Ross Levine, 2001. “It’s Not Factor Accumulation: Stylized Facts and Growth
Models”, World Bank Economic Review, No. 15, pp. 177-219.
Edwards, S., 1998. “Openness, Productivity, and Growth: What Do We Really Know?”, Economic
Journal, No. 108 (447), pp. 383-398.
Felipe, Jesus and Gemma Estrada, 2008. “Benchmarking Developing Asia’s Manufacturing Sector”,
International Journal of Development Issues, No. 7(2), pp. 97-119.
Felipe, Jesus, Utsav Kumar, Arnelyn Abdon and Marife Bacate, 2012. “Product Complexity and
Economic Development”, Structural Change and Economic Dynamics, No. 23 (1), pp. 36-68.
Ferrarini, Benno and Pasquale Scaramozzino, 2016. “Production Complexity, Adaptability and
Economic Growth”, Structural Change and Economic Dynamics, No. 37, pp. 52-61.
Gala, Paulo, Igor Rocha and Guilherme Magacho, 2018. “The Structuralist Revenge: Economic
Complexity as an Important Dimension to Evaluate Growth and Development”, Brazilian Journal
of Political Economy, Vol. 38, No. 2 (151), pp. 219-236.
Hansen, Bruce E., 1999. “Threshold Effects in Non-Dynamic Panels: Estimation, Testing, and
Inference”, Journal of Econometrics, No. 93, pp. 345-368.
Harrison, Ann, 1996. “Openness and Growth: A Time-Series, Cross-Country Analysis for Developing
Countries”, Journal of Development Economics, No. 48 (2), pp. 419-447.
Hartmann, Dominik, Migueler R. Guevarda, Cristian Jara-Figueroa, Manuel Aristaran and César
Hidalgo, 2017. “Linking Economic Complexity, Institutions, and Income Inequality”, World
Development, No. 93, pp. 75-93.
Hausmann, Ricardo, César A. Hidalgo, Sebastián Bustos, Michele Coscia, Sarah Chung, Juan Jimenez, Alexander Simoes and Muhammed A. Yıldırım, 2014. “The Atlas of Economic Complexity: Mapping Paths to Prosperity”, MIT Press.
Hausmann, Ricardo, Jason Hwang and Dani Rodrik, 2007. “What You Export Matters”, Journal of
Economic Growth, No. 12 (1), pp. 1-25.
Henderson, Daniel J., 2010. “A Test For Multimodality of Regression Derivatives With Application to
Hidalgo, César A., 2009. “The Dynamics of Economic Complexity and the Product Space Over a
42 Year Period”, Center for International Development Working Paper (189).
Hidalgo, César A. and Ricardo Hausmann, 2009. “The Building Blocks of Economic Complexity”,
Proceedings of the National Academy of Sciences, No. 106 (26), pp. 10570-10575.
Hidalgo, César A., Bailey Klinger, A.-L. Barabási and Ricardo Hausmann, 2007. “The Product Space
Conditions the Development of Nations”, Science, No. 317 (5837), pp. 482-487.
Irwin, Douglas A. and Marco Tervio, 2002. “Does Trade Raise Income? Evidence from the Twentieth
Century”, Journal of International Economics, No.58 (1), pp. 1-18.
Islam, Nazrul, 1995. “Growth Empirics: A Panel Data Approach”, The Quarterly Journal of
Economics, No. 110 (4), pp. 1127-1170.
Jarreau, Joachim and Sandra Poncet, 2012. “Export Sophistication and Economic Growth: Evidence
from China”, Journal of Development Economics, No. 97 (2), pp. 281-292.
Kumakura, Masanaga, 2007. “What’s So Special About China’s Exports? A Comment”, China &
World Economy, No. 15 (5), pp. 18-37.
Lall, Sanjaya, John Weiss and Jinkang Zhang, 2006. “The ‘Sophistication’ of Exports: A New Trade
Measure”, World Development, No. 34 (2), pp. 222-237.
Lectard, Pauline and Eric Rougier, 2018. “Can Developing Countries Gain from Defying Comparative Advantage? Distance to Comparative Advantage, Export Diversification and Sophistication, and
the Dynamics of Specialization”, World Development, No. 102, pp. 90-110.
Madsen, Jakob B., Paul A. Raschky and Ahmed Skali, 2015. “Does Democracy Drive Income in the
World, 1500-2000?”, European Economic Review, No. 78, pp. 175-195.
Maggioni, Daniela, Alessia Lo Turco and Mauro Gallegati, 2016. “Does Product Complexity Matter
for Firms’ Output Volatility?”, Journal of Development Economics, No. 121, pp. 94-109.
Mankiw, N. Gregory, David Romer and David N. Weil, 1992. “A Contribution to the Empirics of
Economic Growth”, The Quarterly Journal of Economics, No. 107 (2), pp. 407-437.
Poncet, Sandra and Felipe Starosta de Waldemar, 2013. “Export Upgrading and Growth: The
Prerequisite of Domestic Embeddedness”, World Development, No. 51, pp. 104-118.
Rodrik, Dani, 2006. “What’s So Special About China’s Exports?”, China & World Economy, No. 14
(5), pp. 1-19.
Sachs, Jefferey D. and Andrew Warner, 1995. “Economic Reform and the Process of Global
Integration”, Brookings Papers on Economic Activity, No.1, pp. 1-95.
Sala-i-Martin, Xavier, Gernot Doppelhofer and Ronald I. Miller, 2004. “Determinants of Long-Term
Growth: A Bayesian Averaging of Classical Estimates (BACE) Approach”, American Economic
Review, No. 94 (4), pp. 813-835.
Seo, Myung H. and Yongcheol Shin, 2016. “Dynamic Panels with Threshold Effect and Endogeneity”,
Journal of Econometrics, No. 195 (2), pp. 169-186.
Sheridan, Brandon J., 2014. “Manufacturing exports and growth: When is a Developing Country
Ready to Transition from Primary Exports to Manufacturing Exports?”, Journal of
Macroeconomics, No. 42, pp. 1-13.
Teixeira, Aurora A.C. and Anabela S.S. Queirós, 2016. “Economic Growth, Human Capital
and Structural Change: A Dynamic Panel Data Analysis”, Research Policy, No. 45 (8),
pp. 1636-1648.
Temple, Jonathan, 1999. “The New Growth Evidence”, Journal of Economic Literature, No.37 (1),
pp. 112-156.
Yao, Shunli, 2009. “Why are Chinese Exports Not So Special?”, China & World Economy, No. 17
(1), pp. 47-65.
Zhu, Shujin and Renyu Li, 2016. “Economic Complexity, Human Capital and Economic Growth:
APPENDIX A
Table A1: Descriptive Statistics of Variable
Mean Std.Dev. Min Max All countries
Y 3.66 3.22 –13.12 26.84 GDP 17,351.00 21,083.00 170.58 91,617.28 OPEN 0.67 0.34 0.13 2.17 HC 78.9 33.01 0.01 166.80 INV 0.23 0.09 –0.92 0.71 ECI 0.19 0.99 –1.96 2.71
Advanced countries
Y 2.33 2.88 –9.13 25.55 GDP 39,594.00 18,871.57 3,781.90 91,617.28 OPEN 0.738 0.37 0.20 2.17 HC 109.10 17.70 73.64 166.80 INV 0.22 0.04 0.02 0.36 ECI 1.17 0.65 –0.45 2.71
Developing countries
Y 4.48 3.14 –13.12 26.84 GDP 3,758.85 3,361.86 170.58 17,052.26 OPEN 0.63 0.32 0.13 1.74 HC 60.47 25.83 0.01 129.00 INV 0.23 0.10 –0.92 0.71 ECI –0.39 0.63 –1.90 1.23
Source: Authors’ analysis.
Table A2: Correlation Matrix
Y GDP OPEN HC ECI INV
Y 1 GDP –0.29 1 OPEN 0.02 0.21 1 HC –0.29 0.70 0.22 1 ECI –0.26 0.74 0.26 0.71 1 INV 0.16 –0.02 0.29 0.03 –0.04 1
Table A3: List and ECI Mean of Countries
Developing countries Advanced countries Country ECI Mean Country ECI Mean
Algeria –0.9510199 Australia –0.0994177 Bolivia –1.072156 Austria 1.783783 Bangladesh –0.7591909 Belgium 1.147403 Cameroon –1.344785 Bulgaria 0.5060986 Colombia 0.1536924 Canada 0.8629412 Dominican Republic –0.4199225 Denmark 1.346531 Ecuador –0.7973049 France 1.826586 Egypt –0.2859314 Finland 1.519867 El Salvador –0.3380594 Greece 0.234494 Guatemala –0.4361332 Ireland 1.419759 India 0.2077835 Italy 1.402403 Indonesia –0.1417849 Japan 2.36918 Iran –0.771769 Netherlands 1.18436 Kenya –0.6188387 Norway 0.8233436 Madagascar –1.042507 Portugal 1.029322 Malaysia 0.7563146 Poland 0.6030815 Mali –1.058348 Romania 0.6898994 Mauritania –1.406085 Spain 1.027616 Mauritius –0.4046615 Sweden 1.949573 Mexico 0.9924207 Switzerland 2.090081 Morocco –0.5120057 US 1.665322 Mozambique –0.9665642 Australia –0.0994177 Pakistan –0.6948886
Panama 0.2138233 Peru –0.4785984 Philippines 0.0104391 Senegal –0.6584987 South Africa 0.2334507 Sri Lanka –0.5561249 Tanzania –1.127107 Thailand 0.5632061 Trinidad and Tobago –0.1649244 Tunisia 0.0491212 Turkey 0.2910227 Uruguay –0.9201899 Uganda 0.1737488
APPENDIX B
The CD-Pesaran test is based on the average of the correlations between the residuals from a regression on each individual separately. Practically, consider the variable yi pertaining to the individual i. The variable is regressed on its first lag and the residuals are collected to compute rij which is the correlation coefficient between the residuals from individual i and
j regressions. The statistic:
________ 2CD = T N–1 N
!
–––––––o o
r^ij N(N – 1) i=1 j=i+1is shown to have a N (0, 1) distribution under the null hypothesis of independence, where