Address for correspondence E-mail: [email protected]
Development and Validation of RP-HPLC Method for the
Determination of Methamphetamine and Propranolol in
Tablet Dosage Form
G. A. SHABIR
School of Life Sciences, Oxford Brookes University, Oxford, Headington Campus, OX3 0BP, United Kingdom
Shabir: HPLC Method of Methamphetamine and Propranolol
A new isocratic reversed-phase HPLC method with diode-array UV detection was developed and validated for the determination of methamphetamine and propranolol in tablet dosage forms. Chromatography was carried out on an XTerra RP18 (150×4.6 mm, 5 µm) column using 50 mM pyrrolidine (pH 11.5) – acetonitrile (50:50, v/v) as mobile phase at a flow rate of 1 ml/min. Spectrophotometric detection was performed at a wavelength of 214 nm. The linearity was established over the concentration range of 0.075-0.60 mg/ml for both drugs. The correlation coefficients (r2) were ≥0.9998 in each case. The relative standard deviation values for intermediate precision studies were <1%. Statistical analysis of the data showed that the method was precise, accurate, reproducible and selective for the analysis of methamphetamine and propranolol drugs. The method was successfully employed for the determination of propranolol and methamphetamine in commercially available tablet dosage form.
Key words: Methamphetamine, propranolol, reversed-phase high-performance liquid chromatography, tablets, test method validation
Research
Paper
Methamphetamine is a popular recreational drug that has also had some historical use as a therapeutic agent. It increases alertness and energy, and in high doses, can induce mental/emotional, enhance self-esteem, and increase sexual pleasure[1,2]. It has a
history as a periodically popular drug of abuse, which at the time of writing is undergoing resurgence in
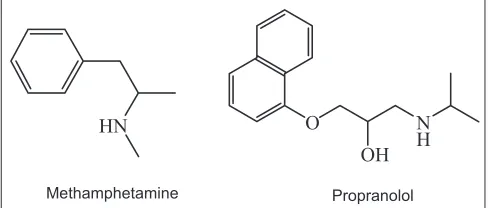
popularity[3]. Methamphetamine (MET, fig. 1) is the common name for N,α-dimethylphenethylamine, also
referred to as desoxyephedrine, methylamphetamine, phenylisopropylmethylamine, and a variety of other similar systematic names. MET is an amphetamine derivative and belongs to the class of amphetamines.
MET is a prototypical basic drug (pKa 9.9), and is readily extracted from biological material into organic solvents at alkaline pH.
Propranolol is a beta-adrenoceptor blocking drug (beta-blocker) mainly used in the treatment of angina and hypertension. It is the only drug proven effective for the prophylaxis of migraines in children. Propranolol (PRO, fig. 1) is available in
generic forms in tablet, oral solutions and syrups formulations as propranolol hydrochloride. PRO is
also used to lower blood pressure, abnormal heart
rhythms, heart disease and certain types of tremor. Unfortunately, supply of MET drug has increased dramatically on the European illegal market[4,5], including Macedonia. Consequently, the analysis of MET has become of increased interest from a point
of view of toxicology, occupational medicine and law enforcement. The literature presently describes
only one analytical method for analysis of MET and its metabolites in plasma using high-performance
liquid chromatography (HPLC) with C6 column[6]. Literature survey revealed that the reversed-phase liquid chromatography method of analysis has
Fig. 1: Chemical structures of component studied in this work
Methamphetamine
O
OH N H
Propranolol
not been explored for MET and PRO in single chromatographic run until to date. Therefore it
was felt necessary to develop a HPLC method for determination of MET and PRO. In view of this,
the present study describes the development of a
new, simple, rapid and robust HPLC method with
diode-array UV absorbance (DAD UV) detection for the determination of MET and PRO drug substance and from tablet formulations. Finally, the developed
method was validated to assess the validity of research data means determining whether the method
used during the study can be trusted to provide a genuine, account of the intervention being evaluated. As a best practice[7,8] in the subsequent investigation,
the new HPLC/DAD UV assay method was validated
according to criteria described in the literature[9,10].
MATERIALS AND METHODS
All chemicals and solvents were of analytical reagent grades. Acetonitrile was obtained from BDH (UK).
Methamphetamine
(N-methyl-1-phenyl-propan-2-amine), propranolol (RS
)-1-(isopropylamino)-3-(1-naphthyloxy)propan-2-ol) and pyrrolidine
(tetrahydropyrrole) were purchased from Sigma-Aldrich (UK). Ultra-purified (deionised) water was prepared in-house using a Milli-Q water system (Millipore, UK). Methamphetamine and propranolol tablets were obtained from local pharmacy (Oxford, UK).
A Knauer HPLC system (Germany) equipped with a model 1000 LC pump, an online degasser, model 3950 autosampler, and model 2600 photodiode-array detector was used. The data were acquired via Knauer ClarityChrom Workstation data acquisition software. XTerra RP18 (150×4.6 mm, 5 µm particle
size) column (Waters, UK) was used. The mobile phase consisted of a mixture of 50 mM pyrrolidine (pH 11.5) – acetonitrile (50:50, v/v) was used, at a flow rate of 1 ml/min. The injection volume was 10 µl and the UV detection wavelength was set at 214 nm. Reversed-phase HPLC analysis was performed isocratically at 30°.
Standard preparation:
Stock solutions of MET and PRO were prepared in
mobile phase at concentrations of 1 mg/ml (S1). The
solutions were stored at room temperature (22±1°)
until analysis. Series of standards for each of the
substance was prepared by progressive dilution of the
stock solution for calibration study. Fifteen millilitre
aliquot of S1 was transferred to another 50 ml volumetric flask and diluted in mobile phase yielding a final concentration of 0.3 mg/ml.
Sample preparation:
The mean weight of finally powdered PRO tablets containing 80 mg of PRO was accurately transferred into 50 ml volumetric flask and about 30 ml of mobile phase was added; the mixture was extracted in the ultrasonic bath for 10 min at room temperature and diluted with mobile phase to the mark. The supernatant liquid was filtered through 0.22 µm filter. Two millilitre of this solution was transferred to the 10 ml volumetric flask and diluted with mobile phase to the mark and 10 µl was injected into the
chromatographic system.
Specificity study:
The ability of an analytical method to unequivocally assess the analyte in the presence of other component in the formulation (impurities, degradations, excipients) can be demonstrated by evaluating
specificity. The specificity of the method was
determined by injecting placebo solution having the same concentration as that of the tablet solution. Forced degradation studies of the tablet sample
were also performed. Tablet samples were prepared
and degraded under stress conditions like acidic hydrolysis, basic hydrolysis, oxidative degradation, photo degradation and thermal degradation for HPLC method. For acid, base and oxidative degradation,
samples were individually placed into three volumetric flasks and then 0.1M HCl, 0.1M NaOH and 3% H2O2 were added separately into the flasks. All the three flasks were then heated in a water bath at 80° for 4 h. Acid and base treated sample were neutralised and all the three samples were then diluted to a concentration of 0.3 mg/ml with
the mobile phase. For thermal degradation sample
was exposed to heat at 60° for 4 h and for photo degradation, the drug sample was exposed under a UV lamp for 24 h. The samples were withdrawn and
analysed using HPLC/DAD UV.
RESULTS AND DISCUSSION
The procedure for the simultaneous analysis of MET and PRO using isocratic HPLC/DAD UV method is
(±0.1 unit), temperature (±2°), wavelength (±5 nm) and column from different lots were investigated. In
all cases, good separations of both drug components
were always achieved, indicating that the analytical
method remained selective and robust under the optimised conditions.
System suitability testing verifies that the HPLC
system is working as expected. It is based on the
concept that the equipment, electronics, analytical operations and samples to be analysed constitute an
integral system. System suitability was evaluated by injecting a solution of MET and PRO drugs at 100% test concentration (0.3 mg/ml) in six replicates at the
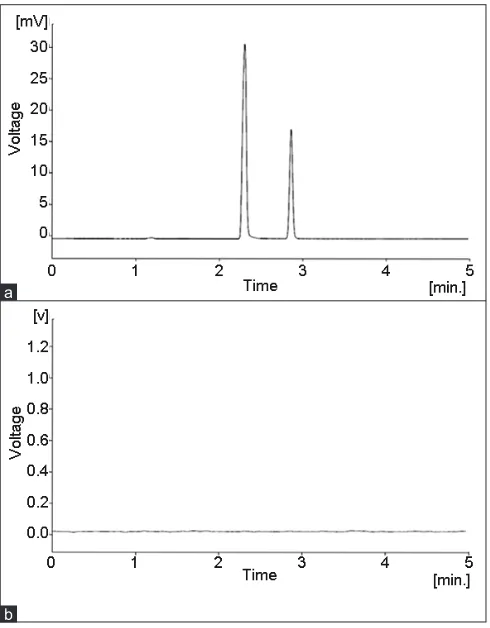
beginning of the validation run. System suitability parameters calculated from the chromatogram
(fig. 2a), such as peak capacity factor (K’), tailing
factor (T), resolution factor (Rs), theoretical plate
numbers (N, column efficiency) and percent relative
standard deviation (RSD) of peak areas are given in Table 1. The obtained values of these parameters
(1<k’<10, T≤2, RS>2, N>2000) show that the
proposed chromatographic conditions are suitable for separation of the analysed drug components. The solutions in various compositions and at different
pH values. The best separation was obtained using the mobile phase consisted of a mixture of 50 mM
pyrrolidine (pH 11.5) and acetonitrile (ACN) in ratio
of (50:50, v/v). In reversed-phase HPLC, the pH of the eluent can significantly influence the separation of components. Buffers are required when the sample
contains ionic or ionisable analytes. Without a buffer, poor peak shape and variable retention may result.
The organic buffer pyrrolidine (pKa 11.1) was chosen
for optimum column life time as phosphate buffers
accelerate the dissolution of silica at pH>7. Flow rates between 0.5 and 1.5 ml/min were studied. A flow rate of 1 ml/min gave an optimal signal to noise ratio with excellent separation time. The diode-array UV absorbance detector was set at 200 to 400 nm and MET and PRO drug components were extracted at maximum absorption at 214 nm and this optimal wavelength was chosen for the
assay method. The separation of basic compounds requires special reversed-phase (RP) chromatographic sorbents. Retention, selectivity and peak symmetry of basic compounds are strongly been influenced by the silica matrix. Strongly distorted peaks of
the basic compounds are often been observed when
unsuitable RP sorbents are used, due to the interaction
of the basic compounds with un-reacted silica gel
(SiOH) groups on the silica matrix[11]. XTerra RP 18
is a spherical porous silica carrier, in which the
starting silica material optimised in order to prevent
any secondary interactions with basic compounds. The usage of this type of column allows separation of basic compounds such as MET and PRO with dissociation constants values (pKa) of 9.9 and 9,
respectively without the need of ion pair reagents.
Using XTerra RP18, the retention times for MET
and PRO were found to be 2.30 and 2.86 min, respectively. Total time of analysis was <4 min. Using
these optimised conditions, typical chromatogram
obtained is illustrated in fig. 2a.
Robustness verification studies were also performed
in the method development phase. The robustness of
the analytical method is defined as the measure of its
capacity to remain unaffected by small but deliberate variations in the method parameters and provides an indication of its reliability during normal usage.
One way to gauge robustness is to examine some relevant factors, which might influence the reliability
of the developed method. Selected factors, namely
the mobile phase composition (±2 ml), flow rate
Fig. 2: HPLC chromatogram obtained from sample: (a) MET (tR=2.30 min) and PRO (tR=2.86 min) and (b) placebo
a
values for the injection repeatability (RSD<2%, n=6) show that the system is precise.
Linearity test solutions were prepared by diluting
stock solution (1 mg/ml) at six concentration levels
from 25 to 200% of analytes concentration (0.075-0.6 mg/ml) for both drugs. The solution was injected in triplicate and curves were obtained by plotting
the peak area against concentration of the drugs.
Linear calibration curves were generated using least-squares linear regression analysis. The mean of two different calibration graphs yielded the following
equations: y=203.17x-0.2552 (r2=0.9998) for MET and y=133.99x+5.0261 (r2=0.9999) for PRO (Table 2).
An excellent correlation exists between the peak areas
and concentration of MET and PRO drugs.
The precision of the test method was demonstrated by
intra-day and inter-day variation studies. The intra-day
(repeatability) studies were carried out by injecting six repeated injections of standard solution of 0.3 mg/
ml on the same day, by one analyst under the same experimental conditions. The RSD values for peak
areas were found to be 0.27% and 0.19%, respectively
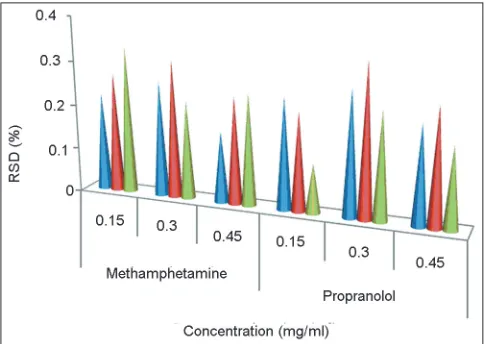
(Table 2). The intermediate precision (inter-day
variation) was studied over three consecutive days at three different concentration levels 0.15, 0.3 and 0.45 mg/ml for MET and PRO that cover the assay
range (80-120%). Three replicate injections were
injected for each solution. The mean and RSD across
the system were calculated from the individual peak area % purity mean values at the 50, 100 and 150% testing amounts. The precision was calculated as: %RSD=(SD/Mean)×100. The RSD values for peak areas obtained by both analysts were ≤1% (fig. 3), and met the intermediate precision criteria (RSD<2%) which illustrated the good precision of this analytical
method.
The accuracy of an analytical method is determined
by how close the test results obtained by that method
come to the true value. It can be determined by application of the analytical procedure to an analyte
of known purity (for the drug substance) or by recovery studies, where a known amount of standard
is spiked in the placebo (for drug product). In the
present study, a number of different solutions were prepared with a known added amount of 50, 100 and 150% for MET and PRO drug components
and injected in triplicate (n=3). Percent recoveries of response factor (area and concentration) were calculated ranged from 99.62-101.07% (Table 2) which indicated the accuracy of the method was accurate within the desired range.
Injections of the placebo were performed to demonstrate the absence of interference with the
elution of the MET and PRO drugs. These results
(fig. 2b) demonstrate that there was no interference from the other compounds and, therefore, confirm the specificity of the method. For the further evaluation
of the selectivity of the HPLC method, the forcibly
TABLE 1: SYSTEM SUITABILITY TEST PARAMETER
Parameter MET PRO
Retention time (min) 2.30 2.86 Retention factor (k) 1.14 2.56 Resolution (Rs) - 5.23 Tailing factor (T) 1.13 1.14 Plate number (N) 4362 5026 Injection repeatability* 0.36 0.29 *Six replicate injections, RSD (%)
TABLE 2: METHOD VALIDATION RESULTS
Validation parameter Drug substances
MET PRO
Linearity (0.075-0.6 mg/ml)
Regression equations (r2) y=203.17x - 0.2552
(0.9998) y=133.99x + 5.0261 (0.9999) Intra-day precision (RSD %)
0.3 mg/ml (n=6) 0.27 0.19 Accuracy/recovery (%)
0.15 mg/ml (50)a 99.84±0.22b 99.91±0.34
0.30 mg/ml (100) 99.98±0.11 99.82±0.28 0.45 mg/ml (150) 99.62±0.17 101.07±0.21 LOD µg/ml, (s/n)c 0.85, (s/n=3.2) 0.95, (s/n=3.3)
LOQ µg/ml, (s/n) 2, (s/n=10.3) 2.5, (s/n=10.2)
aApplied concentration % of target, bThe coefficient of variation (CV %), n=3, cSignal-to-noise ratio
Fig. 3: Comparison of intermediate precision evaluated over three days at three different concentration levels of drug analytes (n=3)
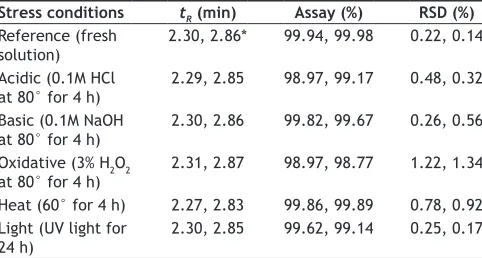
degraded tablet sample solutions prepared by subjecting the tablet samples to such stress conditions
as acid, base, heat, light and oxidative agent were
determined under the proposed optimised HPLC conditions. A summary data of the stress results
is shown in Table 3, which showed no changes
in retention times of drug components and no
degradation peaks were observed. This was further confirmed by peak purity analysis on a HPLC/DAD
UV and, therefore, confirms the specificity of the method.
The limit of detection (LOD) and limit of quantitation
(LOQ) were determined by the calibration plot method. A specific calibration plot was constructed
using samples containing amounts of analytes in
the range of LOD and LOQ. The values of LOD were 0.85 µg/ml (s/n=3.2) and 0.95 µg/ml (s/n=3.3) and LOQ were 2 µg/ml (s/n=10.3) and 2.5 µg/ml (s/n=10.2) for MET and PRO, respectively. LOD and LOQ were calculated by using the equations: LOD=Cd×Syx/b and LOQ=Cq×Syx/b where Cd and Cq are the coefficients for LOD and LOQ, Syx is the residual variance of the regression, and b is
the slope. Calculations were performed by using
values of Cd and Cq of 3.3 and 10. Precision at the limits of quantitation and detection was checked
by analysis of six test solutions prepared at three
levels. The RSD values for peak area were <5% for LOD and <2% for LOQ solutions (Table 2), which
indicates the sensitivity of the method is adequate.
The stability of analyte stock solutions with mobile
phase as solvent, stored at room temperature,
was studied for 48 h. No analyte (MET or PRO) degradation was detected during this time period (<2%).
To demonstrate the applicability of the present method, commercially available three batches of
tablets containing 5 mg MET and 80 mg PRO were
analysed. Assay results for three samples of tablets expressed as the percentage of the label claim,
were found 98.40-101.02 for MET and 98.66 to 102.11% for PRO. Results showed (Table 4) that
the content of MET and PRO in tablet formulation
were to the counter requirements (90-110% of the
label claim). The above results demonstrated that the developed method achieved rapid and accurate determination of compound studied and can be used for the simultaneous determination of MET and PRO in drug substances and pharmaceutical formulations.
A new isocratic RP-HPLC/DAD UV method has
been developed for the determination of MET and
PRO. Low cost, environment friendly, faster speed
analysis, and satisfactory precision and accuracy are the main features of this method. The method
was critically validated and statistical analysis of
generated high quality data proves that the method is
sensitive, specific and robust. The method is
stability-indicating and can be conveniently applied for the
testing of studied components raw materials, in tablet
formulations and batch release by industry.
ACKNOWELDGEMENTS
I thank Dr. Tony Bradshaw (School of Life Sciences,
Oxford Brookes University) for his support in buying
materials for research work.
REFERENCES
1. Logan BK. Methamphetamine - Effects on human performance and behaviour. Forensic Sci Rev 2002;14:133-51.
2. Mack AH, Frances RJ, Miller SI. Clinical textbook of addictive
disorders. 3rd ed. New York: The Guilford Press; 2005.
3. Anglin MD, Burke C, Perrochet B, Stamper E, Dawud NS. History of
TABLE 3: RESULTS OF THE STRESS CONDITIONS EXPERIMENTS
Stress conditions tR(min) Assay (%) RSD (%)
Reference (fresh
solution) 2.30, 2.86* 99.94, 99.98 0.22, 0.14 Acidic (0.1M HCl
at 80° for 4 h)
2.29, 2.85 98.97, 99.17 0.48, 0.32
Basic (0.1M NaOH
at 80° for 4 h) 2.30, 2.86 99.82, 99.67 0.26, 0.56 Oxidative (3% H2O2
at 80° for 4 h) 2.31, 2.87 98.97, 98.77 1.22, 1.34 Heat (60° for 4 h) 2.27, 2.83 99.86, 99.89 0.78, 0.92 Light (UV light for
24 h) 2.30, 2.85 99.62, 99.14 0.25, 0.17 *Data for methamphetamine and propranolol, respectively
TABLE 4: RECOVERY STUDIES OF METHAMPHETAMINE AND PROPRANOLOL CONTENT IN TABLETS
Comp. (lot no.) Added
(mg) Found (mg) n Recovery (%) 0(%)RSD
Methamphetamine
1 5 5.03 5 100.06-101.02 1.07 2 5 4.92 5 98.40-100.04 1.64 3 5 4.98 5 99.60-100.29 1.03 Propranolol 98.40-101.02
the methamphetamine problem. J Psychoact Drugs 2000;32:37-43.
4. Hague. European Union situationreport on drug production and drug
trafficking. EUROPOL, 2000-01, 2001.
5. Pelegrini M, Rosati F, Pacifici R, Zuccaro P, Romalo FS, Lopez A.
Rapid screening method for determination of ecstasy and amphetamines in urine samples using gas chromatography–chemical ionization mass
spectrometry. J Chromatogr B 2002;769:243-51.
6. Li NY, Li Y, Sellers EM. An improved HPLC method for analysis of
methamphetamine and its metabolites in plasma. Eur J Drug Metab Pharmacokinet 1997;22:427-32.
7. Shabir GA, Lough WJ, Shafique AA, Bradshaw TK. Evaluation and
application of best practice in analytical method validation. J Liq
Chromatogr Relat Technol 2007;30:311-33.
8. Shabir GA. HPLC method development and validation for
Accepted 8 August 2011 Revised 1 August 2011 Received 31 May 2010 Indian J. Pharm. Sci., 2011, 73 (4):430-435 pharmaceutical analysis. Pharm Technol Eur 2004;16:37-49.
9. ICH Q2 (R1), International Conference on Harmonization, Validation of Analytical Procedures: Text and Methodology, Geneva, Nov. 2005. 10. USP-33. United States Pharmacopeia, general Chapter: 1225, validation
of compendia procedures, Rockville, USA: United States Pharmacopieal
Convention; 2010.