Cumulative Effective Doses From Radiologic
Procedures for Pediatric Oncology Patients
WHAT’S KNOWN ON THIS SUBJECT: Risks associated with ionizing radiation for children are higher than those for adults, and the use of medical imaging continues to increase. There have been several high-profile publications on CEDs for adult patients but no similar pediatric studies.
WHAT THIS STUDY ADDS: This study is important in highlighting the significant exposure that can be accumulated by children through diagnostic and interventional radiologic procedures, and it discusses the issues of potential future malignancy risk and approaches to help minimize this risk.
abstract
OBJECTIVE:Our aim was to estimate the cumulative effective doses (CEDs) from radiologic procedures for a cohort of pediatric oncology patients.
METHODS:A retrospective cohort study of the imaging histories of 150 pediatric oncology patients (30 each in 5 subgroups, that is, leukemia, lymphomas, brain tumors, neuroblastomas, and assorted solid tu-mors) for 5 years after diagnosis was performed. All procedures in-volving ionizing radiation were recorded, including radiography, com-puted tomography (CT), nuclear medicine (NM) studies, fluoroscopy, and interventional procedures. CED estimates were calculated.
RESULTS:Individual CED estimates ranged from⬍1 mSv to 642 mSv, with a median of 61 mSv. CT and NM were the greatest contributors; CT constituted 30% of procedures but 52% of the total CED, and NM con-stituted 20% and 46%, respectively. There was considerable variability between tumor subgroups. CED estimates were highest in the neuro-blastoma (median: 213 mSv [range: 36 – 489 mSv]) and lymphoma (me-dian: 191 mSv [range: 10 – 642 mSv]) groups and lowest in the leukemia group (median: 5 mSv [range: 0.2–57 mSv]).
CONCLUSIONS:CEDs from diagnostic and interventional imaging for pediatric oncology patients vary considerably according to diagnoses, individual clinical courses, and imaging modalities used. Increased awareness may promote strategies to reduce the radiation burden to this population.Pediatrics2010;126:e851–e858
AUTHORS:Bilal A. Ahmed, MD,aBairbre L. Connolly, MB,
BCh,bPuneet Shroff, MA,bAmy Lee Chong, MB, BCh,c
Christopher Gordon, PhD,bRonald Grant, MD,cMark L.
Greenberg, MB, ChB,cand Karen E. Thomas, BM, BChb
aDepartment of Medical Imaging, University of Toronto, Toronto,
Ontario, Canada; and Departments ofbDiagnostic Imaging and cPediatrics, Hospital for Sick Children, Toronto, Ontario, Canada
KEY WORDS
ionizing radiation, radiation dose, computed tomography, cancer
ABBREVIATIONS
CED—cumulative effective dose CT—computed tomography NM—nuclear medicine
www.pediatrics.org/cgi/doi/10.1542/peds.2009-2675
doi:10.1542/peds.2009-2675
Accepted for publication Jun 25, 2010
Address correspondence to Karen E. Thomas, BM, BCh, Hospital for Sick Children, Department of Diagnostic Imaging, 555 University Ave, Toronto, Ontario M5G 1X8, Canada. E-mail: karen. thomas@sickkids.ca
PEDIATRICS (ISSN Numbers: Print, 0031-4005; Online, 1098-4275).
Copyright © 2010 by the American Academy of Pediatrics
FINANCIAL DISCLOSURE:The authors have indicated they have no financial relationships relevant to this article to disclose.
risks associated with ionizing radia-tion from radiologic procedures.1The
population radiation burden from medical imaging has increased seven-fold over the past 2 decades, with the greatest contributions and increases being primarily from computed tomog-raphy (CT) and nuclear medicine (NM).2
Children are particularly vulnerable, because they not only are more radio-sensitive than adults but also have a longer life expectancy over which the risk can become realized.3–5 Imaging
procedures involving ionizing radia-tion have a central role in the diagno-sis and management of many pediatric conditions. However, there is increas-ing awareness of the potential risks associated with cumulative exposure for patients who undergo frequent or repetitive studies.
To assess cumulative doses for individ-uals who are exposed to multiple ra-diologic modalities involving ionizing radiation (radiography, fluoroscopy, CT, and NM), a common dose metric is required. Effective dose is currently the most practical measure available to clinicians for this purpose. Several studies have investigated cumulative effective doses (CEDs) in adults,6–13
but published data for children are limited and are confined largely to studies involving plain radiography or head CT.14–16
Imaging is used extensively for diagno-sis and monitoring for pediatric oncol-ogy patients, and much of the imaging involves ionizing radiation. Although accurate, timely imaging is central to the care of these patients and contrib-utes to their survival, the use of serial, higher-dose, radiologic procedures in the first few years after diagnosis may lead to significant cumulative radia-tion exposure. As survival rates for childhood malignancies continue to
quelae related to all aspects of diagno-sis and management are of increasing importance. The purpose of this study was to document the cumulative radi-ation burden associated with diagnos-tic, interventional, and follow-up imag-ing in a cohort of pediatric oncology patients.
METHODS
A retrospective review of the imaging history for the 5 years after diagnosis was performed for 150 children who presented to our institution in 2001 with new malignancies. The study co-hort consisted of 30 consecutively pre-senting patients in each of 5 diagnostic subgroups, namely, leukemia, lympho-mas, brain tumors, neuroblastolympho-mas, and assorted solid tumors. All patients received their core and follow-up im-aging at this institution. Patients who received joint care, with follow-up im-aging performed in part at another in-stitution, were excluded. Institutional research ethics board approval was obtained.
Basic demographic data for each pa-tient were noted. Departmental pic-ture archiving and communication system, NM, and interventional data-bases were consulted to record all procedures involving ionizing radia-tion. For radiography, the number of radiographic views was recorded; for CT, the anatomic region of coverage and the number of scanning phases were recorded. Individual radioiso-tope doses were recorded in megabe-querels. Interventional fluoroscopy time and number of digital subtraction angiographic images were noted. Pa-tient age at the time of each procedure was recorded. Diagnostic images sup-plied by a referring hospital were in-cluded. Data were entered by 2 au-thors (Dr Ahmed and Mr Shroff) and were verified on a separate occasion
Age-specific effective dose estimates were tabulated for all procedures as outlined in Table 1. These estimates were derived from a combination of previously published institutional da-ta18(CT), patient-specific radioisotope
doses and published conversion ta-bles19 (NM), and data from the
pub-lished pediatric radiology litera-ture20–27(radiography, gastrointestinal/
genitourinary fluoroscopy, and NM). Interventional procedure doses were calculated by summing fluoroscopic doses (in-house measurements with a conversion coefficient28) and by
con-sidering each digital subtraction an-giographic frame as equivalent to a re-gional radiograph, on the basis of phantom studies.29 CED estimates
were calculated by summing effective doses over each patient’s imaging his-tory, by using descriptive statistics.
RESULTS
Demographic features of the study co-hort (N⫽150) and of each diagnostic subgroup (N ⫽ 30) are presented in Tables 2 and 3, with summary tumor staging data. The median age was 7.6 years (range: 0.1–17.3 years). Forty-one percent of the subjects were fe-male. Twenty-six children (17%) died during the 5-year follow-up period.
A total of 4338 procedures involving ionizing radiation were performed in the study cohort in the first 5 years after diagnosis, with a median of 19.5 procedures per patient (range: 2–109 procedures per patient). The distribu-tion of procedures according to imag-ing modality is presented in Table 4.
Individual estimated CEDs ranged from 0.0015 to 642 mSv (median: 61 mSv; mean: 113 mSv) (Fig 1); 41% (61 pa-tients) received estimated CEDs of
⬎100 mSv, 22% (33 patients) received
the median and range of estimated CEDs and the contribution of each im-aging modality according to diagnostic
subgroup. The median CED was lowest in the leukemia subgroup (5 mSv) and highest in the neuroblastoma
sub-group (213 mSv). Larger proportions of patients with lymphomas and neu-roblastomas received⬎100 mSv, com-pared with the other subgroups (lym-phomas, 83%; neuroblastomas, 80%; solid tumors, 40%; leukemia, 0%; brain tumors, 0%). The highest individual es-timated CED (642 mSv) occurred in the lymphoma subgroup.
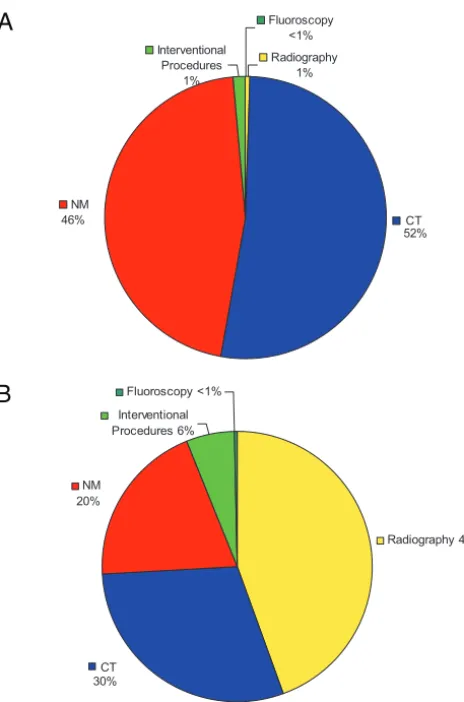
Figure 2 presents the relative contri-bution of each imaging modality, ex-pressed as a proportion of the total study cohort CED and as a proportion of the total number of procedures. CT and NM were the greatest contributors toward the total CED; CT constituted 30% of procedures but 52% of the co-hort CED, whereas NM constituted 20% of procedures and 46% of the CED. Plain radiographs represented 44% of studies but accounted for⬍1% of the CED.
TABLE 1 Age-Specific Effective Dose Estimates
Examination Newborn (0–0.5 y)
1 y (0.5–2.5 y)
5 y (2.5–7.5 y)
10 y (7.5–12.5 y)
15 y (⬎12.5 y)
CT,18mSv per study
Head, 1 phase 4.2 3.6 2.4 2 1.4
Head, 2 phases 9.1 7.1 4.8 4 2.9
Sinuses 0.3 0.3 0.2 0.2
Chest 2.8 3.4 3.7 4.1 2.8
Neck/chest/abdomen/pelvis 11.8 13.3 7.2
Chest/abdomen/pelvis 8 10.5 9.4 11.2 6.7
Abdomen/pelvis 13.1 11.1 8.4 8.9 5.9
Plain radiography, single views,20–22 mSv per view
Chest 0.016 0.016 0.016 0.016 0.02
Abdomen/pelvis 0.015 0.015 0.05 0.05 0.05
Skull/orbits/sinuses/nasopharynx 0.008 0.008 0.008 0.008 0.008 Spine (cervical, thoracic, or lumbar) 0.17 0.17 0.17 0.17 0.17
Extremities 0.0005 0.0005 0.0005 0.0005 0.0005
Plain radiography, examination series,20–22 mSv per study
Shunt seriesa 0.047 0.047 0.082 0.082 0.086
Skeletal surveysb 0.716 0.716 0.716 0.716 0.720 NM dose per unit of isotope,19mSv/MBq
Gallium-67 citrate 0.640 0.330 0.200 0.130
Technetium-99m-DMSA (renal scan) 0.037 0.021 0.015 0.011 Technetium-99m-MDP (bone scan) 0.027 0.014 0.011 0.007 Technetium-99m-DTPA (renal scan) 0.016 0.009 0.008 0.006 Technetium-99m red blood cell MUGA 0.039 0.021 0.014 0.009 NM, examination series,26,27mSv per study
Iodine-123-MIBG 5.3 3.5 3.7 4.3 6.1
Bone mineral densitometry 0.0005 0.0005 0.0005 0.0005 0.0005 Gastrointestinal/genitourinary fluoroscopy,23–25
mSv per study
Voiding cystourethrogram (female) 0.71 0.83 0.72 Voiding cystourethrogram (male) 0.91 0.89 0.64
Upper gastrointestinal series 3.14 3 3
Interventional fluoroscopy,28mSv/minc
Chest 0.086 0.104 0.126 0.144 0.25
Abdomen 0.116 0.181 0.193 0.194 0.265
Spine 0.1625 0.1625
DMSA indicates dimercaptosuccinic acid; MDP, methylene diphosphonate; DTPA, diethylene triamine pentaacetic acid; MUGA, multigated acquisition; MIBG,meta-iodobenzylguanidine.
aShunt series includes chest radiograph, abdominal radiograph, and 2 skull views. bSkeletal survey includes chest radiograph, 2 skull views, 4 spine views, and 8 extremity views.
cFluoroscopy data were derived individually for each examination by using fluoroscopy unit-specific surface entrance dose
and appropriate conversion coefficients from the National Radiological Protection Board.28Digital subtraction angiography
image doses were approximated by using plain radiography data.
TABLE 2 Demographic Features of Study Cohort
No. of Patients
Proportion Female, %
Age at Diagnosis, Median (Range), y
Leukemia 30 27 6.9 (1.8–16.1)
Brain tumors 30 47 7.7 (0.4–16.8)
Assorted solid tumors 30 47 8.3 (0.1–17.3)
Lymphomas 30 43 12.3 (1.9–17.3)
Neuroblastomas 30 40 2.6 (0.1–8.3)
Total 150 41 7.6 (0.1–17.3)
TABLE 3 Diagnostic Groups and Staging
Diagnostic Group n/N(%) Leukemia (n⫽30)
ALL, B cell
Total 26 (87)
Low risk 10/26 (38)
Intermediate risk 11/26 (42)
High risk 5/26 (20)
ALL, T cell 1 (3)
AML 3 (10)
Lymphoma (n⫽30) Hodgkin’s lymphoma
Total 17 (56)
Stage I 2/17 (11)
Stage II 8/17 (18)
Stage III 3/17 (47)
Stage IV 4/17 (24)
Non-Hodgkin’s’ lymphoma
Total 13 (44)
Stage I 1/13 (8)
Stage II 3/13 (23)
Stage III 9/13 (69)
Stage IV 0/13 (0)
Neuroblastoma (n⫽30)
Stage I 1/30 (3)
Stage II 4/30 (14)
Stage III 4/30 (14)
Stage IV 20/30 (66)
Stage IVS 1/30 (3)
Because of the heterogeneity of diagnoses within the cen-tral nervous system and solid-tumor groups, data are not included here. ALL indicates acute lymphoblastic leuke-mia; AML, acute myelocytic leukemia.
DISCUSSION
There is increasing awareness of the po-tential risks associated with ionizing ra-diation in diagnostic imaging proce-dures and, in particular, the greater radiosensitivity of children. A growing acceptance of the linear/no-threshold hypothesis of radiation exposure and of the likely cumulative nature of expo-sure30has led to concerns regarding the
potential long-term effects of repeated im-aging in childhood and young adulthood.
Readers may encounter numerous dose parameters used to assess the
radiation dose associated with radio-logic procedures. These parameters
include surface and organ doses (in milligrays), radionuclide activity mea-sures (in megabecquerels), and for-mulated descriptors designed to
re-flect modality-specific technology, such as the volume CT dose index (in milligrays) and dose-length product (in milligray-centimeters) for CT. It is
not possible to compare these differ-ent dose metrics easily. A common measure is required for quantification and comparison of diverse radiologic
Radiological Protection as the sum of the absorbed doses in all tissues and organs of the body, each weighted ac-cording to its radiation sensitivity, and
is measured in millisieverts. Effective dose allows the conversion of expo-sure to a localized region of the body into a whole-body equivalent with re-spect to radiation detriment. A variety of models are used to derive effective dose estimates from the various dose parameters available for each imaging modality. The effective dose of a pedi-atric chest radiograph is the order of 0.01 to 0.02 mSv, that of a voiding cys-tourethrogram 0.5 to 1 mSv, that of a
chest CT scan 2 to 4 mSv, that of a bone scan 4 to 7 mSv, and that of a gallium scan 25 to 50 mSv. Knowledge of the effective doses of radiologic proce-dures enables comparison with other imaging modalities or with annual background radiation (⬃3 mSv) and estimation of CEDs from multiple sources.
We have demonstrated significant vari-ability in the CEDs received by pediatric oncology patients, both between indi-viduals within a tumor subgroup and between subgroups. Radiation expo-sure varies on the basis of diagnoses, individual clinical courses, and imag-ing modalities used most frequently. CT and NM accounted for⬎95% of the total cohort CED. The number of plain
radiographs was higher, but they con-tributed only minimally to CEDs. Fluo-roscopy and interventional
proce-No. of Procedures, Median (Range)
All Procedures
Plain Radiography
CT NM Angiointerventional Fluoroscopy
Leukemia 9.5 (2–63) 7 (1–50) 0 (0–11) 0 (0–3) 1 (1–14) 0 (0–0) Brain tumors 11 (2–30) 4 (0–24) 4 (0–13) 0 (0–2) 1 (0–4) 0 (0–0) Assorted solid
tumors
34 (6–103) 14 (1–63) 13 (2–39) 2 (0–22) 1 (0–6) 0 (0–2)
Lymphomas 23 (9–75) 10.5 (0–42) 7 (2–28) 3.5 (1–24) 0 (0–4) 0 (0–2) Neuroblastomas 58 (8–109) 16 (1–64) 12 (2–37) 15 (1–46) 2 (0–15) 0 (0–2) Total 19.5 (2–109) 9 (0–64) 6 (0–39) 2 (0–46) 1 (0–15) 0 (0–2)
0 5 10 15 20 25 30 35
0 40 80
120 160 200 240 280 320 360 400 440 480 520 560 600 640 CED
%
of
pa
tie
nt
s
FIGURE 1
Distribution of individual CED estimates for total study cohort (N⫽150). The median individual CED estimate was 61 mSv.
TABLE 5 CED Estimates According to Diagnostic Subgroup and Imaging Modality
CED Estimate, Median (Range), mSv
All Procedures Plain Radiography CT NM Angiointerventional Fluoroscopy
dures were also relatively low contributors.
The leukemia and brain tumor sub-groups underwent the fewest proce-dures (median CED:⬍12 mSv). Routine use of MRI in the follow-up monitoring of brain tumors, with less use of CT, is an important factor. Disease surveil-lance in leukemia is centered on clini-cal symptoms and laboratory parame-ters, typically with infrequent need for high-dose modalities.
Patients with neuroblastomas had the highest overall median CED (213 mSv). Regular follow-up CT was the largest contributor, followed by NM
proce-dures. Patients with lymphomas had
the next highest median CED (191 mSv). This subgroup underwent fewer CT and NM procedures than did the solid-tumor group, but the high dose derived from serial gallium scans (me-dian scan dose: 38 mSv) led to overall higher CEDs. The individual with the highest CED estimate (642 mSv) be-longed to the lymphoma group and is in clinical remission to date. This
pa-tient underwent 6 radiographs, 14 CT scans (10 with neck, chest, abdomen, and pelvis coverage), and 13 NM proce-dures (all gallium scans) during the 5-year follow-up period. In the interval
since this study, positron emission to-mography has become available at our institution and has replaced the use of gallium for patients with lymphomas. Although positron emission tomogra-phy doses are still moderately high (5– 8 mSv),31 this change in practice
can be expected to result in dose re-ductions for future patients.
There is limited published pediatric lit-erature for comparison. Holmedal et al16demonstrated CEDs of up to 63 mSv
(mean: 19 mSv) for children undergo-ing serial head CT scans related to ven-triculoperitoneal shunts. Other pediat-ric studies confined themselves to plain radiography.14,15Our study
repre-sents the first pediatric cohort study to include all ionizing imaging modalities.
There are more data for adults. In the largest study, Sodickson et al6
re-viewed the CT histories of adult pa-tients at a tertiary academic center. They found a mean CED of 54 mSv (me-dian: 24 mSv; maximum: 1375 mSv). Other studies investigated specific pa-tient diagnostic groups or clinical set-tings, including Crohn disease,7renal
colic,8,9cardiac disease,10cystic
fibro-sis,11trauma,12and the emergency
de-partment.13 Some studies were
con-fined to estimation of cumulative CT doses,6,8,9,11–13but others attempted to
include all ionizing modalities.7,10
Pa-tient numbers, selection criteria, follow-up periods, imaging modalities included, and data presented varied, but maximal CEDs of 153 to 579 mSv, means of 11 to 122 mSv, and medians of 9 to 91 mSv were reported. These compare with our cohort mean CED of 113 mSv, median of 61 mSv, and maximum of 642 mSv. Therefore, the level of exposure of some children is of the same order as that of many adult patients.
Sodickson et al6 found that 15% of
adult patients had estimated CEDs above 100 mSv, the level at which the Biological Effects of Ionizing Radiation VII report32from the National Academy CT
30% NM 20%
Interventional Procedures 6%
Fluoroscopy <1%
Radiography 44%
CT 52% NM
46%
Interventional Procedures
1%
Radiography 1% Fluoroscopy
<1%
A
B
FIGURE 2
A, Percentage contribution of each imaging modality to total study cohort CED. Contributions within each modality were as follows: CT: body, 86%; head, 10%; sinuses,⬍1%; other, 3%; NM: gallium, 61%; bone, 27%; renal, 2%; other, 10%; radiography: spine, 41%; chest, 35%; abdomen, 17%; skeletal survey, 6%; other, 1%. B, Percentage contribution of each imaging modality to number of procedures per-formed for the study cohort. Contributions within each modality were as follows: CT: body, 76%; head, 18%; sinuses, 3%; other, 3%; NM: bone, 42%; renal, 18%; gallium, 15%; other, 25%; radiography: chest, 65%; extremities, 15%; abdomen, 11%; spine, 7%; other, 2%.
The larger proportion of our patients (41%) with CEDs above this level likely reflects the increased imaging re-quirements of oncology patients, com-pared with a nonselected patient group with both benign and malignant conditions.
Our study has several limitations. Be-cause this was a retrospective study, CEDs might have been underestimated if patients underwent imaging proce-dures at other institutions. Efforts were made to minimize this. Any avail-able initial diagnostic procedures that had been performed elsewhere were included in the study, as were any sub-sequent follow-up scans forwarded to the patients’ oncologists. A small number of outside procedures might be unaccounted for but we would an-ticipate their contribution to be small, because we included only pa-tients whose care was centralized at our institution. An advantage of a ret-rospective study is the potential to avoid any bias in imaging requisition behavior induced by awareness of an ongoing study.
Determination of representative effec-tive doses for a large number of differ-ent procedures for children of varying ages presents many challenges. Doses for each procedure vary with patient age and size, technical parameters in use at that date (in general, doses have decreased in our department over the past 10 years), and the equipment used (for example, 3 CT scanners were in service during the study period). Whenever possible, efforts were made to use individual and/or departmental dose data, rather than published data from other institutions. CT doses were based on our institutional data18and,
unlike in most previous studies, in-cluded assessment of the number of contrast phases used, which may af-fect doses by a factor of ⱖ2. With
were based on the individual recorded activity (in megabequerels) adminis-tered. Interventional radiology doses were calculated by using patient-specific fluoroscopy times and num-bers of digital subtraction angiogra-phy exposures but were simplified to estimates of posteroanterior and lat-eral projections, because we did not have individual data on projection geo-metric features or magnification. Pub-lished literature data were used for doses for plain radiography and fluo-roscopy, procedures that are at the lower end of the dose range or were performed relatively infrequently.
Another limitation that affects the pre-cision of dose estimates is the use of 5-year age categories; effective dose data were not available for narrower age brackets. This could result in some overestimation or underestimation of doses for patients at the limits of their age group. Given the complexities of pediatric dosimetry, however, we think that our study represents a reason-ably accurate estimation of CEDs and one that is more institution-specific than many previous pediatric and adult studies.
Our study findings reflect our institu-tional imaging practices. Other prac-tices may use imaging modalities in different proportions or frequencies, depending on availability, local exper-tise, preferences, and perhaps varying attitudes toward the potential risks of ionizing radiation.
Exploration of the relationship be-tween CEDs and tumor stages or ther-apy regimens was beyond the scope of this work but is a key area for future study. We have since completed fur-ther investigation into the role and contribution of diagnostic and sur-veillance imaging in the lymphoma subgroup.33
It is important to attempt to interpret
ficult to put the potential long-term risks of diagnostic imaging related to the care of patients with acknowl-edged life-threatening conditions in meaningful context. The benefits of ac-curate, timely imaging are immense and must not be underestimated. Sur-vival rates for childhood cancer have increased considerably over the past 3 decades, however, with a current over-all 5-year survival rate of 81% and sur-vival rates of⬎85% for Hodgkin’s dis-ease, acute lymphoblastic leukemia, and Wilms tumor.17Therefore, it is
in-cumbent on us to consider all possible sources of potentially harmful, long-term effects.
The Biological Effects of Ionizing Radia-tion VII report32estimated an excess
lifetime cancer risk of 1 case in 1000 population for a standardized popula-tion receiving 10-mSv exposure. Ap-proximately one-half of those cancers may be expected to be fatal. There is an inverse exponential relationship be-tween estimated risk and age of expo-sure, with children being at greater risk than adults and the youngest chil-dren being at the greatest risk. The ex-cess lifetime risks are estimated at 1.4 case (boys) and 2.6 cases (girls) per 1000 population for exposure at the age of 10 and 1.8 and 3.3 cases per 1000 population, respectively, at the age of 5.6,32 If we consider a
mixed-gender risk factor of 2 cases per 1000 population per 10 mSv, then exposure to the median CED of our study cohort (61 mSv) at the age of 10 might result in an excess lifetime cancer risk of 1.2%. Individuals receiving⬎100 mSv (41% of our cohort) might have an ex-cess risk of⬎2%, and those receiving
⬎200 mSv (22%) might have an excess risk of⬎4%.
conditions that might themselves re-duce life expectancy further than ex-pected for age- and gender-matched control subjects.6Nearly two-thirds of
pediatric cancer survivors experience some late effects resulting in signifi-cant long-term morbidity and, in some cases, death34; these include cardiac,
pulmonary, and endocrine disorders, infertility, neurocognitive defects, and secondary neoplasms.34,35 Survivors
are already known to be at greater risk of future malignancies than the back-ground population, with a relative risk of 14.8 of developing a second malig-nant neoplasm being demonstrated in a population treated between 1970 and 1986, before contemporary levels of di-agnostic imaging-derived radiation ex-posure.34Both chemotherapy and
ra-diotherapy regimens are thought to be significant contributing factors.35Any
additional risk associated with diag-nostic radiology must be considered concomitantly.
Approaches to ensure that exposure of this vulnerable population to diagnos-tic imaging radiation is appropriate and is minimized where possible cen-ter around the 2 principles of radiation protection, that is, justification for a procedure and optimization of its performance. Increased awareness among referring physicians of the rel-ative magnitude of radiation doses as-sociated with imaging procedures and of current risk estimates is an essen-tial first step.36,37With the advent of the
recent “Image Gently” campaign led by the Alliance of Radiation Safety in Pedi-atric Imaging38and an improving
liter-ature base on effective doses in medi-cal imaging,39knowledge is becoming
more widely disseminated.
Whenever an imaging request is con-sidered, an assessment of the risk/ benefit balance for the individual pa-tient should be made, with due consideration of the expected impact on clinical management.40The use of
alternative nonionizing modalities (ul-trasonography and MRI) should be promoted wherever appropriate and available. When CT is required, age-related CT protocols and new techno-logic advances in dose reduction should be used.41,42Ultra-low-dose
pro-tocols for specific indications should be developed (eg, low-dose sinus CT for exclusion of fungal disease for pa-tients with neutropenia).18 Follow-up
intervals for high-dose procedures must be appropriate, and careful con-sideration should be given to the radi-ation burden when surveillance proto-cols are determined by national pediatric oncology organizations.
Finally, our study has demonstrated significant cumulative ionizing radia-tion exposure from medical imaging for a subgroup of pediatric patients. This may raise awareness of other pa-tient groups that may be undergoing regular surveillance imaging for non-malignant conditions, including in-flammatory bowel disease, cystic
fi-brosis, congenital cardiac defects, renal calculi, and ventriculoperitoneal shunt management. We must take this opportunity to audit and to reexamine our pediatric imaging practices to ensure that any potential risks are minimized.
CONCLUSIONS
The range of CEDs received by pediat-ric oncology patients from diagnostic and follow-up imaging is wide. This study provides the first such data in a pediatric patient population undergo-ing serial imagundergo-ing involvundergo-ing multiple ionizing modalities. Some patients un-derwent reassuringly few imaging procedures, but others received high cumulative exposure. With current im-provements in patient survival rates
and increasing focus on minimizing the long-term effects of therapeutic regimens, it is incumbent on us to con-sider the potential long-term risks as-sociated with ionizing radiation in medical imaging. It is hoped that in-creasing awareness of the cumulative diagnostic radiation exposure to which pediatric oncology patients are exposed will encourage strategies to reduce radiation burdens wherever possible.
ACKNOWLEDGMENT
We are grateful for the assistance of Maria Green in extracting data from the departmental NM database.
REFERENCES
1. Brenner DJ, Hall EJ. Computed tomography: an increasing source of radiation exposure.
N Engl J Med. 2007;357(22):2277–2284 2. Mettler FA, Thomadsen BR, Bhargavan M, et
al. Medical radiation exposure in the US in 2006: preliminary results.Health Phys. 2008;95(5):502–507
3. Brenner DJ, Elliston CD, Hall EJ, Berson WE. Estimated risks of radiation-induced fatal cancer from pediatric CT.AJRAm J Roent-genol. 2001;176(2):289 –296
4. Brody AS, Frush DP, Huda W, Brent RL;
Amer-ican Academy of Pediatrics, Section on Ra-diology. Radiation risk to children from computed tomography.Pediatrics. 2007; 120(3):677– 682
5. National Cancer Institute. Radiation risks and pediatric computed tomography (CT): a guide for health care providers. Available at: http://www.cancer.gov/cancertopics/ causes/radiation-risks-pediatric-CT. Ac-cessed August 3, 2009
6. Sodickson A, Baeyens PF, Andriole KP, et al. Recurrent CT, cumulative radiation
expo-sure and associated radiation-induced can-cer risks from CT of adults.Radiology. 2009; 251(1):175–184
7. Desmond AN, O’Regan K, Curran C, et al. Crohn’s disease: factors associated with ex-posure to high levels of diagnostic radia-tion.Gut. 2008;57(11):1524 –1529
8. Katz SI, Saluja S, Brink JA, Forman HP. Radi-ation dose associated with unenhanced CT for suspected renal colic: impact of repeti-tive studies.AJRAm J Roentgenol. 2006; 186(4):1120 –1124
department patients evaluated for sus-pected renal colic.J Emerg Med. 2007;33(2): 161–168
10. Bedetti G, Botto N, Andreassi MG, Traino C, Vano E, Picano E. Cumulative patient effec-tive dose in cardiology.Br J Radiol. 2008; 81(969):699 –705
11. Donadieu J, Roudier C, Saguintaah M, Mac-cia C, Chiron R. Estimation of the radiation dose from thoracic CT scans in a cystic fi-brosis population. Chest. 2007;132(4): 1233–1238
12. Salottolo K, Bar-Or R, Fleishman M, et al. Current utilization and radiation dose from computed tomography in patients with t r a u m a . C r i t C a r e M e d. 2 0 0 9 ; 3 7 ( 4 ) : 1336 –1340
13. Griffey RT, Sodickson A. Cumulative radia-tion exposure and cancer risk estimates in emergency department patients undergo-ing repeat or multiple CT.AJRAm J Roent-genol. 2009;192(4):887– 892
14. Donadieu J, Zeghnoun A, Roudier C, et al. Cumulative effective doses delivered by ra-diographs to preterm infants in a neonatal intensive care unit.Pediatrics. 2006;117(3): 882– 888
15. Thierry-Chef I, Maccia C, Laurier D, Tir-marche M, Costil J. Radiation doses re-ceived by premature babies in the neonatal intensive care unit.J Radiol. 2005;86(2): 143–149
16. Holmedal LJ, Friberg EG, Børretzen I, Olerud H, Laegreid L, Rosendahl K. Radiation doses to children with shunt-treated hydrocepha-lus.Pediatr Radiol. 2007;37(12):1209 –1215 17. Horner MJ, Ries LAG, Krapcho M, et al, eds.
SEERCancer Statistics Review, 1975–2006. Bethesda, MD: National Cancer Institute; 2008. Available at: http://seer.cancer.gov/ csr/1975_2006. Accessed August 10, 2009
18. Thomas KE, Wang B. Age-specific effective doses for pediatric MSCT examinations at a large children’s hospital using DLP conver-sion coefficients: a simple estimation method.Pediatr Radiol. 2008;38(6):645– 656 19. International Commission on Radiological Protection, Task Group.Radiation Dose to Patients From Radiopharmaceuticals. Tar-rytown, NY: Elsevier Science; 1999 20. Gogos KA, Yakoumakis EN, Tsalafoutas IA,
Makri TK. Radiation dose considerations in
21. Kirks DR.Practical Pediatric Imaging. 3rd ed. Philadelphia, PA: Lippincott-Raven; 1998 22. Frush D, Slovis T. Medical radiation and chil-dren. Available at: http://spr.affiniscape. com/associations/5364/files/Effects of ra-diation in childrenUPDATE.pps. Accessed August 3, 2009
23. Fotakis M, Molyvda Athanasopoulou E, Psar-rakos K, Economou I. Radiation doses to paediatric patients up to 5 years of age un-dergoing micturating cystourethrography examinations and its dependence on pa-tient age: a Monte Carlo study.Br J Radiol. 2003;76(911):812– 817
24. Staton RJ, Williams JL, Arreola MM, Hinten-lang DE, Bolch WE. Organ and effective doses in infants undergoing upper gastrointesti-nal (UGI) fluoroscopic examination. Med Phys. 2007;34(2):703–710
25. US Food and Drug Administration. What are the radiation risks from CT? Available at: www.fda.gov/Radiation-EmittingProducts/ RadiationEmittingProductsandProceedures/ M e d i c a l I m a g i n g / M e d i c a l X - R a y s / ucm115329.htm. Accessed August 3, 2009
26. American College of Radiology Imaging Net-work. ACRIN protocol 6660: whole-body MRI in the evaluation of pediatric malignancies. Available at: www.acrin.org/TabID/184/ Default.aspx. Accessed August 3, 2009 27. Njeh CF, Samat SB, Nightingale A, McNeil EA,
Boivin CM. Radiation dose and in vitro pre-cision in paediatric bone mineral density measurement using dual X-ray absorptiom-etry.Br J Radiol. 1997;70(835):719 –727 28. Hart D, Jones DG, Wall BF.Coefficients for
Estimating Effective Doses From Pediatric X - R a y E x a m i n a t i o n s. D i d c o t , U n i t e d Kingdom: Chilton; 1996. National Radiologi-cal Protection Board report NRPB-R 279
29. Miksys N, Gordon C, Thomas K, Connolly B. Estimating effective dose to pediatric pa-tients undergoing interventional radiology procedures using anthropomorphic phan-toms and MOSFET dosimeters. AJRAm J Roentgenol. 2010;194(5):1315–1322 30. Brenner DJ, Doll R, Goodhead DT, et al.
Can-cer risks attributable to low doses of ioniz-ing radiation: assessioniz-ing what we really know. Proc Natl Acad Sci U S A. 2003; 100(24):13761–13766
31. Gelfand MJ. Dosimetry of FDG PET/CT and
39(suppl 1):S46 –S56
32. National Research Council of the National Academies, Committee to Assess Health Risks From Exposure to Low Levels of Ioniz-ing Radiation.Health Risks From Exposure to Low Levels of Ionizing Radiation: BEIR VII Phase 2. Washington, DC: National Acade-mies Press; 2006
33. Lee Chong A, Grant RM, Ahmed BA, Thomas KE, Connolly BL, Greenberg M. Imaging in pediatric patients: time to think again about surveillance.Pediatr Blood Cancer. 2010; 55(3):407– 413
34. Oeffinger KC, Mertens AC, Sklar CA, et al. Chronic health conditions in adult survivors of childhood cancer.N Engl J Med. 2006; 355(15):1572–1582
35. Bhatia S, Robison LL, Oberlin O, et al. Breast cancer and other second neoplasm after childhood Hodgkin’s disease.N Engl J Med. 1996;334(12):745–751
36. Lee CI, Haims AH, Monico EP, Brink JA, For-man HP. Diagnostic CT scans: assessment of patient, physician, and radiologist aware-ness of radiation dose and possible risks.
Radiology. 2004;231(2):393–398
37. Thomas K, Parnell-Parmley J, Haider S, et al. Assessment of radiation dose awareness among pediatricians.Pediatr Radiol. 2006; 36(8):823– 832
38. Goske MJ, Applegate KE, Boylan J, et al. The Image Gently campaign: working together to change practice.AJRAm J Roentgenol. 2008;190(2):273–274
39. Mettler FA Jr, Huda W, Yoshizumi T, Mahesh M. Effective doses in radiology and diagnos-tic nuclear medicine: a catalog.Radiology. 2008;248(1):254 –263
40. Donnelly LF. Reducing radiation dose asso-ciated with pediatric CT by decreasing un-necessary examinations.AJRAm J Roentge-nol. 2005;184(2):655– 657
41. Paterson A, Frush DP. Dose reduction in pe-diatric MDCT: general principles.Clin Ra-diol. 2007;62(6):507–517
DOI: 10.1542/peds.2009-2675 originally published online September 27, 2010;
2010;126;e851
Pediatrics
Gordon, Ronald Grant, Mark L. Greenberg and Karen E. Thomas
Bilal A. Ahmed, Bairbre L. Connolly, Puneet Shroff, Amy Lee Chong, Christopher
Patients
Cumulative Effective Doses From Radiologic Procedures for Pediatric Oncology
Services
Updated Information &
http://pediatrics.aappublications.org/content/126/4/e851
including high resolution figures, can be found at:
References
http://pediatrics.aappublications.org/content/126/4/e851#BIBL
This article cites 33 articles, 8 of which you can access for free at:
Subspecialty Collections
http://www.aappublications.org/cgi/collection/radiology_sub Radiology
following collection(s):
This article, along with others on similar topics, appears in the
Permissions & Licensing
http://www.aappublications.org/site/misc/Permissions.xhtml
in its entirety can be found online at:
Information about reproducing this article in parts (figures, tables) or
Reprints
http://www.aappublications.org/site/misc/reprints.xhtml
DOI: 10.1542/peds.2009-2675 originally published online September 27, 2010;
2010;126;e851
Pediatrics
Gordon, Ronald Grant, Mark L. Greenberg and Karen E. Thomas
Bilal A. Ahmed, Bairbre L. Connolly, Puneet Shroff, Amy Lee Chong, Christopher
http://pediatrics.aappublications.org/content/126/4/e851
located on the World Wide Web at:
The online version of this article, along with updated information and services, is
by the American Academy of Pediatrics. All rights reserved. Print ISSN: 1073-0397.