http://www.sciencepublishinggroup.com/j/ijnrem doi: 10.11648/j.ijnrem.20190406.12
ISSN: 2575-3088 (Print); ISSN: 2575-3061 (Online)
Analysis of Human Wildlife Conflict in Buffer Zone Area: A
Study from Chitwan National Park, Nepal
Pramod Ghimire
Faculty of Forestry, Agriculture and Forestry University, Hetauda, Nepal
Email address:
To cite this article:
Pramod Ghimire. Analysis of Human Wildlife Conflict in Buffer Zone Area: A Study from Chitwan National Park, Nepal. International Journal of Natural Resource Ecology and Management. Special Issue: Forest and Wildlife Management. Vol. 4, No. 6, 2019, pp. 164-172. doi: 10.11648/j.ijnrem.20190406.12
Received: September 7, 2019; Accepted: September 29, 2019; Published: October 9, 2019
Abstract:
Human-Wildlife Conflict (HWC) is fast becoming a serious threat to the survival of many endangered species in the world. The lack of access to forest resources for the local community residing in the buffer zones of national parks has created conflict between the national parks, the people residing in these areas and wildlife. This study focused on to analyze the situation of human-wildlife interface of people living near the park. Direst field observation, questionnaire survey of households (n=88), on-site focal group discussions, and key informant interviews were used for data collection. The study revealed that Paddy was the primary crop accounting about 34% of the economic value of total production. Peoples in the study area perceived that crop depredation was the major problem caused by the wild animals. Among crops, the damage to Paddy was high. A total average damage of Paddy per year per household (HH) was 115.2 Kg. Economic value of average annual damage per year per HH accounted for NRs, 9211.4. About 70% respondents responded that the poor availability of food in the forest was the main problem. In case of measures to control HWC, most of them have applied different local technologies. Among them participatory method, noise making and scare row construction were the common. Most of the local people believed that, cases of the HWC was increasing and will increase in the future. Hence, promotion of income generating activities, alternative energy, and improved livelihood strategies can reduce the HWC indirectly through decreasing the dependency in forest resources. Conservation awareness program and people participation are other major aspects that should be considered to mitigate the human wildlife conflict.Keywords: Buffer Zone, Conservation, Forest, Human-wildlife Conflict, Resources
1. Introduction
Human-Wildlife Conflict (HWC) is regarded as any interaction between humans and wildlife that results in negative impacts on social, economic or cultural life, on the conservation of wildlife populations, or on the environment [1]. Conflicts between people and wildlife have been widely recognized as one of the most challenging issues for wildlife conservation worldwide [2]. As the problems of increase in conflicts have been well known for many years which suggests that improved strategies are urgently needed to promote the co-existence of wild animals and people [3, 4]. Human-wildlife conflicts arise when they are compelled to share a common limited resource such as land, game, livestock or fish. The continuous increase in the human population results in competition between people and
wildlife for shared but limited resources, which manifest as various types of conflict, such as crop-raiding, livestock depredation, property damage, human injury and death, and the retaliatory killing of wildlife [5, 6].
rural livelihoods. In these regions, competition between local communities and wild animals, for the use of natural resources, is particularly intense and direct and resident human populations are very vulnerable [10].
The lack of financial opportunities and weak economy has forced communities within the Buffer zone to rely on the forest resources as a source of energy and income. This can threaten wild animals in two ways: by habitat fragmentation and by increasing the number of people entering the core area, thereby triggering wildlife poaching activities [11]. The most notable threats to the Chitwan National Park’s biodiversity are poverty and unemployment of local people living near the park. Among the large majority of the people that surround the park, there is a growing human population with no alternative sources of energy and employment opportunities that continues to encroach on park resources [12]. In Nepal, people are attacked by large mammal species such as elephants, tigers, rhinoceros, common leopards, bears and wild boars, but there is little discussion about the patterns of fatalities and injuries caused by wildlife or their underlying temporal dynamics [13]. Such information could provide essential guidance for establishing future conservation and research priorities in Nepal [14]. Many studies have been undertaken in different protected areas of Nepal on HWC. After success of the community forestry and buffer zone conservation program, additional habitat has been created beyond the protected area. However, in such secondary habitat human and wildlife conflict is high. Many studies have found that human and wildlife conflicts are more severe in such sub-optimal habitat [15]. Therefore, spatial and temporal data on crop damage, livestock depredation, human casualties and loss of wildlife resulting
from human wildlife conflict are necessary to address this problem and for the overall success of wildlife management. The current study aims to envisage the degree of HWC in the buffer zone of Chitwan National Park (CNP) and understand the perception of local communities residing in the vicinity of CNP. It suggests, further, to better wildlife conservation strategies through conflict mitigation.
2. Materials and Methods
2.1. Study Area
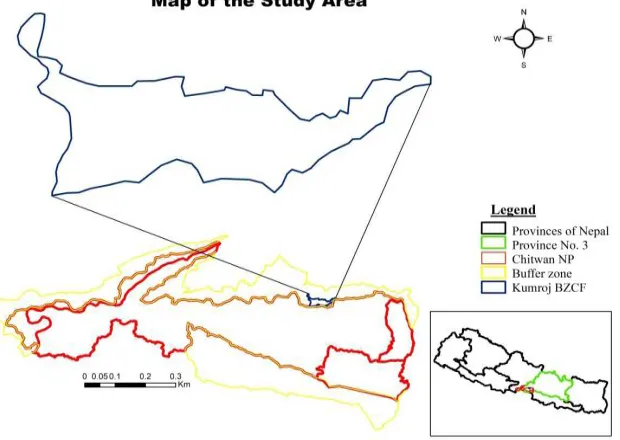
The study was carried out in Kumroj Buffer Zone Community Forest (KBZCF) of CNP which lies in Khairhani Municipality of Chitwan district in the Narayani zone of southern Nepal. The Kumroj community forest is situated in the south 7 km far from Tandi, East-West Highway, from Parsa 6 km, and from Sauraha 2 km in the East. It has spread with 7.5 km length from East to West and 3.5 km width from South to North and total area of this community forest is 697 hector [16].
Characterized by two main types of habitat i.e. tropical riverine forest and grass land, KBZCF is important habitats for wild animals and birds. In the community forest animal species including sambar, spotted deer, and barking deer, are found throughout the forest. The one-horned rhinoceros is commonly found and attracts many tourists to the community each year. Other mammalian species includes bengal tigers, leopards, sloth bears, small Indian civets, and wild boars. Additionally, wild elephants are occasionally seen in the forest. Various reptile and bird species are also been found [16].
Figure 1. Map of study area.
2.2. Sampling Design 2.2.1. Sample Size
The sample size (n) for the questionnaire survey was
Sample size (n) = Nz P(1 − P) Nd + z P(1 − P)
Where,
N = Total number of households
z = value of standard variant at 95% confidence level (1.96) P = estimated population proportion (0.05)
d = error limit of 5% (0.05)
Table 1. Total number of household’s and sampled households.
Village/Ward Total HHs Sampled HHs
Dharampur/4 104 43
Kumroj/5 116 45
Total 220 98
2.2.2. Social Survey
Both qualitative and quantitative approaches were used to inquiry for the study. Onsite field observation, questionnaire
households survey (n=88), key informant interview, and focal group discussions were used for data collection. These methods were applied to extract the information such as socio-economic condition, major conflicting animals, crop damage, livestock depredation, local techniques to mitigate the HWC, attitude of local people towards effectiveness of present techniques and local people’s ideas on HWC mitigation.
2.3. Data Analysis
Both qualitative and quantitative analysis methods were applied to analyze the data in this research. All the data collected were checked, refined and scrutinized as per the objectives. Data were analyzed using Microsoft Excel program and later exported to Statistical Package for Social Sciences (SPSS) for further analysis. The economic loss of crop per year per household was determined by the following method:
Average damage per year per HH (in Kg) =Total damage of crops of sampled HH
Number of sampled HH
Total damage of crops of sampled HH (in Kg) = Sum of total damage of crops of each sampled HH
Economic value of crops per year per HH (NRs) =Average damage per year per HH (Kg) × Local market value of each crops per kg
3. Results and Discussion
3.1. Results
3.1.1. Socio-economic Characteristics of Respondents
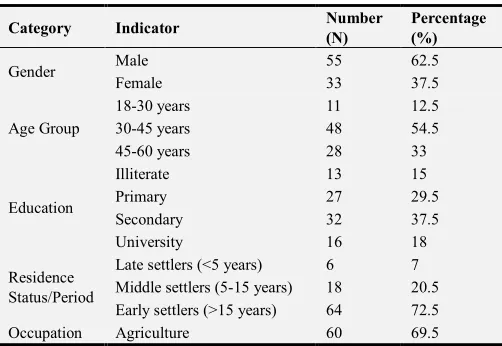
Of the 88 respondents questioned during the study, 55 were male and 33 were female. To avoid gender bias, the survey was based on the availability of the household members during the field study. However, the proportion of male to female respondents represented was still male-biased (62.5% males, 37.5% females). To generate reliable information, the household survey interview was performed with respondents between 18 to 60 years of age. This was done to reflect the respondent’s insight on the subject matter (Table 2).
Table 2. Socioeconomic characteristics of the respondents.
Category Indicator Number
(N)
Percentage (%)
Gender Male 55 62.5
Female 33 37.5
Age Group
18-30 years 11 12.5
30-45 years 48 54.5
45-60 years 28 33
Education
Illiterate 13 15
Primary 27 29.5
Secondary 32 37.5
University 16 18
Residence Status/Period
Late settlers (<5 years) 6 7
Middle settlers (5-15 years) 18 20.5
Early settlers (>15 years) 64 72.5
Occupation Agriculture 60 69.5
Category Indicator Number
(N)
Percentage (%)
Government Services 12 13.5
Business/Private Services 15 17
Annual Income/Yr (NPR)
<100,000 26 29.5
100,000-250,000 40 45.5
>250,000 22 25
About 30% of the respondents had a primary level education while 37.5% had a secondary level education and 18% had a university level education. The remaining were illiterate (Table 2). Agriculture is the main source of livelihood for the majority of the people in Nepal. In this study 69.5% of the HHs were dependent on agriculture related occupation, while 13.5% HHs were involved in government services and 17 were in business sectors (Table 2).
Table 3. The annual income of HHs based on land ownership.
HHs annual Income
Land holding of HHs
<0.4 ha >0.4 ha Total
N (%) N (%) N (%)
<100,000 16 (30.20%) 10 (28.60%) 26 (29.55)
100,000-250,000 23 (43.40%) 17 (48.60%) 40 (45.45)
> 250,000 14 (26.40%) 8 (22.80%) 22 (25%)
Total 53 (100%) 35 (100%) 88 (100%)
3.1.2. Crop Production
Nearly 70% of the total respondents depend primarily on agriculture as source of living. Paddy, maize, wheat, mustard and lentil were major crops and were grown once a year. The average yield of Paddy per HH per year was 485 Kg which was highest, than that of Maize, Wheat and of Mustard (Table 4). The average yield of these crops indicates that the land was highly fertile.
Table 4. Total crop production, annual average production and its economic value.
Major Crops Average production per year per
household (Kg)
Average annual income per HH (NRs)
Contribution of each crop in Monetary value (%)
Paddy 485 10,670 33.50
Maize 472.50 9,450 29.70
Wheat 200.40 6012 18.90
Mustard 43.80 3504 11.00
Lentil 24.20 2178 6.90
Total 31814 100.00
In terms of monetary value, Paddy accounted for about 33.50% of total economic yield. Among the others crops Maize and Wheat accounted for about 30% and 18% of the total economic yield respectively.
3.1.3. Livestock Production
Livestock rearing is an integral part of the Nepalese farming system. All of the households in the study area had the multiple livestock’s comprised by Cattle, Buffalo, Goat, Pig and Chickens/Ducks.
Figure 2. Average number of livestock per HH.
The average number of livestock per HHs was around 12. The average number of Goat and Cattles was highest along with Chickens and Buffalo (Figure 2).
3.1.4. Human-Wildlife Conflict i. Human-Wildlife Interface
Most of the respondents encountered with more than one wild animal including Rhinoceros, Wild Boar etc. More than
90% of the respondents encountered with the wild animals during night time. The respondents expressed their opinion that crop raiding was more destructive during night time because of the detection difficulty. Nearly 66% respondents mentioned that the wild animals visited the cropland and/or houses on daily basis. Respondents mentioned that the frequency and attempts of visit of wildlife was found high during the growing and harvesting period of crop.
ii. Major Crop Damaged by Wild Animals
About 70% of the total respondents were engaged in agriculture. The major crops grown were Paddy, Maize, Wheat, and Mustard. The damage per HH per year of Paddy was highest than of Maize, Wheat and Mustard. 37% of respondents responded in favor of Paddy as the major damaged crops. 19% and 28% of respondent selects Maize
and Wheat as next most damaged crops in the study area respectively (Figure 4). Mustard, Lentils, and vegetable crops were comparatively least damaged than other crops. The species that were responsible for crop damage differed significantly between the areas, but rhinos and wild boars were reported to cause the most damage in all areas.
Figure 4. Major crops damaged by wild animals.
iii. Economic Valuation of Crop Damaged
The damage of Paddy per HH per year was highest than of Maize, Wheat and Mustard. Average damage each HH per year of Paddy was 115.2 Kg and that of Wheat 68.30 Kg and Maize
55Kg. In terms of monetary value, Paddy damaged accounted for about 27.50% of total economic yield. Among the others crops Wheat and Mustard accounted for about 22.24% and 18.85% of the total economic yield respectively (Table 5).
Table 5. Economic loss of crops per year per HH.
Major crops Average damage per year
per HH (Kg)
Total damage per year (Kg)
Local Market value of each damaged crops per Kg (NRs)
Economic value of each damaged crops per year per HH (NRs)
Paddy 115.2 10, 173.6 22 2534.4
Maize 55 4,840 20 1100
Wheat 68.30 6,010.4 30 2049
Mustard 21.70 1,909.6 80 1736
Lentil 18.40 1,619.2 90 1656
Vegetable crops 3.4 2112 40 136
Total - - - 9211.4
iv. Livestock Depredation
More than 50% of the respondents respond to be affected by the livestock depredation. Those were the cases in which domesticated animals such as buffalos, cattle, goats, pigs and chickens/ducks were injured and killed by wild animals, such as the tiger (Panthera tigris), leopard (Panthera pardus), and jackal (Canis aureus).
Table 6. Livestock depredation in both villages in last one year.
Animals Village/ Wards Total
Kumroj/5 Dharampur/4
Buffalo 15 11 26
Cattle 14 9 23
Goat 21 13 34
Pig 7 4 11
Total 57 37 94
v. Human Casualties
Conflicts between people and wildlife have been widely
recognized as one of the most challenging issues for wildlife conservation worldwide. Though it is occasional in case but has a serious effect on the conservation due to the negative perception towards the wildlife conservation efforts. The number of injuries and human casualties in previous fiscal year 2018/19 are illustrated in the table 7 below: a total of 12 people died and 45 were injured due to the encounter with wild animals of which 3 were died and 5 were injured in the KBZCF area [16].
Table 7. Human casualties in fiscal year 2018/19 in CNP.
Wild animals Types of casualties
Injured Death
Elephant 4 6
Rhinoceros 18 2
Tiger 1 3
Beer 8 -
Leopard 3 -
Wild Boar 7 -
Mugger Crocodile 4 1
vi. Comparison of Nature of Conflicts
The intensity of crop damages is greater in the study area. Form the study it was reported that about 62.5% of the respondents had crop damages only. 23.86% of the respondent faced the property damages only while 9.10% of the respondents had both the property and crops damages. 4.54% of respondent had experienced crops damages, property damages as well as human casualties (Figure 5).
Figure 5. Comparison of nature of conflicts.
3.1.5. Reasons for Wild Animals Comes to the Cropland
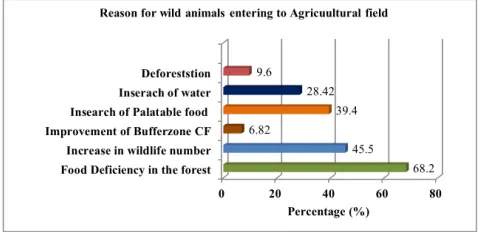
Most of respondents (about 70%) agreed that food deficiency to the wild animals in their habitat was prime cause for the wild animals to visit the crop land (Figure 6). This statement is supported by the fact that, the nearby forest was degrading in recent year than previous year. Increase in the number of wild animals, search for palatable food and search for water were other major causes to support. Deforestation and forests fire were minor factors as reported by the respondents.
Figure 6. Reasons for wild animals coming to cropland.
3.1.6. Measures Undertaken to Control HWC
Various traditional methods were exercised by local people to keep away the wildlife from the people settlement areas. Most of the people adopted one or more measures to cope with HWC. One common feature observed in the agricultural field was scare row construction. Other methods included were community level protection, use of noise making tools such as drum or tin boxes, and chasing with fire and shouting. During certain period of high crop vulnerability, farm HH members would take the turns to guard the field crops at night.
Figure 7. Measures undertaken to control HWC.
3.1.7. Effectiveness of Existing Measures in Controlling HWC
Despite the widespread application of measures namely community protection, noise making, guarding at night, scare row construction, and following with fire and shouting, they were not considered to be effective in mitigating HWC by the local people in long run. But the effectiveness of all these methods is good during initial application as wild animals were unaware of new methods in the field. But after certain time of application, they were common to escape such methods. Most of the respondent reported that the effectiveness of current existing measures were good (Figure 8).
Figure 8. Effectiveness of current existing measures to control HWC.
3.1.8. Human-Wildlife Conflict Resolution
During the study about 53% of the respondents believed that extent of HWC were increasing. More than 65% of the respondents believed that fencing around the park and forest area around the village could be an effective method to cope with this HWC. As suggested by the local people fencing should be done by the government body. Positive responses were reported in the queries related to the necessity of conservation of wildlife. 85.22% of the respondents were in behalf of conservation despite of the wildlife attack. Fencing around the national park, livelihood improvement training to local people, employment opportunities for local people, local development activities were major expectations of local people from park authority. Security assurance of Human and Crops was another expectation from park authority.
3.2. Discussion
challenging one. As humans and wildlife increasingly find themselves competing for space, a continual struggle for resources leads to HWC. While agriculture production is the main occupation of the local people living in vicinity to the park, the damage done by the wild animals of major crops was high within the study area. Paddy being the most affected crop. The highest damage of the Paddy was because; it is most produced, more palatable and portentous than any other crops grown in the study area. In Jhapa, Bardia, and Shuklaphanta major crop i.e. paddy was highly damaged by the wild animals and accounted nearly 70% of total economic loss [8]. The average economic loss faced by each household was of NRs. 9211.4 per year in study site in Chitwan and NRs 10,108 per year in Bardia [8]. A study conducted in Gaurishankar Conservation Area of Nepal reported that maximum damage maize (39%) and potato (30%) crops were damaged due to wildlife and major wildlife pests being monkey, porcupine, ghoral, jackal and Himalayan black bear [19]. Household living closer to park boundaries tend to suffer higher incidences and costs of crop losses as compared to people living further from park boundaries [20]. Studies have found that crop raiding often occurs at the peak availability of crops especially during crop harvesting seasons [21].
Livestock rearing is another major option for income in the study area. Open asses to the forest area, availability of the forest products also offers a great opportunity for livestock rearing. Because of these cases, human footprint on forest was increasing at high rate that disturbs the natural habitat of the wild animals. Such situation forces the movement of the wild animals to the agricultural field. The major problem having crop damage was the rhino and wild Boar. The damage by rhino is due to its food preference to agricultural crops and wild boar is probably the most widespread because this species is found in almost all forested habitats including highly degraded and fragmented one [22].
This causes the conflict among human and wildlife and probably will increase in future.
A study conducted in Kanchenjunga Conservation Area of Nepal reported that livestock depredation in Ghunsa valley, Lelep village development Committee of Taplejung district was increasing with an annual average loss rate of 11% in ten years (2005- 2014) [23]. WWF [8] also reported the extent of economic loss due to crop damage by elephants and rhinos were indicating that transformation of elephant habitats to other uses (settlement, agriculture etc.) is highly likely to result in the increased economic losses from crop damage in eastern and western terai of Nepal. This shows HWC is becoming one of the major environmental challenges in Nepal and its appropriate solution is urgently necessary.
Conflict between people and wildlife has been widely recognized as one of the most challenging issues for wildlife conservation. Common resources for the human and wildlife can create pressure on the agricultural land near the park area by which can create the HWC. No any case of illegal hunting and poaching was reported in the study area. But the number of cases of human-rhino, human-tiger, wild boar, and leopard
conflict was increasing. This may be due to loss of forest area and decrease of their food and/or prey species in their habitat. Open grazing of large livestock in the forest area reduces the quality and quantity of forests; this also influences the conflict in that area.
From the park report the number of human casualties in previous fiscal year 2018/19 is 57 (12 death and 45 injury) due to the encounter with wild animals of which 3 were died and 5 were injured in the KBZCF area [16]. In the last fiscal year 2018/19, Department of National Parks and Wildlife Conservation (DNPWC) suggest that a total of 30 people were died and 118 people were injured by wild animals attack around the 20 protected areas of the country (Figure 9). Comparing with the result of whole 20 protected areas of the country CNP is severely affected by the problem of people and wildlife conflict [24].
Figure 9. Total number of human casualty in Nepal’s protected areas in fiscal year 2018/19.
A study from 2010 to 2014 in Nepal also shows that Asiatic elephants and common leopards are most commonly involved wildlife in attacks on people in terms of attack frequency and fatalities [15]. Similarly, a study from South India reported that crop damage was the most common type of conflict, followed by property damage, injury and death by wildlife attack. Crop damage was contributed mainly by elephant (Elephas maximus) (59%) and wild boar (Sus scrofa) (32%) in South India [25].
application of the other scientific techniques. Application of such techniques to the mass population of the wild animals reduces the effectiveness of the techniques. But application of local technology in combination with new self-sustaining techniques had the good effectiveness. In Namibia the major methods used to reduce the human wildlife conflict were electric fences, protection of water points, chilli pepper fences, alternative water points for elephants, elephant trip alarms and improved livestock husbandry. This also showed that one technique alone will not be sufficient a package of different techniques should be designed that is specifically tailored to meet the needs of the local situation [27].
The degree and extent of human-wildlife conflict was determined by the multiple factors influenced by human and wildlife population. Co-existence of both the factors will lead to the stable state of HWC. Most of the local people believed that, cases of the HWC was increasing and will increase in the future. Hence, sustainable management of protected areas and understanding people’s beliefs and attitudes toward protected areas is a key factor in developing successful management plans to conserve those areas over the long-term [28, 29]. 85.22% of the people are positive towards the wildlife conservation despite severe wildlife attack. Respondents responded that the park authority were less serious towards the implementation of long term conflict resolution strategies. Addressing the root causes of the conflict will be helpful to reduce the conflict. As suggested by the local people application of electric wire fencing around the park, improvement in the present techniques, review of damage relief fund scheme and establishment of community based conflict reduction team were the major direct conflict reducing techniques. While in indirect way, decreasing the forest dependency, forest pressure and addressing the conservation education and local development will help full to reduce the problem. Hill [30] reported that the people develop negative attitude towards wildlife when damages by wildlife exceeds the level of tolerance. Negative attitude would be the big challenges for conservation despite of heavy conservation efforts when human casualties exceed and conservation benefits to the local people were diminished. Thus, it is important to employ appropriate strategies and measures to deal with these losses and compensation measure is often considered an important tool to mitigate HWC [31].
4. Conclusions
The incident of Human-Wildlife conflict is increasing in recent year. Crop damage was the major problem faced by the local people. Contribution of Paddy in total damage was high than the others. Conflict between the human and herbivore wild animal was high and crop damage was high in study area. Only few cases of the human casualties were reported. Rhinos, wild boar, tiger, common leopard were major threatening animals. Most of the techniques to reduce the HWC were manual and human based. The major techniques applied were participatory community level
protection, noise making, guarding at night at cropland, and scare row construction. The effectiveness of these techniques is varied and different for different wild animals. The effectiveness of noise making by people and by using tools was higher than the other techniques applied.
Despite the increasing incidents of conflict, people were positive about the conservation of wild animals. This can be accredited to the awareness among local people about the value of wild animals. As suggested by the local people application of electric wire fencing around the park, improvement in the present techniques, review of damage relief fund scheme and establishment of community based conflict reduction team were the major direct conflict reducing techniques. However, in indirect way decreasing the forest resource dependency, and addressing the conservation education and local development will help full to reduce the problem.
Acknowledgements
The author is grateful to local people of Kumroj and Dharampur for providing information during questionnaire survey. Sincere thanks goes to Faculty of Forestry, Agriculture and Forestry University, Hetauda, Nepal for providing financial support and to the park authorities for technical assistance.
Conflicts of Interest
The author declares that there is no competing of interest.
References
[1] WWF. (2006). “FACTSHEET: Human-animal conflict”, World Wildlife Fund, Switzerland.
[2] Dowie, M. (2011). Conservation refugees: the hundred-year conflict between global conservation and native Peoples. MIT Press.
[3] Woodroffe, R., Thirgood S., and Rabinowitz, A. (2005). The future of coexistence: resolving human-wildlife conflicts in a changing world. Conserv Biol Ser Camb.
[4] Dickman, A. J., Macdonald, E. A., and Macdonald, D. W. (2011). A review of financial instruments to pay for predator conservation and encourage human-carnivore coexistence. Proc Natl Acad Sci U. S. A.; 108: 13937–13944. pmid: 21873181.
[5] Peterson, M, N., Birckhead, J. L., Leong, K., Peterson, M. J., and Peterson, T. R. (2010). Rearticulating the myth of human-wildlife conflict. Conserv Lett; 3: 74–82.
[6] White, P. C., and Ward, A. I. (2011). Interdisciplinary approaches for the management of existing and emerging human–wildlife conflicts. Wildl Res; 37: 623–629.
[8] WWF. (2007). “A Case Study on Human-Wildlife Conflict in Nepal (With particular reference to Human-Elephant Conflict in Eastern and Western Terai regions)”, World Wildlife Fund, Kathmandu, Nepal: pp 47-48.
[9] Shrestha, D. B., and Paudyal, A. (2007). “When Mega Vertebrates Makes Ranch their home” Envirostation, Contemporary Issues, e-facts Vol 1 (3) August 2007,
Kathmandu, Nepal. Retrieved from:
www.envirostation.com.np
[10] Distefano, E. (2010): “Human-Wildlife Conflict worldwide: collection of case studies, analysis of management strategies and good practices”. Retrieved from: www.fao.org/sard/common/ecg/1357/en/hwc_final.pdf on 4 May 2019.
[11] Lamsal, S. (2008). “Socio-economic status, Vegetation analysis, Rhino conservation and land use change in Amarapuri Buffer Zone VDC of Chitwan National Park, Nepal’’.
[12] KMTNC, (1996). King Mahendra Trust for Nature Conservation, Annual report 1995/1996.
[13] Woodroffe, R. (2000). Predators and people: using human densities to interpret declines of large carnivores. Anim Conserv; 3: 165–173.
[14] Primack, R. B., Paudel, P. K., and Bhattarai, B. P. (2013). Conservation biology: A primer for Nepal. 1 ed.. Kathmandu, Nepal: Dreamland Publication.
[15] Acharya, K. P., Paudel, P. K., Neupane, P. R., and Köhl, M. (2016). Human-Wildlife Conflicts in Nepal: Patterns of Human Fatalities and Injuries Caused by Large Mammals.
PLoS ONE 11 (9): e0161717.
https://doi.org/10.1371/journal.pone.0161717
[16] CNP. (2019). Chitwan National Park (CN)P) Kasara, Chitwan. Annual Report Fiscal year 2018/2019. Department of National Park and Wildlife Conservation (DNPWC). Ministry of Forest and Environment, Government of Nepal. Kathmandu, Nepal. [17] Arkin, H., and Colton, R. R. (1963). Tables for Statisticians
(2nd ed.), Barnes and Noble, Incorporated, New York, 55 p. [18] Sharma, A. (2000). Wildlife Corridor Management: Analysis
of Biodiversity and Socioeconomics in the Buffer Zone of the Royal Chitwan National Park, Nepal. M.Sc. dissertation, Asian Institute of Technology, Thailand.
[19] Awasthi, B., and Singh, N. B. (2015). Status of Human wildlife conflict and Assessment of Crop damage by Wildl animals in Gaurishankar Conservation Area, Nepal. Journal of Institute of Science and Technology, 20 (I): 107-111.
[20] Mackenzie, C. A., and Ahabyona, P. (2012). Elephants in the garden: Financial and social costs of crop raiding Ecological Economics, 75: 72–82.
[21] Warren, Y., Buba, B., and Ross, C. (2007). Patterns of crop-raiding by wild and domestic animals near Gashaka Gumti National Park, Nigeria. International Journal of Pest Management, 53.
[22] Sukumar, R. (1994): “Wildlife-human conflict in India: an ecological and social perspective”. In: Guha, R. (ed.) Social Ecology, Oxford University Press, New Delhi: pp. 303-317. [23] Sherchan, R., and Bhandari, A. (2017). Status and trends of
human-wildlife conflict: A case study of Lelep and Yamphudin region, Kanchenjunga Conservation Area, Taplejung, Nepal. Conservation Science (Conerv. Sci.), 5: 19-25.
[24] DNPWC. (2019). Department of National Park and Wildlife Conservation (DNPWC). Annual Report Fiscal year 2018/2019. Ministry of Forest and Environment, Government of Nepal. Kathmandu, Nepal.
[25] Rohini, C. K., Aravindan, T., Das, K. S. A., and Vinayan, P. A. (2016). Patterns of Human-Wildlife Conflict and People’s Perception towards Compensation Program in Nilambur, Southern Western Ghats, India. Conservation Science (Conerv. Sci.), 4: 1-6.
[26] WWF. (2005). “Human wildlife conflict manual 2005: Wildlife management series”, WWF-World Wide Fund for Nature Southern African Regional Program Office (SARPO). [27] WWF. (2008). “Common Ground-Solutions for reducing the
human, economic and conservation costs of human wildlife conflict” World Wildlife Fund-International, Species Program: pp 27.
[28] Shrestha, R. K., and Alavalapati, J. R. R. (2007). “Linking Conservation and Development: An Analysis of Local People’s Attitude Towards Koshi Tappu Wildlife Reserve, Nepal” J. Environment, Development and Sustainability, Volume 8, Issue 1, Pp 69-84.
[29] Allendorf, T. D. (2007). “Residents’ attitudes toward three protected areas in southwestern Nepal” J. Biodiversity and Conservation (2007) 16: 2087–2102, Springer Netherlands. [30] Hill, C. M. (1997). Crop-raiding by wild vertebrates: the
farmer’s perspective in an agricultural community in western Uganda. International Journal of Pest Management, 43. [31] Kumssa, T., and Bekele, A. (2013). Human wildlife conflict in