Growth of Preterm Infants Fed Nutrient-Enriched or Term
Formula After Hospital Discharge
Jane D. Carver, PhD, MS*; Paul Y. K. Wu, MD‡; Robert T. Hall, MD§; Ekhard E. Ziegler, MD
储
;
Roberto Sosa, MD¶; Joan Jacobs, MS#; Geraldine Baggs, MS#; Nancy Auestad, PhD#;
and Beate Lloyd, PhD#
ABSTRACT. Objective. At hospital discharge, pre-term infants may have low body stores of nutrients, deficient bone mineralization, and an accumulated en-ergy deficit. This double-blind, randomized study eval-uated the growth of premature infants with birth weights
<1800 g who were fed a 22 kcal/fl oz nutrient-enriched postdischarge formula (PDF) or a 20 kcal/fl oz term-infant formula (TF) from hospital discharge to 12 months’ corrected age (CA).
Methods. Infants were randomized to PDF or TF a few days before hospital discharge with stratification by gender and birth weight (<1250 g or>1250 g). The for-mulas were fed to 12 months’ CA. Growth was evaluated using analysis of variance controlling for site, feeding, gender, and birth weight group. Interaction effects were also assessed. Secondary analyses included a repeated measures analysis and growth modeling.
Results. One hundred twenty-five infants were ran-domized; 74 completed to 6 months’ CA and 53 to 12 months’ CA. PDF-fed infants weighed more than TF-fed infants at 1 and 2 months’ CA, gained more weight from study day 1 to 1 and 2 months’ CA, and were longer at 3 months’ CA. There were significant interactions between feeding and birth weight group—among infants with birth weights<1250 g, those fed PDF weighed more at 6 months’ CA, were longer at 6 months’ CA, had larger head circumferences at term 1, 3, 6, and 12 months’ CA, and gained more in head circumference from study day 1 to term and to 1 month CA. The repeated measures and growth modeling analyses confirmed the analysis of variance results. The PDF formula seemed to be of par-ticular benefit for the growth of male infants. Infants fed the PDF consumed less formula and had higher protein intakes at several time points. Energy intakes, however, were not different.
Conclusions. Growth was improved in preterm in-fants fed a nutrient-enriched postdischarge formula after hospital discharge to 12 months’ CA. Beneficial effects were most evident among infants with birth weights <1250 g, particularly for head circumference
measurements. Pediatrics 2001;107:683– 689; nutrition, preterm, low birth weight, growth.
ABBREVIATIONS. VLBW, very low birth weight; CA, corrected age; PDF, postdischarge formula; TF, term formula.
A
lthough adequate nutrition is critical in the
management of small preterm infants, no
feeding standard exists that is comparable to
the breast milk standard for term infants. Present
recommendations are designed to provide nutrients
to approximate the rate of growth and composition
of weight gain for a normal fetus of the same
postconceptional age without inducing metabolic
stress.
1However, many preterm infants who retain
nutrients at these levels remain growth retarded
rel-ative to a fetus or newborn of comparable
postcon-ceptional age. The delay in catch-up growth is
attrib-utable in part to the slow initial growth during
hospital stay and to the initial postnatal weight loss,
which may be at least 10% of body weight
2and
which may not be regained for 2 weeks or more in
infants with very low birth weights (VLBW).
2,3Typical hospital discharge weights for preterm
in-fants in the United States are 1800 to 2000 g. At
discharge, preterm infants may have low body stores
of nutrients,
4deficient bone mineralization,
5and an
accumulated energy deficit of 3780 to 5460 kJ.
2At 40
weeks’ postmenstrual age, preterm infants are
gen-erally smaller than term infants, and they are
pro-jected to have higher nutrient requirements. They
may remain growth retarded for several years,
6 –11have higher rates of childhood morbidity and
mor-tality,
9,12have undermineralized bones,
13have
fail-ure to thrive,
14and often experience delays in
neu-rodevelopment
15–17that can persist to school
age.
18 –19Aggressive nutritional management during
hospi-talization promotes earlier onset of and more rapid
rates of postnatal growth of preterm infants,
16,20,21which may be associated with later developmental
advantages.
19,22,23Studies by Kashyap et al
24 –26have
demonstrated that hospitalized preterm infants can
effectively use, without metabolic stress, higher
con-centrations of protein and energy than are typically
fed. Less is known about the nutritional needs of the
postdischarge preterm infant relative to the term
infant. Preterm infants may be discharged from the
hospital on breast milk, formula designed for term
From the *University of South Florida College of Medicine, Department of Pediatrics, Division of Neonatology, Tampa, Florida; ‡Los Angeles County and University of Southern California School of Medicine, Division of Neonatal-Perinatal Medicine, Los Angeles, California; §Children’s Mercy Hospital, Kansas City, Missouri;储University of Iowa Hospitals and Clinics, Iowa City, Iowa; ¶All Children’s Hospital, St Petersburg, Florida; and #Ross Products Division, Abbott Laboratories, Columbus, Ohio.
Received for publication Mar 24, 2000; accepted Sept 7, 2000.
Reprint requests to (J.C.) University of South Florida College of Medicine, Department of Pediatrics, Division of Neonatology, 17 Davis Blvd, Suite 200, Tampa, FL 33606. E-mail: jcarver@med.usf.edu
infants, or postdischarge formula designed for
pre-term infants. The potential benefit of postdischarge
formulas is being increasingly recognized.
1Im-proved growth
27–29and bone mineralization
5,30have
been reported in preterm infants fed
nutrient-en-riched formulas after hospital discharge.
The purpose of the present study was to determine
if feeding a nutrient-enriched formula designed for
the nutritional needs of preterm infants after hospital
discharge would result in improved growth
com-pared with infants fed a standard formula designed
for term infants.
METHODS AND MATERIALS Study Design
A controlled, double-blind, randomized, parallel study was designed to evaluate the growth of premature infants fed 1 of 2 different formulas from hospital discharge to 12 months’ corrected age (CA). Infants were randomized to 22 kcal/fl oz postdischarge formula (PDF) or 20 kcal/fl oz term formula (TF) 2 to 4 days before hospital discharge, at which time body weight was expected to be 1800 to 2300 g. The first day of study formula feeding was desig-nated as study day 1. Infants were measured at study visits that corresponded to term (40 weeks after last menstrual period), and to 1, 2, 3, 6, 9, and 12 months’ CA. Blood samples were obtained at term, 3 months’, and 9 months’ CA. Dietary intakes and mea-sures of formula tolerance were recorded for 3 days before each study visit in booklets provided to parents.
This protocol was approved by the Institutional Review Board for the Protection of Human Subjects at each institution.
Participants
Preterm infants were recruited from hospitals in 6 cities (Los Angeles, CA, Tampa, FL, St Petersburg, FL, Kansas City, MO, Iowa City, IA and Ft Lauderdale, FL). Inclusion criteria included birth weightⱕ1800 g, gestational age⬍37 weeks, and previous parental decision not to provide breast milk for their infant. In-fants with severe bronchopulmonary dysplasia, cardiac, respira-tory, gastrointestinal, or other systemic diseases were excluded. At the time study feedings were initiated, infant weights were 1635 to 2715 g (PDF), and 1640 to 2800 g (TF), and their postnatal ages were ⬎1 week. There were no restrictions on the type of feeding before study entry. Parental informed consent was ob-tained before infants entered the study.
The randomization schedule, prepared by the Biostatistics De-partment of Ross Products Division, was stratified for gender and birth weight group (⬍1250 g,ⱖ1250 g). Participants who did not complete the study were not replaced.
Study Feedings
Study formulas were the 22 kcal/fl oz nutrient-enriched PDF or a commercially available 20 kcal/fl oz TF. Both formulas were provided by Ross Products Division, Abbott Laboratories, Colum-bus, Ohio. The PDF provided higher quantities of protein, most minerals, and vitamins per 100 kcal than TF (Table 1). The ratio of whey to casein proteins in PDF was 50:50, and the fat blend consisted of 45% soy oil, 30% coconut oil, and 25% medium-chain triglyceride oil. The TF had a whey to casein ratio of 20:80, and its fat blend consisted of 60% soy oil and 40% coconut oil. Clinically labeled ready-to-feed formulas were provided in 4-fl oz bottles for inhospital use and in 32-fl oz cans for use after hospital discharge. At the time of hospital discharge, parents were given a supply of formula and were instructed to feed only the study formula to 4 months’ CA. From 4 to 12 months’ CA, infants continued to receive the assigned formula, and parents were instructed to con-form to the American Academy of Pediatrics recommendations regarding the inclusion of other foods.1Clinic visits were sched-uled to correspond to term, and to 1, 2, 3, 6, 9, and 12 months’ CA. At each clinic visit, infants were weighed nude and head cir-cumference and length were measured. Each site was requested to have the same examiners obtain anthropometric measurements at each visit; measurements were made in duplicate. Measurements that did not meet these criteria were not included in the analyses.
All centers were provided with O’Leary recumbent length boards (Ellard Instrumentation, Inc, Seattle, WA), head circumference measuring tapes (Similac Inser-Tape, Associated Visual Commu-nications, Canton, OH) and weights for calibrating scales.
Blood Sampling and Analyses
At the term, 3, and 9 months’ CA visits, blood samples (⬃1 mL) were obtained using the Tenderfoot Premie heel incision device (International Technidyne Corp, Edison, NJ) or from a peripheral vein by venipuncture. Only nonhemolyzed samples were ana-lyzed. Hemoglobin concentrations in blood obtained by heel inci-sion were determined using the HemoCue AB (HemoCue, Inc, Mission Viejo, CA) while those obtained by venipuncture were determined using a Coulter STKS Automated CBC Spectropho-tometer analyzer or a Model M430 Coulter Counter (Coulter Elec-tronics, Hialeah, FL). Remaining blood was centrifuged and serum was transferred to polypropylene tubes and frozen. The samples were shipped on dry ice to Ross Products Division where serum levels of albumin, prealbumin, and retinol-binding protein were determined using the Behring Nephelometer 100 (Hoechst-AG, Frankfurt, Germany) and serum urea nitrogen was determined
TABLE 1. Content of Selected Nutrients in the PDF and TF per 100 kcal
Nutrient PDF TF
Protein, g 2.6 2.1
Fat, g 5.5 5.4
Carbohydrate, g 10.3 10.7 Linoleic acid, mg 750 1300
Vitamin A, IU 460 300
Vitamin D, IU 80 60
Vitamin E, IU 3.6 3.0
Vitamin K,g 11 8
Calcium, mg 105 73
Phosphorus, mg 62 56
Ca:P ratio 1.7 1.3
Magnesium, mg 9 6
Iron, mg 1.8 1.8
Zinc, mg 1.2 0.75
Manganese,g 10 5
Copper,g 120 90
Osmolarity, mosm/L 224 270 Renal solute load, mosm 17.9 14.3
TABLE 2. Demographic Data and Reasons for Early Exit for Infants Fed PDF or TF After Hospital Discharge
PDF TF
Sample size,n* 67 56
Birth weight, g 1292⫾46† 1249⫾49 Birth length, cm 38.8⫾0.5 38.6⫾0.6 Head circumference, cm 27.0⫾0.3 26.8⫾0.3 Gestational age, wk 30.0⫾0.4 30.0⫾0.4 Ethnicity,n
White 26 18
Black 11 12
Hispanic 29 23
Other 1 3
Gender,n(%)
Males 30 (45) 23 (41)
Early exit 31 26
Vomiting, constipation, or diarrhea
9 8
Study noncompliance 9 4
Illness or death unrelated to study feedings
10 6
Family moved 0 4
Other 3 4
* The sample size shown does not include 1 infant who never received study formula and another who was diagnosed with a genetic disorder.
using the Abbott Spectrum EPX Clinical Chemistry analyzer (Ab-bot Laboratories, Irving, TX).
Statistical Methods
Growth data were analyzed at each time point using a 3-way analysis of variance controlling for site, feeding group, gender, birth weight group, and interactions between feeding group and gender, feeding group and birth weight group, gender and birth weight group, and feeding, gender, and birth weight group. When significant interactions were found (P⬍.05), least squares means adjusted for the other variables in the model were used for com-parisons between feeding groups. Bonferroni adjustments to P
values were made for multiple comparisons. A posthoc analysis that included age at each study visit was also done at each time point. Longitudinal analysis of the growth data were also done using a mixed model repeated measures analysis controlling for site, birth weight group, feeding group, gender, and visit (PROC MIXED, SAS v6.09 Enhanced, Cary, NC). A growth modeling approach was applied to control for variability in the timing of clinic visits and for missed visits. A 3-parameter Gompertz31 model was used to fit a curve for each subject, using all available data (PROC NLIN, SAS v6.09 Enhanced, Cary, NC). Values for the exact, protocol-specified anthropometric values were estimated from the individual curves and analyzed using the same mixed model repeated measures analysis as described above.
Formula intake data (volume, protein, and energy per kg body weight per day) were analyzed at each time point using 3-way analysis of variance controlling for site, birth weight group,
gen-der, and interactions as described for growth. Blood biochemis-tries were analyzed at each time point using 1-way analysis of variance controlling for site.
In general, continuous data were evaluated using analysis of variance and categorical data using2tests of association or exact tests. The null hypothesis was that growth of infants fed nutrient-enriched formula would be no greater than that of infants fed control formula. Hypothesis tests for growth were 1-sided with
␣⬍0.05 considered statistically significant. All other hypothesis tests were 2-sided 0.05 level tests.
RESULTS
One hundred twenty-five infants were
random-ized; 1 participant who was randomized never
re-ceived study formula and 1 was not included in the
analyses because of the diagnosis of a genetic
disor-der before hospital discharge. Birth anthropometrics,
gestational age, percentage of infants with
intrauter-ine growth restriction, ethnicity, gender
distribu-tions, and reasons for early exit from the study did
not differ between infants fed PDF and those fed TF
(Table 2). The postnatal ages of infants at study day
1, term, 1, 2, 3, 6, 9 and 12 months’ CA were 41
⫾
3,
70
⫾
3, 103
⫾
3, 132
⫾
4, 164
⫾
4, 247
⫾
4, 329
⫾
4,
438
⫾
5 days (PDF) and 43
⫾
4, 68
⫾
3, 99
⫾
3, 131
⫾
TABLE 3. Weight (g), Length (cm), and Head Circumference (cm) Measurements From Study Day 1 to 12 Months’ CA*
PDF TF PDF Versus TF†
PValues Main
Effects
Interaction Effects Study day 1
Weight 2068⫾40 (54) 2083⫾41 (46) .38 —
Length 44.3⫾0.4 (45) 43.9⫾0.4 (41) .14 —
Head circumference 31.5⫾0.2 (50) 31.8⫾0.2 (44) .11 — Term
Weight 3053⫾68 (54) 2867⫾67 (48) — .041
Length 48.0⫾0.3 (55) 47.3⫾0.3 (47) .06 —
Head circumference 34.7⫾0.2 (55) 34.4⫾0.2 (48) — .032 1 Mo
Weight 4092⫾97 (51) 3825⫾94 (44) .02 —
Length 52.3⫾0.4 (51) 51.6⫾0.4 (44) .10 —
Head circumference 37.1⫾0.2 (51) 36.7⫾0.2 (44) — .032 2 Mo
Weight 4968⫾112 (41) 4724⫾106 (40) .05 —
Length 55.8⫾0.4 (41) 55.1⫾0.3 (41) .06 —
Head circumference 38.6⫾0.2 (40) 38.7⫾0.2 (41) .40 — 3 Mo
Weight 5779⫾131 (43) 5518⫾124 (41) .06 —
Length 59.2⫾0.5 (43) 58.1⫾0.5 (41) .04 —
Head circumference 40.2⫾0.2 (42) 40.0⫾0.2 (41) — .042 6 Mo
Weight 7451⫾176 (39) 6993⫾177 (35) — .012
Length 65.5⫾0.5 (39) 63.9⫾0.5 (35) — .012
Head circumference 43.0⫾0.3 (37) 42.5⫾0.3 (35) — ⬍.012 9 Mo
Weight 8409⫾214 (39) 8111⫾229 (32) .14 —
Length 69.9⫾0.5 (38) 68.9⫾0.6 (31) .08 —
Head circumference 44.6⫾0.3 (37) 44.0⫾0.3 (31) .07 — 12 Mo
Weight 9356⫾270 (26) 8846⫾269 (27) — .043
Length 74.6⫾0.7 (27) 73.5⫾0.7 (27) .10 —
Head circumference 45.7⫾0.3 (27) 45.4⫾0.3 (27) — .012 * Data are reported as least square means⫾standard error of mean adjusted for site, gender and birth weight group and analyzed by analysis of variance controlling for site, feeding group, gender, and birth weight group.
†Pvalues are 1-sided for main effects and 2-sided for interactions.Pvalues with superscripts are for interactions as indicated: 1Feeding by gender by birth weight group interaction: among male infants with birth weightⱖ1250 g; PDF⬎TF,P⫽.03. 2Feeding by birth weight group interaction: among infants with birth weight⬍1250 g; PDF⬎TF,P⬍.05.
3, 161
⫾
4, 240
⫾
3, 330
⫾
4, 437
⫾
5 days (TF)
(mean
⫾
standard error of mean). The postnatal ages
were not different, except at the 6 months’ CA visit
(
P
⫽
.04). However, including postnatal age at the
study visits as an additional covariate in the analysis
of variances did not significantly affect the results.
Sample size varied at individual timepoints because
of dropouts and missed clinic appointments.
Anthropometric measurements at study day 1 did
not differ between infants fed PDF or TF. The
PDF-fed infants had greater weight, length, head
circum-ferences, and gains in these measures at several of
the subsequent visits (Tables 3 and 4), with
confir-matory longitudinal analyses using repeated
mea-sures and growth modeling.
PDF-fed infants weighed significantly more at 1
and 2 months’ CA, and gained more weight (g/d)
from study day 1 to each of these visits. There were
significant interactions between feeding and birth
weight group; among infants with birth weights
⬍1250 g, PDF-fed infants weighed more than TF-fed
infants at 6 months’ CA, and they gained more
weight from study day 1 to 12 months’ CA. There
were also significant interactions between feeding,
birth weight group, and gender; among male infants
with birth weights
⬍
1250 g, those fed PDF weighed
more at 12 months’ CA than those fed TF. From
study day 1 to term, there was a significant feeding
by gender interaction; among male infants, those fed
PDF gained more weight than those fed TF. The
repeated measures analysis similarly demonstrated a
significant interaction between feeding and birth
weight group (
P
⫽
.02); among infants with birth
weights
⬍
1250 g, those fed PDF weighed
signifi-cantly more (
P
⬍
.001). The growth modeling
anal-ysis showed a significant overall feeding effect, with
PDF-fed infants weighing significantly more than
TF-fed infants (
P
⫽
.044).
Infants fed PDF were significantly longer than
those fed TF at 3 months’ CA. At 6 months’ CA, there
was a significant interaction between feeding and
birth weight group; among infants with birth
weights
⬍1250 g, those fed PDF were longer than
those fed TF. The repeated measures analysis
simi-larly demonstrated an overall greater length for
PDF-fed infants (
P
⫽
.004), and the growth modeling
analysis showed a significant overall feeding effect,
with PDF-fed infants having greater lengths than
TF-fed infants (
P
⫽
.008).
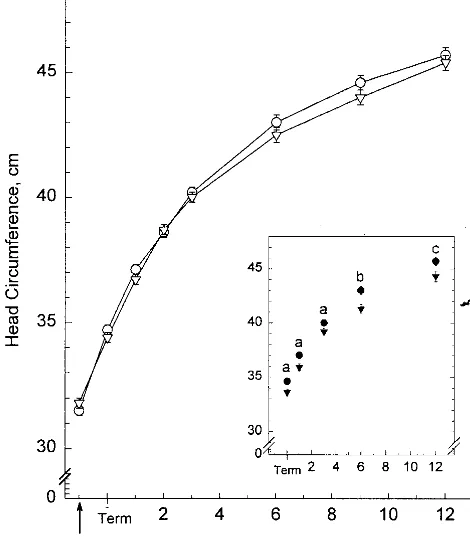
For head circumference, there were significant
in-teractions between feeding and birth weight group at
term, 1, 3, 6, and 12 months’ CA; among infants with
TABLE 4. Gains in Weight (g/d), Length (mm/d), and Head Circumference (mm/d) from Study Day 1 to 12 Months’ CA*
PDF TF PDF Versus TF†
PValues Main
Effects
Interaction Effects Study day 1 to term
Weight 34.1⫾2.4 (45) 28.9⫾2.4 (40) — .041
Length 1.24⫾0.23 (38) 1.08⫾0.20 (34) .25 —
Head circumference 1.06⫾0.06 (43) 0.88⫾0.06 (38) .042 Study day 1 to 1 mo
Weight 34.1⫾1.3 (44) 30.8⫾1.3 (38) .02 —
Length 1.37⫾0.11 (37) 1.45⫾0.09 (33) .24 —
Head circumference 0.93⫾0.04 (41) 0.85⫾0.04 (36) — .022 Study day 1 to 2 mo
Weight 33.2⫾1.2 (36) 30.2⫾1.2 (34) .03 —
Length 1.34⫾0.07 (31) 1.33⫾0.06 (30) .44 —
Head circumference 0.81⫾0.03 (34) 0.76⫾0.03 (33) .08 — Study day 1 to 3 mo
Weight 31.2⫾1.1 (37) 29.5⫾1.0 (34) .10 —
Length 1.28⫾0.05 (31) 1.19⫾0.04 (30) .06 —
Head circumference 0.72⫾0.02 (34) 0.68⫾0.02 (32) .08 — Study day 1 to 6 mo
Weight 26.3⫾0.9 (33) 25.1⫾1.0 (28) .14 —
Length 1.01⫾0.04 (29) 0.98⫾0.03 (25) — .053
Head circumference 0.56⫾0.02 (31) 0.53⫾0.02 (27) .07 — Study day 1 to 9 mo
Weight 22.5⫾0.8 (33) 21.4⫾0.8 (27) .15 —
Length 0.89⫾0.03 (29) 0.84⫾0.02 (23) — ⬍.013
Head circumference 0.45⫾0.01 (32) 0.42⫾0.01 (25) ⬍.01 — Study day 1 to 12 mo
Weight 18.6⫾0.8 (21) 17.4⫾0.8 (23) — .014
Length 0.75⫾0.03 (18) 0.73⫾0.03 (20) .20 —
Head circumference 0.36⫾0.01 (21) 0.33⫾0.01 (22) — .034 * Data are reported as least square means⫾standard error of mean adjusted for site, gender, and birth weight group and analyzed by analysis of variance controlling for site, feeding group, gender, and birth weight group.
†Pvalues are 1-sided for main effects and 2-sided for interactions.Pvalues with superscripts are for interactions as indicated: 1Feeding by gender interaction: among male infants; PDF⬎TF,P⫽.01.
2Feeding by birth weight group interaction: among infants with birth weightⱕ1250 g; PDF⬎TF,P⬍.02. 3Feeding by gender by birth weight group interaction: no significant feeding effects within subgroups.
birth weights
⬍
1250 g, those fed PDF had larger
circumferences than those fed TF (Fig 1). There were
also interactions between feeding and birth weight
group for head circumference gains (mm/d); among
infants with birth weights
⬍
1250 g, gains in head
circumference from study day 1 to term and to 1
month CA were greater for PDF-fed infants than for
TF-fed infants. From study day 1 to 12 months’ CA,
there was a significant feeding by gender by birth
weight group interaction; among male infants with
birth weight
⬍
1250, those fed PDF had greater gains
in head circumference than those fed TF. The
re-peated measures analysis demonstrated greater head
circumference growth among PDF-fed infants with
birth weights
⬍
1250 g (
P
⫽
.015), and the growth
modeling analysis demonstrated a significant
feed-ing by birth weight interaction (
P
⫽
.003), with
PDF-fed infants with birth weights
⬍
1250 g having
greater head circumferences than those fed TF (
P
⫽
.004).
After hospital discharge, energy intakes from
for-mula were not different among infants fed PDF
ver-sus TF (Table 5). However, the volume of formula
intake was lower (
P
⬍
.05) at 1 month CA and
protein intake from formula was higher (
P
⬍
.05) at
term, 2, and 3 months’ CA for the PDF-fed infants.
Serum levels of albumin and blood levels of
he-moglobin did not differ between diet groups (Table
6). Serum levels of prealbumin and retinol-binding
protein were higher in infants fed PDF; these
differ-ences were statistically significant at term and 9
months’ CA for prealbumin and at term for
retinol-binding protein. Serum urea nitrogen levels were
consistently significantly higher (
P
ⱕ
.01) for
PDF-fed infants.
Both formulas were well-tolerated. Stools of
PDF-fed infants were darker than those of TF-PDF-fed infants
at several time points.
DISCUSSION
During hospitalization, preterm infants,
particu-larly those born with very low birth weights, are fed
fortified human milk or preterm infant formulas to
try to achieve weight gain and bone mineralization
that approximate that of the reference fetus.
1These
infants often are fed unfortified breast milk or term
formulas after hospital discharge. This practice is
associated with poor somatic growth, developmental
delays, poor bone mineralization,
30,32–34and
insuffi-cient nutrient stores.
35–37Strategies that are often
used to fortify feedings for formula-fed infants after
hospital discharge may be inappropriate.
Fortifica-tion with energy alone, for example, may not be
sufficient because postdischarge preterm infants may
need additional intakes of specific nutrients and
higher nutrient to energy ratios to achieve optimal
growth and bone mineralization. Concentrating term
formulas to levels that would provide adequate
lev-els of protein and calcium may result in an
unaccept-able increase in osmolality or in the concentrations of
other nutrients.
38In the present study, preterm infants were fed
either PDF, a nutrient-enriched 22 kcal/fl oz formula
designed for preterm infants after discharge, or TF, a
20 kcal/fl oz standard formula for term infants.
Infants fed PDF had improved growth compared
with those fed TF, with the most significant
benefi-cial effects seen among infants with birth weights
⬍
1250 g. Infants fed PDF also had greater gains in
weight and head circumference compared with those
fed TF, especially within the first 1 to 2 months after
discharge. The early differences in gains suggest a
particularly important effect of nutrient-enriched
feedings during the early postdischarge period.
Al-though a limitation of the present study is the
sig-nificant loss to follow-up among infants who exited
the study early, the improvements in growth were
found using 3 separate statistical approaches. Other
investigators have reported enhanced growth in
pre-term infants fed nutrient-enriched formula after
hos-pital discharge,
27–29,39,40or after a weight of 1850 g
was achieved.
42Chan et al,
41however, reported no
advantage to feeding nutrient-enriched formula to 8
weeks of age.
In agreement with other investigators, infants fed
the less calorically dense TF had higher volumes of
formula intake than those fed PDF.
28,29This led to
consumption of similar energy intakes despite a 10%
difference in caloric density. These data suggest
some ability of the infants to compensate for
differ-ences in energy density. Serum levels of prealbumin,
which are reported to correlate with weight and
length in VLBW infants,
43were significantly higher
among infants fed PDF at term and 9 months’ CA.
Serum urea nitrogen levels were higher among
fed infants at each time point, but mean values were
within reference ranges.
Poor somatic growth during the first year is
asso-ciated with delays in neurodevelopment of preterm
infants.
17,44,45Small head circumference
measure-ments, in particular, may have long-term prognostic
significance for later neurodevelopment in infants
born prematurely. Hack et al
15reported that
subnor-mal head size at 8 months of age predicted the 20
month Mental Development Index Score (Bayley’s
Scales of Infant Development) in VLBW infants,
while Gross et al
46reported that head circumference
at birth and postnatal head circumference, when
taken together, were strong predictors of early
de-velopmental outcome in VLBW infants. Hack and
colleagues
44have suggested that the first year of life
provides an important opportunity for human
so-matic and brain growth to compensate for earlier
deprivation. An effect of nutrition during this
vul-nerable period of brain development on long-term
developmental outcomes is suggested by studies in
which the feeding of nutrient-enriched formulas to
preterm infants during hospitalization was
associ-ated with improved neurodevelopmental outcomes
at 9 months,
2218 months,
23and 7.5 to 8 years old.
19In the present study, the most significant effect seen
with feeding PDF versus TF was larger head
circum-ference measurements among infants born with birth
weights
⬍1250 g.
Provision of additional nutrients after hospital
dis-charge may be particularly beneficial for infants with
conditions that contribute to a relative increase in
morbidity, including the presence of chronic disease,
in utero growth retardation, or extremely low birth
weight. A particular growth benefit of
nutrient-en-riched formulas is indicated by the present study for
infants with birth weights
⬍1250 g. In addition, an
effect of gender on postdischarge responsiveness to
nutrient supplementation of preterm infants is
sug-gested by our data and those of Cooke et al,
29,41in
which the feeding of nutrient-enriched formulas
af-ter hospital discharge was of particular benefit for
male infants.
It is increasingly recognized that formulas
de-signed to meet the nutritional needs of term infants
are unlikely to provide the most appropriate
post-discharge nutrition for preterm infants. The results of
the present study demonstrated that the feeding of a
nutrient-enriched formula to preterm infants after
hospital discharge resulted in improved growth and
TABLE 5. Protein, Energy, and Volume Intakes From Formula From Term to Nine Months’ CA for Preterm Infants Fed PDF or TF From Hospital Discharge to 12 Months’ CA*
Term 1 Month 2 Months 3 Months 6 Months 9 Months
Volume intake, mL/kg/d
PDF 190⫾10 173⫾9a 160⫾8 155⫾10 132⫾12 103⫾8
TF 213⫾9 212⫾8b 174⫾8 177⫾9 147⫾13 124⫾8
Protein intake, g/kg/d
PDF 3.7⫾0.2c 3.4⫾0.1 3.1⫾0.1c 3.0⫾0.2e 2.6⫾0.2 2.0⫾0.1 TF 3.1⫾0.2d 3.1⫾0.1 2.5⫾0.1d 2.6⫾0.1f 2.2⫾0.2 1.8⫾0.2 Energy intake, Kcal/kg/d
PDF 142⫾7 129⫾6 119⫾6 116⫾7 99⫾9 77⫾6
TF 144⫾7 144⫾6 118⫾6 120⫾6 100⫾9 84⫾6
* Data are expressed as least squares means⫾standard error of mean controlling for site, gender, and birth weight group (⬍1250 g,ⱖ1250 g). Different letter superscripts for comparisons of PDF versus TF indicate statistically significant differences.
abP⬍.001 cdP⬍.01 efP⬍.05
TABLE 6. Serum Levels of Albumin (g/dL), Prealbumin (mg/dL), Retinol-Binding Protein (mg/dL) and Urea Nitrogen (mg/dL), and Blood Hemoglobin (g/dL) at term, Three, and Nine Months’ CA in Infants Fed PDF or TF After Hospital Discharge*
PDF TF PDF Versus TF
Term
Albumin 3.9⫾0.1 (27) 3.9⫾0.1 (25) NS
Pre-albumin 15.0⫾0.7 (27) 11.2⫾0.6 (25) ⬍0.01
Retinol-binding protein 3.3⫾0.3 (25) 2.5⫾0.3 (23) 0.05 Serum urea nitrogen 10.2⫾0.8 (15) 4.9⫾0.7 (15) ⬍0.01
Hemoglobin 10.2⫾0.3 (39) 10.6⫾0.3 (37) NS
3 months
Albumin 4.4⫾0.1 (14) 4.3⫾0.1 (20) NS
Pre-albumin 18.3⫾1.4 (13) 17.7⫾1.2 (18) NS
Retinol-binding protein 4.5⫾0.4 (13) 3.4⫾0.4 (17) NS Serum urea nitrogen 11.5⫾0.7 (8) 8.9⫾0.5 (15) 0.01
Hemoglobin 12.0⫾0.3 (25) 11.6⫾0.3 (25) NS
9 months
Albumin 4.6⫾0.1 (13) 4.4⫾0.1 (16) NS
Prealbumin 24.0⫾1.3 (12) 18.9⫾1.4 (13) 0.02
Retinol-binding protein 5.0⫾0.3 (12) 4.5⫾0.4 (13) NS Serum urea nitrogen 13.4⫾1.2 (7) 8.5⫾1.2 (9) 0.01
Hemoglobin 12.2⫾0.2 (25) 12.4⫾0.2 (19) NS
growth gains to 12 months’ CA compared with
feed-ing infants a formula designed for term infants. The
beneficial effects were most evident for infants with
birth weights
⬍
1250 g.
ACKNOWLEDGMENTS
This study was supported in part by Ross Products Division, Abbott Laboratories, Columbus, Ohio, and by NIH General Clin-ical Research Center Grant RR00059.
The assistance of Robin Carroll, MS, RD, LD; Michelle Atwood, BSN; Mary Reilly, RN; and the General Clinical Research Center nurses, Karen J. Johnson and Gretchen A. Cress, is gratefully acknowledged.
REFERENCES
1. American Academy of Pediatrics, Committee on Nutrition. Nutritional needs of preterm infants. In Kleinman RE, ed.Pediatric Nutrition
Hand-book.Elk Grove, IL: American Academy of Pediatrics; 1998:55–79
2. Fenton TR, McMillan DD, Sauve RS. Nutrition and growth analysis of very low birthweight infants.Pediatrics. 1990;86:378 –383
3. Hack M, Horbar JD, Malloy MH, Tyson JE, Wright E. Very low birth-weight outcomes of the National Institute of Child Health and Human Developmental Neonatal Network.Pediatrics. 1991;87:587–597 4. Widdowson EM. Changes in body proportions and composition during
growth. In Davis JA, Dobbing J, eds.Scientific Foundations of Paediatrics. Philadelphia, PA: WB Saunders Co; 1974:153–163
5. Bishop NJ, King FJ, Lucas A. Increased bone mineral content of preterm infants fed with a nutrient enriched formula after discharge from hos-pital.Arch Dis Child. 1993;68:573–578
6. Casey PH, Kraemer HC, Bernbaum J, et al. Growth status and growth rates of a varied sample of low birth weight, preterm infants: a longi-tudinal cohort from birth to three years of age. J Pediatr. 1991;119: 599 – 605
7. Kitchen WH, Doye LW, Ford GW, Callanan C. Very low birthweight growth to age 8 years.Am J Dis Child. 1992;146:40 – 45
8. Elliman AM, Bryan EM, Elliman AD, Harvey DR. Gestational age correction for height in preterm children to seven years of age.Acta Paediatr. 1992;81:836 –39
9. Hack M, Weissman B, Breslau N, Klein N, et al. Health of very low birth weight children during their first eight years.J Pediatr. 1993;122:887– 892 10. Qvigstad E, Verloove-Vanhorick SP, Ens-Dokkum MH, et al. Prediction of height achievement at five years of age in children born very preterm or with very low birthweight: Continuation of catch-up growth after two years of age.Acta Paediatr. 1993;82:444 – 448
11. Hack M, Weissman B, Borawski-Clark E. Catch-up growth during child-hood among very low-birth-weight children.Arch Pediatr Adolesc Med. 1996;150:1122–1129
12. McCormick MC. The contribution of low birth weight to infant mortal-ity and childhood morbidmortal-ity.N Engl J Med. 1985;312:82–90
13. Kurl S, Heinonen K, La¨nsimies E, et al. Determinants of bone mineral density in prematurely born children aged 6 –7 years. Acta Paediatr. 1998;87:650 – 653
14. Kelleher KJ, Casey PH, Bradley RH, et al. Risk factors and outcomes for failure to thrive in low birth weight preterm infants.Pediatrics. 1993;91: 941–948
15. Hack MB, Breslau N, Fanaroff AA. Differential effects of intrauterine and postnatal brain growth failure in infants of very low birthweight.
Am J Dis Child. 1989;143:63– 68
16. Georgieff MK, Mills MM, Lindeke L, Iverson S, Johnson DE, Thomson TR. Changes in nutritional management and outcome of very-low-birthweight infants.Am J Dis Child. 1989;143:82– 85
17. Wocadlo C, Riwger I. Developmental outcome at 12 months corrected age for infants born less than 30 weeks gestation: influence of reduced intrauterine and postnatal growth.Early Hum Dev. 1994;39:127–137 18. Hack MB, Taylor G, Klein N, Eiben R, Schatschneider C,
Mercuri-Minich N. School-age outcomes in children with birth weights under 750 g.N Engl J Med. 1994;331:753–759
19. Lucas A, Morley R, Cole TJ. Randomized trial of early diet in preterm babies and later intelligence quotient.Br Med J.1998;317:1481–1487 20. Lucas A, Gor SM, Cole TJ, et al. Multicentre trial on feeding low
birthweight infants: effects of diet on early growth.Arch Dis Child. 1984;59:722–730
21. Cooper PA, Rotherberg AD, Davies VA, Argent AC. Comparative
growth and biochemical response of very low birthweight infants fed own mother’s milk, a premature infant formula or one of two standard formulas.J Pediat Gastr Nutr. 1985;4:786 –794
22. Lucas A, Morley R, Cole TJ, et al. Early diet in preterm babies and developmental status in infancy.Arch Dis Child. 1989;64:1570 –1578 23. Lucas A, Morley R, Cole TJ, et al. Early diet in preterm babies and
developmental status at 18 months.Lancet. 1990;335:1477–1481 24. Kashyap S, Forsyth M, Zucker C, Ramakrishnan R, Dell RB, Heird WC.
Effects of varying protein and energy intakes on growth and metabolic response in low birthweight infants.J Pediatr. 1986;108:955–963 25. Kashyap S, Schulze KF, Forsyth M, et al. Growth, nutrient retention,
and metabolic response in low birth weight infants fed varying intakes of protein and energy.J Pediatr. 1988;113:713–721
26. Kashyap S, Schulze KF, Forsyth M, Dell RB, Ramakrishnan R, Heird WC. Growth, nutrient retention and metabolic response of low-birth-weight infants fed supplemented and unsupplemented preterm human milk.Am J Clin Nutr. 1990;52:2543–262
27. Lucas A, Bishop NJ, King FJ, Cole TJ. Randomised trial of nutrition for preterm infants after discharge.Arch Dis Child. 1992;67:324 –327 28. Wheeler RE, Hall RT. Feeding of premature infant formula following
discharge of infants weighing less than 1800 grams at birth.J Perinatol. 1996;16:111–116
29. Cooke RJ, Griffin IJ, McCormich K, et al. Feeding preterm infants after hospital discharge: effect of dietary manipulation on nutrient intake and growth.Pediatr Res. 1998;43:355–360
30. Chan GM. Growth and bone mineral status of discharged very low birth weight infants fed different formulas or human milk.J Pediatr. 1993;123: 439 – 443
31. Zhang S, Kuznetsova OM, Jacobs JR. Use of a Gompertz curve to describe patterns of early growth in term and preterm infants.Am J
Human Biol. 1998;10:165A
32. Chan GM, Mileur LJ. Posthospitalization growth and bone mineral status of normal preterm infants.Am J Dis Child. 1985;139:896 – 898 33. Abrams SA, Schanler RJ, Tsang RC, Garza C. Bone mineralization in
former very low birth weight infants fed either human milk or com-mercial formula: one-year follow-up observation. J Pediatr. 1989;114: 1041–1044
34. Schanler RJ, Burns PA, Abrams SA, Garza C. Bone mineralization outcomes in human milk-fed preterm infants. Pediatr Res. 1992;31: 583–586
35. Zimmerman AW, Hambidge KM, Lepow ML, et al. Acrodermatitis in breast-fed premature infants: evidence for a defect of mammary zinc secretion.Pediatrics. 1982;69:176 –183
36. Murphy JF, Gray OP, Rendall JR, Hann S. Zinc deficiency: a problem with preterm breast milk.Early Human Development. 1985;10:303–307 37. Friel JK, Andrews WL. Zinc requirement of premature infants.
Nutri-tion. 1994;10:63– 65
38. Lucas A, Hay W. Posthospital nutrition in the preterm infant: general conclusions. In:Report of the 106th Ross Conference on Pediatric Research. Irving, TX: Ross Products Division, Abbott Laboratories; 1996:135–137 39. Brunton JA, Atkinson SA, Saigal S. Growth and body composition in infants with bronchopulmonary dysplasia up to 3 months corrected age: A randomized trial of high-energy nutrient-enriched formula fed after hospital discharge.J Pediatr. 1998;133:340 –345
40. Cooke RJ, McCormick K, Griffin IJ, et al. Feeding preterm infants after hospital discharge: effect of diet on body composition. Pediatr Res. 1999;46:461– 464
41. Chan GM, Borschel MW, Jacobs JR. Effects of human milk or formula feeding on the growth, behavior, and protein status of preterm infants discharged from the newborn intensive care unit. Am J Clin Nutr. 1994;60:710 –716
42. Friel JK, Andrews WL, Matthew JD, McKim E, French S, Long DR. Improved growth of very low birthweight infants.Nutr Res. 1993;13: 611– 620
43. Polberger SK, Fex GH, Axelsson IE, Raiha NC. Eleven plasma proteins as indicators of protein nutritional status in very low birth weight infants.Pediatrics. 1990;86:916 –921
44. Hack M, Merkaatz IR, Gordon D, Jones PK, Fanaroff AA. The prognos-tic significance of postnatal growth in very low birthweight infants.
Am J Obstet Gynecol. 1982;143:693– 699
45. Ross G, Lipper EG, Pain A. Physical growth and developmental out-comes in very low birth weight premature infants at 3 years of age.
J Pediatr. 1985;107:284 –286