ARTICLE
Relationship Between White Matter Apparent
Diffusion Coefficients in Preterm Infants at
Term-Equivalent Age and Developmental Outcome
at 2 Years
Michelle L. Krishnan, BSca, Leigh E. Dyet, MRCPCHa,b, James P. Boardman, PhD, MRCPCHa,b, Olga Kapellou, MRCPCHa,b, Joanna M. Allsop, DCRa, Frances Cowan, PhD, MRCPCHb, A. David Edwards, FMedScia,b, Mary A. Rutherford, MD, FRCRa,b, Serena J. Counsell, PhDa
aRobert Steiner Magnetic Resonance Unit andbDepartment of Paediatrics, Imaging Sciences Department, Medical Research Council Clinical Sciences Centre, Imperial
College London, London, United Kingdom
The authors have indicated they have no financial relationships relevant to this article to disclose.
ABSTRACT
OBJECTIVE.The aim of this study was to develop a simple reproducible method for the measurement of apparent diffusion coefficient values in the white matter of preterm infants using diffusion-weighted imaging to test the hypothesis that elevated mean apparent diffusion coefficient values are associated with lower developmental quotient scores at 2 years’ corrected age.
METHODS.We obtained diffusion-weighted imaging in 38 preterm infants at
term-equivalent age who had no evidence of overt cerebral pathology on conventional MRI. Mean apparent diffusion coefficient values at the level of the centrum semiovale were determined. The children were assessed using a standardized neurologic examination, and the Griffiths Mental Development Scales were ad-ministered to obtain a developmental quotient at 2 years’ corrected age. The relationship between mean apparent diffusion coefficient values and developmen-tal quotient was examined. Clinical data relating to postnadevelopmen-tal sepsis, antenadevelopmen-tal steroid exposure, supplemental oxygen, gender, patent ductus arteriosus, and inotrope requirement were collected, and the mean apparent diffusion coefficient values for each group were compared.
RESULTS.The mean (⫾SD) apparent diffusion coefficient value in the white matter was 1.385⫾0.07⫻10⫺3mm2/second, and the mean developmental quotient was 108.9⫾11.5. None of the children had a significant neurologic problem. There was a significant negative correlation between mean apparent diffusion coefficient and developmental quotient.
CONCLUSION.These findings suggest that higher white matter apparent diffusion
coefficient values at term-equivalent age in preterm infants without overt lesions are associated with poorer developmental performance in later childhood. Con-sequently, apparent diffusion coefficient values at term may be of prognostic value for neurodevelopmental outcome in infants who are born preterm and who have no other imaging indicators of abnormality.
www.pediatrics.org/cgi/doi/10.1542/ peds.2006-3054
doi:10.1542/peds.2006-3054
Key Words
brain, preterm, diffusion-weighted imaging, neurodevelopmental outcome, MRI
Abbreviations
cPVL— cystic periventricular leukomalacia HPI— hemorrhagic parenchymal infarction DEHSI— diffuse excessive high-signal intensity
DWI— diffusion-weighted imaging ADC—apparent diffusion coefficient DQ— developmental quotient GA— gestational age TR—repetition time TE— echo time CSF— cerebrospinal fluid ROI—regions of interest PMA—postmenstrual age GQ— generalized quotient Accepted for publication Jan 30, 2007
Address correspondence to Serena J. Counsell, PhD, Robert Steiner MR Unit, Imaging Sciences Department, Imperial College London, Hammersmith Hospital, Du Cane Road, London W12 0HS, United Kingdom. E-mail: [email protected]
D
EVELOPING WHITE MATTERis a major site of tissue injury, the mechanisms of which are as yet poorly understood. As survival rates of preterm infants im-prove, the nature of the prevailing neurodevelopmental abnormalities has also been evolving. Focal lesions such as cystic periventricular leukomalacia (cPVL) and hem-orrhagic parenchymal infarction (HPI) are less fre-quent,1–3and the detection of more subtle abnormalities is improving. The implementation of long-term fol-low-up studies, along with more advanced assessment tools and higher survival rates, has led to the identifica-tion of neuroimaging abnormalities in preterm infants with no overt pathology on early ultrasound.4We previously reported a subtle form of white matter abnormality described as diffuse excessive high-signal intensity (DEHSI) in up to 75% of infants born at⬍30 weeks’ gestation and imaged at term-equivalent age.5 We used diffusion-weighted imaging (DWI) to investi-gate the nature of DEHSI and found that apparent dif-fusion coefficient (ADC) values were elevated in the white matter of preterm infants with DEHSI compared with those with normal appearing white matter. Fur-thermore, ADC values in DEHSI were not significantly different from those in the white matter of infants with focal white matter injury, suggesting that DEHSI repre-sents a diffuse white matter abnormality.6In addition, elevated ADC values are associated with a decrease in volume of central gray matter in preterm infants with no signs of acute injury, suggesting a failure of growth and abnormal connectivity of these structures.7The aims of this study were to (1) devise a simple method for quan-titative DWI analysis of white matter in a cohort of preterm infants with no detectable abnormalities on conventional MRI at term-equivalent age and (2) assess white matter ADC values and developmental quotient (DQ) scores at 2 years’ corrected age to test the hypoth-esis that there is a negative correlation between ADC values and DQ.
METHODS
Ethical permission for this study was granted by the Hammersmith Hospital Research Ethics Committee, and written informed parental consent was obtained for each infant. The study group included preterm infants who were born atⱕ34 weeks’ gestational age (GA) at Queen Charlotte’s and Chelsea Hospital, underwent DWI at term-equivalent age between October 2001 and October 2003, and had neurodevelopmental assessment at 2 years’ corrected age. Infants were recruited to this on-going MRI study on brain development in preterm in-fants when their parents agreed and suitable scanning time was available. Infants with overt white matter le-sions on conventional MRI (eg, cPVL, HPI) or posthem-orrhagic hydrocephalus were excluded from the study group. No infants required mechanical ventilation at the
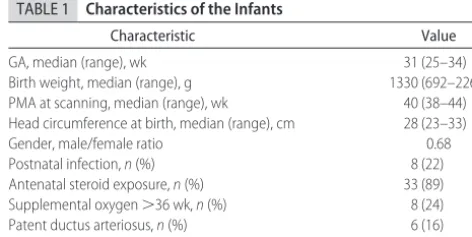
time of the MRI examination. The characteristics of the infants are summarized in Table 1.
MRI was performed on a 1.5 Tesla Eclipse scanner (Philips Medical Systems, Best, Netherlands) using a dedicated pediatric head coil. The infants were sedated for imaging with oral chloral hydrate (20 –30 mg/kg), and pulse oximetry and electrocardiography were mon-itored throughout the procedure. Ear protection was used for each infant (Natus MiniMuffs; Natus Medical Inc, San Carlos, CA). An experienced neonatologist who was trained in MRI procedures was in attendance throughout the MRI examination. Transverse T1-weighted conventional spin echo (repetition time [TR] 500 milliseconds/echo time [TE] 15 milliseconds) and T2-weighted fast spin echo (TR 4500 milliseconds/TEeff 210 milliseconds) images were obtained before the DWI. Single-shot echo planar DWI was obtained using the following pulse sequence parameters: TR, 6000 milli-seconds; TE, 100 millimilli-seconds; matrix, 100 ⫻100; field of view, 24 cm; and slice thickness, 5 mm. A reference image was obtained with abvalue of 0, and DWIs were obtained with a b value of 1000 seconds/mm2 in the read, phase, and slice directions.
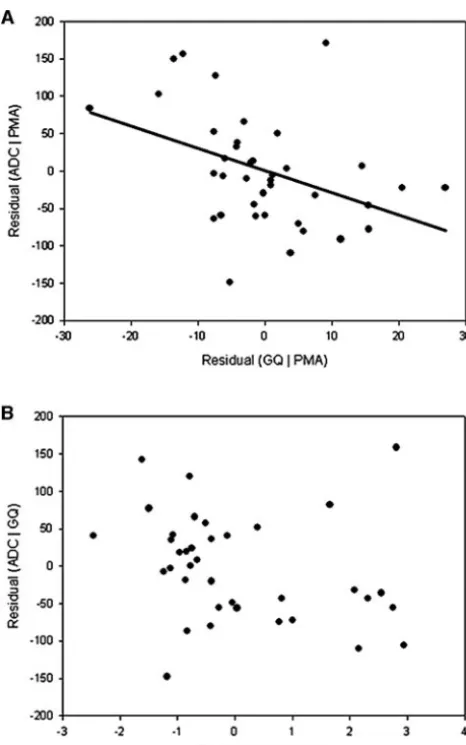
Regions of interest (ROI) that included the entirety of the white matter at the level of the centrum semiovale (on the transverse slice above the level of the lateral ventricles, where the central sulcus was at its maximum depth) in both hemispheres were drawn. The ROI were drawn on the ADC map. The white matter was outlined manually taking care to avoid cerebrospinal fluid (CSF) or cortical gray matter (Fig 1). The level of the centrum semiovale was selected for examination because it was possible to outline the white matter boundary without the need to segment other brain structures, such as central gray matter or lateral ventricles. A single inves-tigator (Ms Krishnan) made all of the white matter out-lines to maintain consistency. Test–retest consistency was assessed by repetition of the measurements in both hemispheres in 10 infants, and the coefficient of varia-tion was⬍1%.
Infants who were recruited into the study had a neu-rodevelopmental assessment using the Griffiths Mental Development Scales (Revised)8at 2 years’ corrected age
TABLE 1 Characteristics of the Infants
Characteristic Value
(range: 1.73–2.42 years). For those who reached age⬎2 years, the 2- to 8-years Griffiths scales were used, scores from the younger scales were increased appropriately, and overall DQ then was calculated. The assessments were performed by experienced, appropriately trained pediatricians who were blinded to the brain MRI find-ings. The majority of children (n⫽28) were assessed by the same investigator (Dr Dyet). The Griffiths Mental Development Scales provide an overall DQ with sub-scales assessing skill areas (locomotor, personal-social, hearing and speech, eye and hand coordination, perfor-mance, and additionally practical reasoning for children
⬎2 years). The mean (⫾SD) DQ score for the general population is 100 (⫾12).
The children were also examined using the Hammer-smith Infant Neurologic examination, which has been standardized at 12 to 18 months.9,10 A score from the examination can be calculated, the optimal being be-tween 73 and 78 in term-born infants. The score can also be used to predict independent sitting and walking by 2 years. The children were examined again at their 2-year visit for any evidence of cerebral palsy.
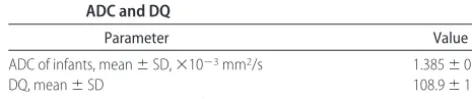
ADC values and DQ scores were tested for normality. Multiple regression analysis was used to test the rela-tionship between DQ at 2 years of age and ADC value at term-equivalent age, adjusting for postmenstrual age (PMA) at scan. Multiple regression analysis is not sus-ceptible to simple graphic exposition in 2 dimensions. However, partial regression plots can show the relation-ship of individual variables in a multiple regression model by plotting the residuals from 2 partial regres-sions. Because the simple correlation between these 2 sets of residuals plotted is equal to the partial correlation between the dependent variable and single independent variable, partial regression plots capture the correct strength of the linear relationship between these 2
vari-ables. Partial regression plots are formed by plotting
Y[i[r]]versusXi[i[r]], where Y[i[r]] is residuals from re-gressing Y (the dependent variable) against all of the independent variables except XiandXi[i[r]] is residuals from regressing Xi against the remaining independent
variables.
Clinical data including history of postnatal sepsis, an-tenatal steroid exposure, supplemental oxygen at 36 weeks, gender, patent ductus arteriosus, and inotrope requirement were collected. Sepsis was defined as a positive culture of blood, urine, abscess, or CSF during the Queen Charlotte’s and Chelsea Hospital neonatal episode (ie, from birth to discharge). In a series of ex-ploratory analyses, unpairedttests were used to assess whether the mean ADC values were significantly differ-ent between clinical groups.
RESULTS
Seventy-four preterm infants had DWI at term-equiva-lent age. Five infants were excluded from the study because they had cPVL, 3 because they had HPI, and 3 because of posthemorrhagic hydrocephalus. DWI data were degraded because of motion in 13 infants, and neurodevelopmental data were not available for 12 in-fants at 2 years’ corrected age. (The parents of 6 inin-fants did not wish to attend, including 1 set of triplets and 1 set of twins; 5 infants now are living abroad, and 1 infant did not attend the appointment. ADC values in these infants were not significantly different from those who were included in the study [P⫽.79].)
DWI and neurodevelopmental assessment data were available for 38 preterm infants. There were no compli-cations during or immediately after the MRI studies. The median GA at birth was 31 weeks, and the median PMA at scanning was 40 weeks (range: 38 – 44 weeks). Twen-ty-eight infants had evidence of DEHSI on conventional MRI.
The distributions of mean ADC and DQ were not significantly different from a normal distribution (P ⫽
.174 andP⫽.108). The mean ADC of all the infants was 1.385⫾0.07⫻10⫺3mm2/second. The mean (⫾SD) DQ in the 38 children was 108.9⫾11.5 at a median age of 2.05 years (range: 1.73–2.42 years; Table 2). There was no relationship between GA at birth and corrected age at neurodevelopmental assessment (P⫽.64). No child had evidence of cerebral palsy at 2 years. In addition, the optimality scores that were obtained in 33 of the 38 children from a neurologic examination between 12 and FIGURE 1
ADC maps at the level of the centrum semiovale in a preterm infant imaged at 39 weeks’ postmenstrual age, showing delineation of the white matter in the left and right hemi-spheres.
TABLE 2 Mean ADC and DQ Values and Relation Between Mean ADC and DQ
Parameter Value
ADC of infants, mean⫾SD,⫻10⫺3mm2/s 1.385⫾0.07
DQ, mean⫾SD 108.9⫾11.5
18 months were⬎73 (median: 75; range: 69 –78).9Five children did not have this examination at the appropri-ate age for this assessment but were normal at 2 years. Multiple regression analysis demonstrated a signifi-cant negative correlation between mean ADC and DQ (P
⫽.014; Table 2, Fig 2). ADC values in the clinical vari-able groups were normally distributed and so were com-pared using unpaired t tests. Because only 2 infants received inotropes, ADC values in this group were com-pared with ADC values in the infants who did not re-ceive inotropes using a Mann-WhitneyUtest. ADC val-ues were significantly elevated in infants who had a history of postnatal sepsis compared with those who did not (P⫽.03). Organisms that were isolated from blood cultures were methicillin-resistant Staphylococcus aureus
(n⫽ 2), coagulase-negative Staphylococcus (n ⫽3), En-terococcus(n⫽1),Candida albicans(n⫽1),Escherichia coli
(n⫽1), andS epidermidis(n⫽1; 1 infant had episodes of bothC albicansandS epidermidis). The median age at onset of infection was 9 days (range: 3–28 days). No other significant differences in ADC values were associ-ated with the clinical variables (Table 3).
DISCUSSION
The results of this study indicate that there is a signifi-cant negative correlation between mean ADC values in the white matter of the centrum semiovale in preterm infants who have no overt pathology on conventional MRI and their DQ scores at 2 years’ corrected age. This negative correlation suggests that white matter abnor-mality may represent cerebral damage that gives rise to lower DQ scores, which might be mediated through associated cortical and deep gray matter deficits, al-though additional work is needed to clarify this. None of the children had cerebral palsy or evidence of a subop-timal neurologic examination that alone could account for the lower DQ values in the infants with the higher ADC values.
DWI examines the Brownian motion of water in tis-sue, and the ADC value is a measure of mean water molecular displacement. With the use of DWI, mean ADC values of 1.385⫾0.07⫻10⫺3mm2/second were obtained in this study at the level of the centrum semi-ovale. This compares well with previous findings of 1.4⫾0.2⫻10⫺3mm2/second in central white matter of preterm infants at term using line scan diffusion tensor imaging11and ADC values of 1.361⫾0.1⫻10⫺3mm2/ second for frontal white matter, 1.287 ⫾0.10 ⫻10⫺3 mm2/second for central white matter, and 1.315⫾0.11
⫻ 10⫺3 mm2/second for posterior white matter ob-tained using smaller ROI at the level of the centrum semiovale.6
Recent MRI studies have demonstrated an association between MRI-defined abnormalities and poor
neurode-TABLE 3 Comparison of Mean ADC Values Between Groups With Different Clinical Characteristics
Variable Groups ADC, Mean⫾SD,
⫻10⫺3mm2/s P
Postnatal sepsis No (n⫽30) 1.378⫾0.648 .03 Yes (n⫽8) 1.410⫾0.106 Antenatal steroid exposure No (n⫽5) 1.371⫾0.698 .74
Yes (n⫽33) 1.387⫾0.764 Supplemental oxygen
⬎36 wk
No (n⫽30) 1.369⫾0.795 .17
Yes (n⫽8) 1.389⫾0.537 Gender Male (n⫽17) 1.406⫾0.792 .31
Female (n⫽21) 1.368⫾0.683 Patent ductus arteriosus No (n⫽32) 1.385⫾0.789 .97
Yes (n⫽6) 1.384⫾0.532 Inotrope requirement No (n⫽36) 1.388⫾0.755 .89
Yes (n⫽2) 1.385⫾0.460
FIGURE 2
velopmental assessment scores.3,12 Woodward et al12 found that white matter and gray matter abnormalities on MRI were associated with lower neurodevelopmental assessment scores at 2 years’ corrected age and that there was a correlation between the severity of the MRI-de-fined abnormality and the degree of neurodevelopmen-tal impairment. The most frequently found imaging ab-normalities in preterm infants at term-equivalent age are noncystic white matter phenomena seen as DEHSI on T2-weighted images,3,5 abnormal cortical development, and enlarged lateral ventricles.3,13 DEHSI is observed in ⬃75% to 80% of preterm infants at term-equivalent age,3,5and it is yet to be shown whether DEHSI repre-sents a mild diffuse form of PVL. It may not reflect a specific injury but rather abnormal development as a result of preterm delivery into the extrauterine environ-ment of the NICU, with a cessation in normal placental growth factors and nutrients that normally are trans-ferred to the fetus in the third trimester. Dyet et al3 reported that there is a significant correlation between DEHSI detected by visual analysis of conventional MRI at term and lower DQ scores, which is supported by this study. In addition, DEHSI is associated with elevated ADC values in the white matter,6and our data provide additional evidence to link higher ADC values with neu-rodevelopmental deficits.
The analysis in this study involved the entire white matter at the level of the centrum semiovale, whereas previous studies focused on smaller ROI. Given the large area under examination, it is unlikely that the inclusion of small sections of cortex would have had a bearing on the mean ADC value. All of the measurements were conducted by the same investigator, and variability was low at⬍1%. The selection of a large amount of white matter might also include some relatively spared areas along with diffusely abnormal areas, which could have lowered the mean ADC values, but it has the advantage of giving an overall view of the white matter at this level. Such diffuse injury could have implications for the con-nectivity of cerebral structures, leading to abnormalities in their development, as has been documented in the cortex of extremely preterm infants at term14,15and also in the thalami of preterm infants imaged at term-equiv-alent age.7It is these abnormalities in connectivity that are likely to underlie the cognitive developmental im-pairments that are observed in survivors of preterm birth.
Histologic examination of diffuse white matter disease in the preterm brain has identified regions of diffuse microgliosis and astrogliosis.16 In a recent study of a primate model of preterm brain development, the most common form of injury observed was diffuse white mat-ter damage, including reactive astrogliosis, activated mi-croglia, and ventricular dilation.17Although we are not aware of any histologic studies correlating this diffuse white matter injury in the human preterm brain to
diffusion imaging characteristics, preliminary DWI stud-ies have shown that elevated ADC values in white mat-ter in a primate premat-term model are associated with gliosis and axonal damage.18
Of interest, we found that ADC values were elevated in the white matter in infants who had a history of postnatal sepsis. Accumulating evidence suggests that the fetal inflammatory response to intrauterine infection is a major determinant of neurodisability, principally through white matter damage.19,20Furthermore, preterm infants who generate an immune response in utero are more likely to develop cerebral lesions on very early MRI.21 The study suggests that cerebral white matter may also be vulnerable to damage from infective causes in the postnatal period. We did not find a relationship with any of the other clinical variables that we could assess. Hypocarbia is another known risk factor for white matter injury in preterm infants22,23; although none of the infants in our study was documented as having significant hypocarbia, our data for this variable are not uniformly comprehensive, and therefore we did not in-clude it in the analysis.
There is growing evidence linking cerebral volumetric changes in the cerebellum, hippocampus, whole brain, caudate nucleus, white matter regions, and cortical gray matter with neurodevelopmental and cognitive impair-ment in children and adolescents who were born pre-term (for review, see Counsell and Boardman24). With the use of three-dimensional volumetric techniques, it has been shown that in a group of preterm infants, there was reduced volume of the deep and cortical gray matter as well as myelinated white matter when compared with term control subjects, and the degree of immaturity was the main predictor of volume of deep nuclear gray mat-ter and CSF.13Lower cortical and white matter volumes were found in preterm infants with white matter lesions when compared with term control subjects.25With the use of deformation-based morphometry, regional tissue contraction was evident in the thalamus and lentiform nucleus in preterm infants at term-equivalent age when compared with term control subjects. The diminished central gray matter volume was most marked in infants with diffuse white matter damage.7
white matter abnormalities. However, DWI at 2 years of age was not available in all of these infants.
There are a number of limitations with this study. The sample size is relatively small, and neurodevelopmental assessment was performed at a relatively young age. Additional studies, with larger infant groups and assess-ments at school age or older, are required to confirm the relationship between elevated ADC values in white mat-ter at mat-term-equivalent age and neurodevelopmental out-come. In addition, the range of corrected ages at imaging and assessment were wide. However, we adjusted for PMA at imaging, and neurodevelopmental assessment was adjusted for the infants’ corrected age.
CONCLUSIONS
The results of this study show a significant negative correlation between mean ADC values in the white mat-ter in premat-term infants with no evidence of focal lesions at term-equivalent age and their neurodevelopmental per-formance as quantified by DQ scores at 2 years’ corrected age. This relationship could not be explained by evi-dence of neurologic deficits from either of the neurologic examinations. We also found significantly higher mean ADC values in infants with a history of sepsis in the early postnatal period. The implications of this study are that (1) higher ADC values are associated with lower DQ scores, (2) ADC values may be of predictive value re-garding neurodevelopmental outcome, and (3) ADC measurement of white matter within the centrum semi-ovale could be used as a surrogate outcome in interven-tional studies that are designed to improve neonatal outcomes after preterm delivery.
REFERENCES
1. Maalouf EF, Duggan PJ, Counsell SJ, et al. Comparison of findings on cranial ultrasound and magnetic resonance imag-ing in preterm infants.Pediatrics.2001;107:719 –727
2. Inder TE, Anderson NJ, Spencer C, Wells S, Volpe JJ. White matter injury in the premature infant: a comparison between serial cranial sonographic and MR findings at term.AJNR Am J Neuroradiol.2003;24:805– 809
3. Dyet LE, Kennea N, Counsell SJ, et al. Natural history of brain lesions in extremely preterm infants studied with serial mag-netic resonance imaging from birth and neurodevelopmental assessment.Pediatrics.2006;118:536 –548
4. Isaacs EB, Lucas A, Chong WK, et al. Hippocampal volume and everyday memory in children of very low birth weight.Pediatr Res.2000;47:713–720
5. Maalouf EF, Duggan PJ, Rutherford MA, et al. Magnetic reso-nance imaging of the brain in a cohort of extremely preterm infants.J Pediatr.1999;135:351–357
6. Counsell SJ, Allsop JM, Harrison MC, et al. Diffusion-weighted imaging of the brain in preterm infants with focal and diffuse white matter abnormality.Pediatrics.2003;112:1–7
7. Boardman JP, Counsell S, Kapellou O, et al. White matter abnormality is associated with volume reduction in deep grey nuclei following preterm birth.Neuroimage.2006;32:70 – 80 8. Huntley M.The Griffiths Mental Development Scales: From Birth to
2 Years. London, United Kingdom: Test Agency Ltd; 1996
9. Frisone MF, Mercuri E, Laroche S, et al. Prognostic value of the neurologic optimality score at 9 and 18 months in preterm infants born before 31 weeks’ gestation.J Pediatr.2002;140: 57– 60
10. Haataja L, Mercuri E, Regev R, et al. Optimality score for the neurologic examination of the infant at 12 and 18 months of age.J Pediatr.1999;135:153–161
11. Huppi PS, Maier SE, Peled S, et al. Microstructural develop-ment of human newborn cerebral white matter assessed in vivo by diffusion tensor magnetic resonance imaging.Pediatr Res.1998;44:584 –590
12. Woodward LJ, Anderson PJ, Austin NC, Howard K, Inder TE. Neonatal MRI to predict neurodevelopmental outcomes in pre-term infants.N Engl J Med.2006;355:685– 694
13. Inder TE, Warfield SK, Wang H, Huppi PS, Volpe JJ. Abnormal cerebral structure is present at term in premature infants.
Pediatrics.2005;115:286 –294
14. Ajayi-Obe M, Saeed N, Cowan FM, Rutherford MA, Edwards AD. Reduced development of cerebral cortex in extremely preterm infants.Lancet.2000;356:1162–1163
15. Kapellou O, Counsell SJ, Kennea N, et al. Abnormal cortical development after premature birth shown by altered allomet-ric scaling of brain growth.PLoS Med.2006;3:e265
16. Haynes RL, Folkerth RD, Keefe RJ, et al. Nitrosative and oxi-dative injury to premyelinating oligodendrocytes in periven-tricular leukomalacia. J Neuropathol Exp Neurol. 2003;62: 441– 450
17. Inder T, Neil J, Kroenke C, Dieni S, Yoder B, Rees S. Investi-gation of cerebral development and injury in the prematurely born primate by magnetic resonance imaging and histology.
Dev Neurosci.2005;27:100 –111
18. Shah DK, Wang HX, Loeliger M, et al. Correlation between water apparent diffusion values and histopathological cerebral white matter changes in fixed tissue from a primate model of premature birth.Proc Int Soc Magn Reson Med.2005;13:1363 19. Dammann O, Kuban KC, Leviton A. Perinatal infection, fetal
inflammatory response, white matter damage, and cognitive limitations in children born preterm.Ment Retard Dev Disabil Res Rev.2002;8:46 –50
20. Hagberg H, Peebles D, Mallard C. Models of white matter injury: comparison of infectious, hypoxic-ischemic, and exci-totoxic insults.Ment Retard Dev Disabil Res Rev.2002;8:30 –38 21. Duggan PJ, Maalouf EF, Watts TL, et al. Intrauterine T-cell
activation and increased proinflammatory cytokine concentra-tions in preterm infants with cerebral lesions.Lancet.2001;358: 1699 –1700
22. Greisen G, Munck H, Lou H. May hypocarbia cause ischaemic brain damage in the preterm infant?Lancet.1986;23;2(8504): 460
23. Okumura A, Hayakawa F, Kato T, et al. Hypocarbia in preterm infants with periventricular leukomalacia: the relation be-tween hypocarbia and mechanical ventilation.Pediatrics.2001; 107:469 – 475
24. Counsell SJ, Boardman JP. Differential brain growth in the infant born preterm: current knowledge and future develop-ments from brain imaging.Semin Fetal Neonatal Med.2005;10: 403– 410
25. Inder TE, Huppi P, Warfield S, et al. Periventricular white matter injury in the premature infant is associated with a reduction in cerebral cortical gray matter volume at term.Ann Neurol.1999;46:775–760
DOI: 10.1542/peds.2006-3054 originally published online August 14, 2007;
2007;120;e604
Pediatrics
Counsell
Allsop, Frances Cowan, A. David Edwards, Mary A. Rutherford and Serena J.
Michelle L. Krishnan, Leigh E. Dyet, James P. Boardman, Olga Kapellou, Joanna M.
Infants at Term-Equivalent Age and Developmental Outcome at 2 Years
Relationship Between White Matter Apparent Diffusion Coefficients in Preterm
Services
Updated Information &
http://pediatrics.aappublications.org/content/120/3/e604 including high resolution figures, can be found at:
References
http://pediatrics.aappublications.org/content/120/3/e604#BIBL This article cites 25 articles, 6 of which you can access for free at:
Subspecialty Collections
sub
http://www.aappublications.org/cgi/collection/fetus:newborn_infant_
Fetus/Newborn Infant following collection(s):
This article, along with others on similar topics, appears in the
Permissions & Licensing
http://www.aappublications.org/site/misc/Permissions.xhtml in its entirety can be found online at:
Information about reproducing this article in parts (figures, tables) or
Reprints
DOI: 10.1542/peds.2006-3054 originally published online August 14, 2007;
2007;120;e604
Pediatrics
Counsell
Allsop, Frances Cowan, A. David Edwards, Mary A. Rutherford and Serena J.
Michelle L. Krishnan, Leigh E. Dyet, James P. Boardman, Olga Kapellou, Joanna M.
Infants at Term-Equivalent Age and Developmental Outcome at 2 Years
Relationship Between White Matter Apparent Diffusion Coefficients in Preterm
http://pediatrics.aappublications.org/content/120/3/e604
located on the World Wide Web at:
The online version of this article, along with updated information and services, is
by the American Academy of Pediatrics. All rights reserved. Print ISSN: 1073-0397.