Copyright Ó 2018 Cognizant, LLC. E-ISSN 1943-4146 www.cognizantcommunication.com
Address correspondence to Dwi Suhartanto, Ph.D., Department of Business Administration, Politeknik Negeri Bandung, Jl. Gegerkalong hilir, Ciwaruga, Bandung,West Java, Indonesia. Tel: +62 82117882409; E-mail: dwi.suhartanto@polban.ac.id
HOW EXPERIENCES WITH CULTURAL ATTRACTIONS AFFECT
DESTINATION IMAGE AND DESTINATION LOYALTY
DWI SUHARTANTO,* MICHAEL D. CLEMES,† AND NONO WIBISONO*
*Department of Business Administration, Politeknik Negeri Bandung, West Java, Indonesia †Faculty of Agribusiness and Commerce, Lincoln University, Lincoln, New Zealand
The components and consequences of cultural attraction experiences have received little attention in the extant literature. This research is designed to close this gap by empirically analyzing the effect of the cultural attraction experience on tourist satisfaction, destination image, and loyalty toward the destination. Data were gathered from 331 tourists at four traditional cultural attractions in Indonesia. The percipients were selected using purposive sampling. This research specifies that the experi-ence quality of cultural attraction consists of four dimensions: staff service, uniqueness and learning, peace of mind, and escapism. The results of the SEM-PLS analysis demonstrate that, among the dimensions, uniqueness and learning and the escapism factors are important determinants of overall experience quality. Further, experience quality is a significant driver of tourist satisfaction, the image of the destination, and tourist loyalty towards the destination. The research model and the findings provide practitioners and academics with an improved understanding of the cultural attraction experi-ence and its consequexperi-ences.
Key words: Cultural attraction; Experience quality; Tourist satisfaction; Destination image, Destination loyalty
Introduction
Cultural tourism is a promising tourism sector and is increasingly popular in the global tourism market (United Nations World Tourism Organiza-tion [UNWTO], 2015). This sector has an important effect on the development of a community’s social, economic, and cultural environment (Mansour & Ariffin, 2017). In addition, cultural attractions have
become an important element in establishing tour-ism destination attractiveness (H. Kim, Cheng, & O’Leary, 2007). As a consequence, ample studies have been conducted in various cultural attractions. However, research exploring the impact of tourists experience with cultural attractions on their suc-ceeding behavior on tourism destination is sparse.
factors in achieving a competitive advantage for a destination (Cong, 2016; Zhang, Fu, Cai, & Lu, 2014). Several researchers have explored how tour-ists experience affect their image and loyalty towards the destination (Chi & Qu, 2008; Stylos, Vassiliadis, Bellou, & Andronikidis, 2016; Suhartanto, Ruhadi, & Triyuni, 2016). However, to date, limited studies have explored how the cultural attraction drives the tourist image of the destination and the tourist loy-alty towards the destination. Successfully designed, managed, and marketed tourist experiences are criti-cal determinants of the selection of a destination in a highly competitive tourism marketplace (Dodds & Jolliffe, 2016). Thus, empirically examining how the experiences of tourists with cultural attractions impact on destination image and destination loyalty will help close an important research gap.
This research has three objectives: (1) to evaluate the experience quality dimension of cultural attrac-tions, (2) to assess the effect of experience quality on tourist satisfaction, destination image, and des-tination loyalty, and (3) to examine the mediation effect of tourist satisfaction with the cultural attrac-tion on the associaattrac-tion between experience qual-ity and destination image and destination loyalty. Satisfying these objectives will make a theoretical contribution to the literature on cultural tourism attractions as it will provide a framework for fu-ture research in this burgeoning area. Further, this research will provide an improved understanding of the impact of tourists’ experiences with cultural attractions and offer insights into their subsequent behavior towards the tourist destination.
Conceptual Review
Experience Quality on Cultural Attraction
A cultural attraction is a performance designed to provide information and experiences in order to satisfy tourists’ cultural needs (McKercher, Ho, & du Cros, 2004; Richards, 2001). Recent devel-opment in tourism industry shows that the attrac-tion that offers tourists opportunities to join in the performance provides feeling of a high personal involvement (Ali, Ryu, & Hussain, 2016; Tan, Kung, & Luh, 2013) and fascinate tourist interest to the attraction (Dodds & Jolliffe, 2016). Lemke and col-leagues (2011) considered customer experience as
a personal reaction to the whole encounter with the attraction service provider. This conceptualiza-tion implies that tourist experience with cultural attraction consists not only consumption during the attraction service encounter but also the communi-cation and interaction encounter between the tour-ist and the attraction service providers. Thus, as a service experience offering, the ability of cultural attraction providers to provide a high experience quality beyond tourist expectation is imperative.
To attract and satisfy customers, Pine and Gilmore (1998) suggested that the service provider should offer a dramatic experience such as a theater per-formance. Deshwal (2016) reported the importance of customer emotion and conation of the experience on their subsequent behavior. Chang, Backman, and Huang (2014) revealed that if customers expe-rience a favorable outcome and are satisfied with attraction performance, they tend to revisit the at-traction. Similarly, Gnoth (1997) pointed out that customer response to an experience is an important factor of customer postconsumption behaviors such as customers intention to endorse and to return to the attraction. Hosany and Witham (2009) explored cruisers’ experiences and concluded that customer experiences are associated with the customer inten-tion to endorse their cruiser experience to others. Several studies support the link between customer experience quality and the subsequent behavior of customers in various tourism attractions (H. Kim et al., 2007; Mansour & Ariffin, 2017; McKercher et al., 2004).
the experience. This conceptualization is compa-rable with Pine and Gilmore’s (1998) concept of educational experience. Although the dimensions of experience quality have been explored in many tourism contexts, no prior research identified has examined experience quality in the context of cul-tural attraction.
Tourist Satisfaction
Satisfaction is a subjective evaluation of the product or service performance after consumption is compared to the prior expectation (Suhartanto, Dean, Sosianika, & Suhaeni, 2018). When the per-ceived attraction performance is higher than the expectation, the customer is satisfied. There are several definitions of the satisfaction construct. However, most of these definitions acknowledge that customer satisfaction is a complex construct, which includes cognitive, affective, and psycho-logical and physiopsycho-logical dynamics. The literature suggests that service delivery affects customer sat-isfaction, and customer satisfaction affects post-consumption behaviors (Chi & Qu, 2008; Hapsari, Clemes, & Dean, 2017). Tourists satisfied with their attraction visit may intend to revisit the desti-nation in the future, endorse the destidesti-nation to other potential customers, and voice positive remarks about the tourist destination. In contrast, tourists who are dissatisfied with their attraction visit are less likely to revisit the destination or recommend the destination to others. Disappointed tourists may also voice unfavorable remarks about the tourist destination that can spoil the reputation of the des-tination (Suhartanto et al., 2018).
Destination Image
Destination image is an important factor in tour-ism marketing. Destination image plays a major role in decision making and subsequent tourist behav-ior (Pike, 2002) and this factor has been explored extensively in the literature. Echtner and Ritchie (1991) defined destination image as one’s percep-tion of the attributes and the whole of a destinapercep-tion. Image is an overall impression, idea, belief, feeling, and hope about a destination that is gathered in a given period. The customer experience in consum-ing the service and the firm’s promotional efforts
such as public relations and advertising shape the consumer image of a destination (Dobni & Zinkhan, 1990). In addition, the consumer image of a des-tination is also influenced by other factors such as events, persons, or the country where the des-tination is located (Suhartanto, 2017). Dobni and Zinkhan (1990) asserted that image is affected by the interconnection between the image determinant factors, both factually and psychologically. Among the determinants, the most important is a tourist’s direct experience with the service or product at the destination (Zhang et al., 2014). Thus, it is expected that a tourist’s experience with the cultural attrac-tions in a tourism destination will affect their image of the destination.
Destination Loyalty
An important objective of marketing is to cre-ating and maintaining customer loyalty towards a product or service. Customer loyalty has been con-ceptualized and analyzed in a plethora of research, including several studies in a tourism context. There are two main approaches used to examine loyalty: behavioral and attitudinal (Hapsari et al., 2017). The behavioral approach conceptualizes loyalty as a behavior. Only consumers who purchase a prod-uct/service systematically within a particular period are considered loyal customers. Behavioral loyalty is criticized as it does not differentiate a truly loyal customer from those customers who consume for cost or convenience reasons only (Odin, Odin, & Valette-Florence, 2001). The attitude approach conceptualizes loyalty as an attitude. In the con-text of tourism, attitudinal loyalty is described as a psychological expression of tourists’ willingness to revisit in the future and to endorse the destination to others (Suhartanto et al., 2016). The use of the attitudinal approach is popular because of its ability to allow researchers to uncover the strength of cus-tomer loyalty toward a brand from extremely loyal to extremely disloyal (Odin et al., 2001).
Hypothesis Development
Dimension and Overall Experience Quality
(Zeithaml, 1988). At the attribute level, quality refers to the feature of a single element of the ser-vice. In contrast, the overall level of quality denotes the summary assessment of the service consump-tion. Although attribute-level quality and overall quality differ, they are related. The global level of quality is the function of attribute level of quality (Zeithaml, 1988) and is considered to be a more relevant and meaningful predictor of subsequent consumer behaviors such as customer satisfaction and customer loyalty (Fernandes & Cruz, 2016). Researchers distinguish between the overall quality and the attribute level of quality as each level of the attribute frequently has an effect on overall quality (Chi & Qu, 2008). Research on attraction tourism illustrates that different attributes of quality have a different impact on the overall quality of the attrac-tion (Fernandes & Cruz, 2016). Thus, in cultural attraction, overall experience quality is expected to be a function of the experience with the dimensions of the attraction attributes.
H1: The cultural attraction experience dimensions have a positive effect on experience quality.
The Effect of Experience Quality
The Theory of Tourism Consumption System (Woodside & Dubelaar, 2002) deals with “the set of related travel thoughts, decisions, and behaviours by a discretionary traveller prior to, during, and following a trip” (p. 120). This theory considers a leisure activity as a multifaced system consisting of many elements, such as the background of travelers, traveler behavior in previous trips, decision mak-ing, and the behavior related to the trip. Woodside and Dubelaar (2002) explained that travelers’ opin-ions, choices, and their behavior regarding the trav-eling elements are dependent on each other. Based on these assumptions, they suggest a sequence of relationships between these elements, both directly and indirectly. Li and colleagues (2013) supported the fundamental proposition of this theory.
Woodside and Dubelaar’s (2002) theory is rel-evant in explaining the link between tourist experi-ence with the cultural attraction and their satisfaction with the attraction, the image of the destination, and loyalty towards a destination. Based on this theory, as experience with attraction is one of the tourist
experiences in the destination, tourist’s assessment of their experience with the attraction impacts not only their level of satisfaction but also their image of the destination and their loyalty towards the des-tination. In the context of cultural attractions, it is expected that tourists who experience a high-quality attraction will be more satisfied, have a better image of the destination, and intend to be loyal towards the destination where the attraction is located.
H2: Experience quality has a significant influence on tourist satisfaction.
H3: Experience quality has a significant influence on destination image.
H4: Experience quality has a significant influence on destination loyalty.
Mediation Role of Tourist Satisfaction
Destination image is an important construct in marketing as it influences tourist decision making and their subsequent behavior (Pike, 2002). The literature indicates that among the image determi-nants, the most important factor is arguably a trav-eler’s’ experience with the service and product in a destination. The literature on tourism highlights that experience with service mainly influences tour-ist satisfaction with the destination (Cong, 2016). Therefore, in the cultural attraction context, a tourist who perceives that the attraction is interesting will be satisfied with the attraction and subsequently perceive a favorable image of the destination. As one of the main reasons for a tourist visit is to expe-rience the attraction, it is expected that the tourist satisfaction with the attraction will influence their perception of the destination. Therefore, tourist sat-isfaction with the cultural attraction is expected to play a mediating role between experience quality and the image of the destination.
H5: Tourist satisfaction mediates the relationship between experience quality and destination image.
hospitality and tourism has discussed the associa-tion between tourist satisfacassocia-tion and tourist loyalty toward the attraction and the destination (Dodds & Jolliffe, 2016; Suhartanto et al., 2016). The find-ings in these past studies support the positive con-sequences of tourist satisfaction on tourist loyalty. A tourist experience with the performance of the cultural attraction first increases their satisfaction toward the attraction, leading to an increase in loy-alty toward the destination.
H6: Tourist satisfaction mediates the relationship between experience quality and destination loyalty.
The conceptual research model is shown in Figure 1.
Research Method
Research Instrument
The research variables of this study have been widely discussed in the literature. Thus, as shown in Table 1, the measurement construct scales were developed based on the existing literature. Expe-rience quality refers to the tourists’ psychological response to the outcome of the performance they experienced during a visit to a cultural attraction. Five dimensions were generated from the existing literature on experience quality. Escape refers to an affective reaction such as enjoyment, excitement,
and memorability (Pine & Gilmore, 1998). Peace of mind denotes the customer needs of safety and comfort, physical, and psychological (Otto & Ritchie, 1996). Involvement refers to a customer’s need to control and choose the service offering, notified and instilled with a sense of mutual coop-eration (Binkhorst, 2007). Recognition signifies the feeling of confidence and importance while consumers are consuming the attraction (Otto & Ritchie, 1996). Learning means the tourist experi-ence with the knowledge and skill gained from the attraction (Ali et al., 2016).
All the measurement items for experience qual-ity, destination image, and destination loyalty were based on a 5-point Likert scale (1 = strongly disagree
to 5 = strongly agree). Tourist satisfaction with the attraction was measured on a 5-point semantic differential scale, “dissatisfied” to “satisfied” and “terrible” to “pleased” (Xu & Chan, 2010). Prior to pretesting, the questionnaire was reviewed by three tourism academics in order to ensure the appropri-ateness of the survey instrument. To ensure that the questionnaire is well understood, a pretest was con-ducted on 20 cultural attraction visitors, resulting in minor adjustments on the questionnaire wordings.
Sample and Data Collection
The data were collected from four traditional cul-tural attractions in Bandung City during February and March 2017. The traditional Sundanese culture attractions are: dancing, crafting puppet, playing
music assembly, and participating in traditional games. These attractions were selected as they were designed to enable the visitors (both tourists and residents) to be involved in the attractions. As this study focuses on tourist, the purposive sampling method was used in this research. Cultural attraction visitors were given a self-administered question-naire at the end of the show. Of the 398 participating visitors that received the questionnaire, 331 ques-tionnaires were complete. Thus, the requirements of using structural equation modeling were met, 10 respondents minimum for each survey instrument item. Additionally, the requirement of a 322 sample size for a 95% confidence level and ±5% margin of error as recommended by Zikmund and colleagues (2013) was also fulfilled.
Data Analysis
To assess the dimensionality of experience qual-ity, exploratory factor analysis was performed as recommended by Hair, Black, Babin, and Anderson (2010). The validity and reliability of the scale mea-surement constructs were examined by applying confirmatory factor analysis using partial least squares (PLS)-based SEM. This method was also used to verify the proposed model. PLS enables a researcher to assess latent constructs using a small and medium sample size and nonnormality distrib-uted data (Chin, Peterson, & Brown, 2008). Addi-tionally, SEM-PLS is a noted technique to estimate coefficient paths in structural models (Hair, Hult, Ringle, & Sarstedt, 2014).
Results
Of the 331 respondents, 318 were domestic tour-ists and 13 were foreign tourtour-ists. The demographic characteristics of the respondents are shown in Table 2.
Experience Quality Dimension
As shown in Table 1, the initial list of items consists of 24 items reflecting five dimensions of experience quality with cultural attraction. The dimensions of this quality were examined using exploratory factor analysis (EFA) with principal component analysis used as the extraction method. A varimax rotation with Kaiser Normalization was
Table 2
Demographic Characteristics of the Respondents
Variable/Description Frequency
Gender
Male 152 (46%)
Female 179 (54%)
Age
17–25 years 245 (74%) 26–35 years 33 (10%) 36–45 years 23 (7%) >45 years 30 (9%)
Highest education level
<High school 139 (42%) High school 86 (26%) Bachelor/diploma 92 (28%) Postgraduate 10 (3%)
Table 1
Measurement Scale and Literature Sources
Construct Sources
1. Experience quality
Escape Binkhorst (2007); Pine and Gilmore (1998); Richards and Wilson (2004) Peace of mind Chen and Chen (2010); Otto and Ritchie (1996); Xu and Chan (2010)
Involvement Binkhorst (2007); Hung et al. (2016); McIntosh and Zahra (2007); McKercher et al. (2004); Pine and Gilmore (1998)
Recognition Ali et al. (2016); Otto and Ritchie (1996); Xu and Chan (2010)
Learning Hung et al. (2016); McKercher et al. (2004); Richards (2002); Richards and Wilson (2004) 2. Experience quality Chang et al. (2014); Mansour and Ariffin (2017); McKercher et al. (2004)
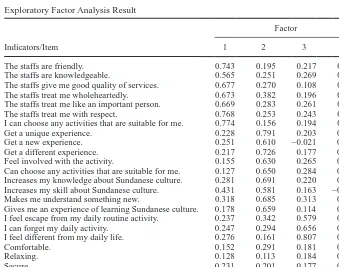
applied as suggested by Hair et al. (2010). The results indicate that the 23 items could be grouped into four factors. These four factors cover 61.17% of the variance. The first factor consists of seven items related to staff ability to deliver expected service, termed “Staff service,” The second fac-tor consists of four items reflecting the uniqueness of the attraction and the learning experience dur-ing the visit, termed “Uniqueness and learndur-ing.” The third factor has four items related to comfort, relaxation, privacy, and security, termed “Peace of mind.” Factor 4 comprises three items represent-ing escape from daily life and difference from daily activity, termed “Escape.” The loadings of all items, except for item “I feel the location is easy to access,” were more than 0.4, thus this item was not included in the subsequent analyses. All four dimensions identified have a Cronbach’s alpha value above 0.80, confirming the reliability of the identified dimensions (Hair et al., 2010). The result of Kaiser–Meyer–Olkin test (0.924) and Bartlett’s
test of sphericity (p < 0.01) support the sampling adequacy and reliability of the constructs.
Table 3 shows that the loading value of each item on its construct is greater than the loading factor on the other constructs, satisfying the requirement of the discriminant validity of the experience quality dimension identified.
Measurement Model
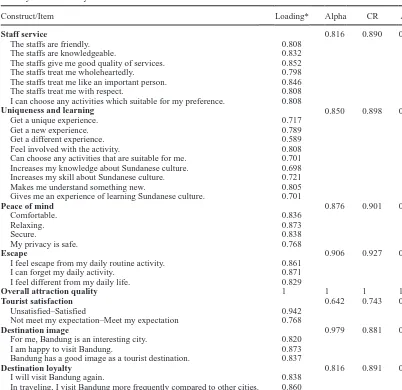
Two stages of examination were used to assess the proposed model. The first stage examined the measurement model by evaluating the outer load-ing. Composite reliability (CR), Cronbach’ alpha, and average variance extracted (AVE) were used to assess the discriminant and convergent validity and the construct reliability. Table 4 shows that the requirement for discriminant validity was satis-fied as indicated by factor loadings exceeding 0.6, CR values more than 0.7, and AVE’ higher that 0.5 (Hair et al., 2010).
Table 3
Exploratory Factor Analysis Result
Indicators/Item
Factor
1 2 3 4
The staffs are friendly. 0.743 0.195 0.217 0.183
The staffs are knowledgeable. 0.565 0.251 0.269 0.133 The staffs give me good quality of services. 0.677 0.270 0.108 0.264 The staffs treat me wholeheartedly. 0.673 0.382 0.196 0.130 The staffs treat me like an important person. 0.669 0.283 0.261 0.220 The staffs treat me with respect. 0.768 0.253 0.243 0.174 I can choose any activities that are suitable for me. 0.774 0.156 0.194 0.126
Get a unique experience. 0.228 0.791 0.203 0.186
Get a new experience. 0.251 0.610 −0.021 0.396
Get a different experience. 0.217 0.726 0.177 0.215 Feel involved with the activity. 0.155 0.630 0.265 0.259 Can choose any activities that are suitable for me. 0.127 0.650 0.284 0.263 Increases my knowledge about Sundanese culture. 0.281 0.691 0.220 0.067 Increases my skill about Sundanese culture. 0.431 0.581 0.163 −0.003 Makes me understand something new. 0.318 0.685 0.313 0.022 Gives me an experience of learning Sundanese culture. 0.178 0.659 0.114 0.068 I feel escape from my daily routine activity. 0.237 0.342 0.579 0.256 I can forget my daily activity. 0.247 0.294 0.656 0.237 I feel different from my daily life. 0.276 0.161 0.807 0.174
Comfortable. 0.152 0.291 0.181 0.722
Relaxing. 0.128 0.113 0.184 0.796
Secure. 0.231 0.201 0.177 0.734
My privacy is safe. 0.371 −0.004 0.243 0.472
Henseler, Ringle, and Sarstedt (2015) pro-posed HTMT to assesses discriminant validity. The requirement of discriminant validity among the constructs are satisfied as none of the value of HTMT are higher than 0.9 as shown in Table 5 (Henseler et al., 2015). The reliability test indicates construct reliability as the majority of the variables Cronbach’s alpha values are above the suggested level of 0.7. Only one variable has a value of 0.642, still above the minimal level suggested by (Hair et al., 2010).
Structural Model
The testing of the structural model and hypoth-eses stated were conducted using SmartPLS 3.0. Bootstrapping with 5,000 iterations was used to assess the statistical significance of the weight of the construct indicators and the coefficient of the paths to test the structural model (Chin et al., 2008). The geometric mean of average communality and the R2
were used to assess the model fit (Tenenhaus, Esposito, Chatelin, & Laura, 2005). As shown in Table 4
Validity and Reliability of the Constructs
Construct/Item Loading* Alpha CR AVE
Staff service 0.816 0.890 0.729
The staffs are friendly. 0.808
The staffs are knowledgeable. 0.832
The staffs give me good quality of services. 0.852 The staffs treat me wholeheartedly. 0.798 The staffs treat me like an important person. 0.846
The staffs treat me with respect. 0.808
I can choose any activities which suitable for my preference. 0.808
Uniqueness and learning 0.850 0.898 0.689
Get a unique experience. 0.717
Get a new experience. 0.789
Get a different experience. 0.589
Feel involved with the activity. 0.808
Can choose any activities that are suitable for me. 0.701 Increases my knowledge about Sundanese culture. 0.698 Increases my skill about Sundanese culture. 0.721 Makes me understand something new. 0.805 Gives me an experience of learning Sundanese culture. 0.701
Peace of mind 0.876 0.901 0.535
Comfortable. 0.836
Relaxing. 0.873
Secure. 0.838
My privacy is safe. 0.768
Escape 0.906 0.927 0.679
I feel escape from my daily routine activity. 0.861
I can forget my daily activity. 0.871
I feel different from my daily life. 0.829
Overall attraction quality 1 1 1 1
Tourist satisfaction 0.642 0.743 0.605
Unsatisfied–Satisfied 0.942
Not meet my expectation–Meet my expectation 0.768
Destination image 0.979 0.881 0.711
For me, Bandung is an interesting city. 0.820
I am happy to visit Bandung. 0.873
Bandung has a good image as a tourist destination. 0.837
Destination loyalty 0.816 0.891 0.731
I will visit Bandung again. 0.838
In traveling, I visit Bandung more frequently compared to other cities. 0.860 I will recommend my friends/family to visit Bandung. 0.866
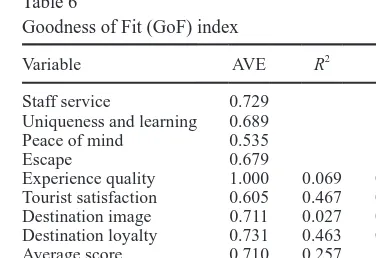
Table 6, the GOF of the model has a value of 0.427 indicating that the model fit is satisfactory, above the recommended level of a good fit of 0.36 (Tenenhaus et al., 2005).
R2
indicates the explanation power of the predic-tor’s variable on each construct. The four dimen-sion of experience quality explain 6.9% of overall experience quality (R2
= 0.069%). Overall experi-ence quality explains 46.7% of tourist satisfaction (R2
= 0.467). Experience quality and tourist satisfac-tion explain 2.7% of destinasatisfac-tion image (R² = 0.027) and destination loyalty 46.3% (R² = 0.463). Chin et al. (2008) classified the R2
into three groups: weak (R2
= 0.19), moderate (R2
= 0.33), and sub-stantial (R2
= 0.76). This guideline indicates that experience quality and destination image are weak, while tourist satisfaction and destination loyalty are between moderate and substantial. To assess the predictive relevance the construct, Chin et al. (2008) recommended using the predictive sample reuse technique (Q2
). Q2
indicates whether the data can be empirically restructured by means of the model and the parameter of PLS. Table 7 shows that the Q2
of all of the constructs assessed are above the cut off level and have a positive value (Chin et al., 2008). Thus, all of the constructs have an acceptable predictive relevance.
The results of the hypotheses test are shown in Table 7. Among the four dimensions of experience quality, the dimension of uniqueness and escape significance affect overall experience quality, while the effect of staff service and peace of mind are not significant (Fig. 2). Thus, H1 is partially sup-ported. As expected, the experience quality has a significant effect on tourist satisfaction, destination
image, and destination loyalty. Thus, H2, H3, and H4 are supported.
Mediation Analysis
H5 and H6 hypothesize that tourist satisfaction is a mediator on the association between over-all experience quality and destination image and destination loyalty. To test these hypotheses, a path coefficient comparison values of the models was assessed as recommended by Baron and Kenny (1986) by comparing three different model runs using SmartPLS 3.0. The result of assessing the path between tourist satisfaction and destina-tion image (β = 0.030) is not significant (p > 0.05). Thus, there is no validation for the satisfaction’s mediating role between experience quality and destination image and therefore H5 is rejected. In terms of tourist satisfaction’s mediation role on the relationship between experience quality and Table 5
Heterotrait–Monotrait Ratio (HTMT)
1 2 3 4 5 6 7
1. Staff service
2. Uniqueness and learning 0.564
3. Peace of mind 0.541 0.751
4. Escape 0.506 0.709 0.771
5. Tourist satisfaction 0.405 0.272 0.242 0.259
6. Destination image 0.338 0.440 0.442 0.484 0.165
7. Destination loyalty 0.324 0.480 0.427 0.530 0.210 0.813
8. Attraction quality 0.199 0.241 0.150 0.228 0.599 0.183 0.296
Table 6
Goodness of Fit (GoF) index
Variable AVE R2 Q2
Staff service 0.729 Uniqueness and learning 0.689 Peace of mind 0.535
Escape 0.679
Experience quality 1.000 0.069 0.052 Tourist satisfaction 0.605 0.467 0.256 Destination image 0.711 0.027 0.017 Destination loyalty 0.731 0.463 0.315 Average score 0.710 0.257
AVE × R2 0.182
destination loyalty, the tested model shows that all of the paths between experience quality and desti-nation loyalty (β = 0.269), experience quality and tourist satisfaction (β = 0.683), and tourist satisfac-tion and destinasatisfac-tion loyalty (β = 0.311) are posi-tive and significant. Finally, the Sobel test of the mediating role of tourist satisfaction has a value of 3.452 (p < 0.01). This result indicates a media-tion role of tourist satisfacmedia-tion on the relamedia-tionship between experience quality and destination loy-alty. Thus, H6is supported.
Discussion and Implication
The findings in this study demonstrate that the experience quality instrument is a reliable and valid
measure for cultural attractions. The dimension of experience quality is delineated in a cultural con-text and consists of four dimensions: staff service, uniqueness and learning, peace of mind, and escape. The results are important as this is the first empirical research that identifies a valid and reliable scale for measuring tourists’ perceptions of creative experi-ences in the context of a cultural attraction. From a theoretical perspective, the cultural attraction instrument to measure experience quality devel-oped for this study will motivate further empirical research on the effect of tourist experience with tra-ditional cultural attraction and its outcomes. Salient tourist emotions such as memories and happiness should be assessed in other contexts of the cultural tourism industry.For example, the experience qual-ity scale used in this study can be applied to other Table 7
Structural Estimates
Path β t-Statistic
Staff service→Attraction quality 0.090 1.665 Uniqueness and learning→Attraction quality 0.149 2.322* Peace of mind→Attraction quality −0.089 1.110 Escape→Attraction quality 0.148 2.359* Experience quality→Tourist satisfaction 0.683 8.486** Experience quality→Destination image 0.185 2.519* Experience quality→Destination loyalty 0.194 3.102** Tourist satisfaction→Destination image −0.032 0.430 Tourist satisfaction→Destination loyalty −0.043 0.706
*Significant at p < 0.05; **significant at p < 0.01.
traditional cultural attractions or to contemporary culture attractions.
The dimension of uniqueness and learning and escape are significant predictors of overall expe-rience quality. Contextually, H. S. Kim and Choi (2016) reported that local culture and hedonism had the potential to encourage tourist intentions to revisit the destination. Further, Hung et al. (2016) reported that uniqueness of the attraction makes the experience with the attraction performance memorable. However, the findings of this study illustrate that the factors of uniqueness and learn-ing and escape are the imperative factors that will make tourist experiences particularly satisfying. The critical aspects of uniqueness and learning highlight the concept of educational experiences in tourist-seeking behavior (Ali et al., 2016; Pine & Gilmore, 1998). Tourists try to fulfil their need of inventive learning through a cultural experience. The importance of the escapism factor suggests that tourists consider the enjoyment and excitement of the attraction as the main elements they seek from the cultural attraction.
The results of this study signify that cultural experience was a significant predictor of tour-ist satisfaction and their image of the destination and loyalty toward the destination. Although past research reveals the effect of attraction experience on intention to recommend and revisit the attrac-tion (Ali et al., 2016; Chen & Chen, 2010; Hung et al., 2016; Tan et al., 2013), the findings in this study extend the understanding of the experience of the attraction and its impacts on how tourist perceive the destination and whether tourists will revisit and recommend the destination to others. A tourist who experiences a high quality cultural attraction will not only revisit and recommend the attraction but also tend to have a better image of the destination and an intention to revisit and recom-mend the destination where the cultural attraction is located. This finding contributes to the extant lit-erature as rarely previous scholars have explored this issue. Theoretically, this finding provides more evidence confirming the strength of tourism con-sumption system theory, which postulates that the experience with a cultural attraction in a destination will impact on tourist perceptions and their behav-ior towards other attractions in the destination and towards the destination itself.
This study provides several implications for managing the cultural attraction business. First, the cultural attraction managers need to deliver unique-ness in every detail of the attraction. The manag-ers should innovate their attraction performances to ensure continuing uniqueness. Second, due to the importance of tourists’ participation in learning experiences, cultural attraction managers must cre-ate attractions that enable tourists to learn something new from each attraction performance. Managers should offer tourists an opportunity to develop their own learning preferences rather than providing a ready-made learning package so they can obtain a suitable learning experience. Third, providers of cultural attractions need to fulfil the tourist require-ment for escapism. To meet this need, attraction managers may provide tourists with traditional cos-tumes so they can enjoy and participate in the cul-tural attraction performance. Last, a high quality of cultural attractions is important, not only to satisfy visitors, but also to create a good destination image and to attract new visitors to the destination. Thus, collaboration between cultural attraction managers and destination managers in terms of promoting the attraction and providing safe environment for the destination is necessary.
Conclusion
Limitations and Future Research
Although this study has extended our understand-ing on the cultural attraction, generalizunderstand-ing the find-ings of this study must be done with caution due to cultural differences and variations in attractions. The experience-destination model should also be tested in different locations and for different cultural locations. This research focuses on the experience quality of the cultural attraction and its consequences on tourist behavior towards a destination. There are many factors impacting on tourist experiences with tourist attraction that are not included in this study, such as prior experience, demographic factors, and motivation. Researchers should consider including these factors in extending the model of the tourist experience with cultural attraction. Similarly, many other consequential factors of experience quality were not included in this study such as trust, per-ceived value, benefit of visiting, and life happiness. These factors should be examined in order to make the model of attraction experience and destination behavior more comprehensive.
References
Ali, F., Ryu, K., & Hussain, K. (2016). Influence of expe-riences on memories, satisfaction and behavioral inten-tions: A study of creative tourism. Journal of Travel & Tourism Marketing, 33(1), 85–100.
Baron, R. M., & Kenny, D. A. (1986). The moderator- mediator variable distinction in social psychological research: Conceptual, strategic, and statistical consid-erations. Journal of Personality and Social Psychology, 51(6), 1173–1182.
Binkhorst, E. (2007). Creativity in tourism experiences: The case of Sitges. In G. Richards & J. Wilson (Eds.), Tour-ism, creativity and development (pp. 125–144). London, UK: Routledge.
Chang, L.-L., Backman, K. F., & Huang, Y.-C. (2014). Cre-ative tourism: A preliminary examination of creCre-ative tourists’ motivation, experience, perceived value and revisit intention. International Journal of Culture, Tour-ism and Hospitality Research, 8(4), 401–419.
Chen, C.-F., & Chen, F.-S. (2010). Experience quality, per-ceived value, satisfaction and behavioral intentions for heritage tourists. Tourism Management, 31(1), 29–35. Chi, C. G., & Qu, H. (2008). Examining the structural
rela-tionships of destination image, tourist satisfaction and destination loyalty: An integrated approach. Tourism Management, 29(4), 624–636.
Chin, W. W., Peterson, R. A., & Brown, S. P. (2008). Struc-tural equation modeling in marketing: Some practical
reminders. Journal of Marketing Theory and Practice, 16(4), 287–298.
Cong, L. C. (2016). A formative model of the relationship between destination quality, tourist satisfaction and inten-tional loyalty: An empirical test in Vietnam. Journal of Hospitality and Tourism Management, 26, 50–62. Deshwal, P. (2016). Customer experience quality and
demo-graphic variables (age, gender, education level, and family income) in retail stores. International Journal of Retail & Distribution Management, 44(9), 940–955.
Dobni, D., & Zinkhan, G. M. (1990). In search of brand image: A foundation analysis. Advances in Consumer Research, 17, 110–119.
Dodds, R., & Jolliffe, L. (2016). Experiential tourism: Cre-ating and marketing tourism attraction experiences. In M. Sotiriadis & D. Gursoy (Eds.), The handbook of managing and marketing tourism experiences (pp. 113– 129). Bingley, UK: Emerald Insight.
Echtner, C. M., & Ritchie, J. R. (1991). The meaning and measurement of destination image. Journal of Tourism Studies, 2(2), 2–12.
Fernandes, T., & Cruz, M. (2016). Dimensions and outcomes of experience quality in tourism: The case of Port wine cellars. Journal of Retailing and Consumer Services, 31, 371–379.
Gnoth, J. (1997). Tourism motivation and expectation for-mation. Annals of Tourism Research, 24(2), 283–304. Hair, J. F., Hult, G. T., Ringle, C. M., & Sarstedt, M. (2014).
A primer on partial least squares structural equation modeling (PLS-SEM). Los Angeles, CA: Sage.
Hair, J. F., Black, W. C., Babin, B. J., & Anderson, R. E. (2010). Multivariate data analysis: A global perspective
(7th ed.). Upper Saddle River, NJ: Pearson Education. Hapsari, R., Clemes, M. D., & Dean, D. (2017). The impact
of service quality, customer engagement and selected marketing constructs on airline passenger loyalty. Inter-national Journal of Quality and Service Sciences, 9(1), 21–40.
Henseler, J., Ringle, C. M., & Sarstedt, M. (2015). A new criterion for assessing discriminant validity in variance-based structural equation modeling. Journal of the Acad-emy of Marketing Science, 43(1), 115–135.
Hosany, S., & Witham, M. (2009). Dimensions of cruisers’ experiences, satisfaction, and intention to recommend.
Journal of Travel Research, 49(3), 351–364.
Hung, W.-L., Lee, Y.-J., & Huang, P.-H. (2016). Creative experiences, memorability and revisit intention in creative tourism. Current Issues in Tourism, 19(8), 763–770. Kim, H., Cheng, C.-K., & O’Leary, J. T. (2007).
Understand-ing participation patterns and trends in tourism cultural attractions. Tourism Management, 28(5), 1366–1371. Kim, H. S., & Choi, B. (2016). The effects of three
contexts using repertory grid technique. Journal of the Academy of Marketing Science, 39(6), 846–869. Li, X., Li, X., & Hudson, S. (2013). The application of
gen-erational theory to tourism consumer behavior: An Amer-ican perspective. Tourism Management, 37, 147–164. Mansour, J. S. A., & Ariffin, A. A. M. (2017). The effects
of local hospitality, commercial hospitality and experi-ence quality on behavioral intention in cultural heritage tourism. Journal of Quality Assurance in Hospitality & Tourism, 2, 149–172.
McIntosh, A. J., & Zahra, A. (2007). A cultural encounter through volunteer tourism: Towards the ideals of sus-tainable tourism? Journal of Sustainable Tourism, 15(5), 541–556.
McKercher, B., Ho, P. S. Y., & du Cros, H. (2004). Attributes of popular cultural attraction in Hong Kong. Annals of Tourism Research, 31(2), 393–407.
Odin, Y., Odin, N., & Valette-Florence, P. (2001). Conceptual and operational aspects of brand loyalty: An empirical investigation. Journal of Business Research, 53(2), 75. Otto, J. E., & Ritchie, J. R. B. (1996). The service experience
in tourism. Tourism Management, 17(3), 165–174. Pike, S. (2002). Destination image analysis review of 142
papers from 1973 to 2000 Tourism Management, 23(5), 541–549.
Pine, B. J., & Gilmore, J. H. (1998). Welcome to the experi-ence economy. Harvard Business Review (July–August), 97–105.
Richards, G. (2001). The market for cultural attractions. In G. Richards (Ed.), Cultural attractions and European tourism. Oxon, UK: CABI Publishing.
Richards, G. (2002). Tourism attraction systems: Exploring cultural behavior. Annals of Tourism Research, 29(4), 1048–1064.
Richards, G., & Wilson, J. (2004). The impact of cultural events on city image: Rotterdam, cultural capital of Europe 2001. Urban Studies, 41(10), 1931–1951. Stylos, N., Vassiliadis, C. A., Bellou, V., & Andronikidis, A.
(2016). Destination images, holistic images and personal normative beliefs: Predictors of intention to revisit a desti-nation. Tourism Management, 53, 40–60.
Suhartanto, D. (2017). The role of store coopetition and attractiveness on the performance of tourism destination and its retail stores. International Journal of Tourism Policy, 7(2), 151–165.
Suhartanto, D., Dean, D., Sosianika, A., & Suhaeni, T. (2018). Food souvenirs and their influence on tourist sat-isfaction and behavioural intentions. European Journal of Tourism Research, 18, 133–145.
Suhartanto, D., Ruhadi, & Triyuni, N. (2016). Tourist loy-alty towards shopping destination: The role of shopping satisfaction and destination image. European Journal of Tourism Research, 13, 84–102.
Tan, S.-K., Kung, S.-F., & Luh, D.-B. (2013). A model of “creative experience” in creative tourism. Annals of Tourism Research, 41, 153–174.
Tenenhaus, S. M., Esposito, V., Chatelin, Y.-M., & Laura, C. (2005). PLS path modeling. Computational Statistics & Data Analysis, 48(1), 159–205.
United Nations World Tourism Organization. (2015).
UNESCO world conference on tourism and culture gathers ministers of tourism and culture for the first time. Retrived from http://media.unwto.org/press-release/2015-02-06/ unwtounesco-world-conference-tourism-and-culture-
gathers-ministers-tourism-Woodside, A. G., & Dubelaar, C. (2002). A general theory of tourism consumption systems: A conceptual frame-work and an empirical exploration. Journal of Travel Research, 41(2), 120–132.
Xu, J., & Chan, A. (2010). Service experience and package tours. Asia Pacific Journal of Tourism Research, 15(2), 177–194.
Zeithaml, V. E. (1988). Consumer perceptions of price, quality, and value: A means–end model and synthesis of evidence. Journal of Marketing, 52(3), 2–22. Zhang, H., Fu, X., Cai, L. A., & Lu, L. (2014).
Destina-tion image and tourist loyalty: A meta-analysis. Tourism Management, 40, 213–223.