http://www.ijcmph.com pISSN 2394-6032 | eISSN 2394-6040
Original Research Article
Assessment of quality of life among elderly population of rural areas of
Etawah district: a cross sectional study
Priyanka Bansal, Anand M. Dixit*, Pankaj K. Jain, Sandip K. Gupta,
Prashant K. Bajpai, Jyoti Mehra
INTRODUCTION
Ageing is a natural, biological and universal process accompanied by an increased risk of deficiency, disease, disability, decreased functional capacity and eventually death.
Globally, life expectancy of geriatric population have increased. It is increasing faster than all other age groups1 which may lead to more social and economical responsibility on developing countries than developed countries. The United Nations defines senior citizens as those above the age of 60 years.1
World health organization (WHO) defines quality of life as “an individual’s perception of their position in life in the context of the culture and value systems in which they live and in relation to their goals, expectations, standards and concerns.2 Quality of life is subjective component of well-being rather than specific and objective, which makes it difficult to measure. According to census 2011 (India) elderly was 8% of total population in which male and females comprises 7.70% and 8.40 % respectively.3 According to NFHS-4 survey elderly accounts 9% of all age group and in rural it accounts 9.5% of total population in Uttar Pradesh.6
ABSTRACT
Background: All the aspects of health status, lifestyle, life satisfaction, mental health and well-being together reflects the multidimensional nature of quality of life (QOL) in an individual. The objective of the study was to assess the quality of life among rural elderly population of Etawah district and their association with various socio demographic factors.
Methods: A community based cross-sectional study was conducted among 316 elderly subjects in rural areas of Etawah district. QOL was assessed by using WHOQOL-OLD tool. Socio-demographic factors were assessed by using a self-structured questionnaire. Data was analysed by using Microsoft Excel 2010 and statistical software SPSS-22. Transformed facet sore were calculated using WHOQOL- OLD manual and Independent sample t- test were applied.
Results: Majority (86%) were in the (≤75) years of age. Among the study participants, 52.8% were females, 67.5% were illiterate, 72.5% belong to nuclear family. The mean scores of QOL domains was maximum in death and dying (83.20), followed by sensory ability (62.99).The lowest mean score was seen Intimacy domain (22.80). Gender, type of family, financial status and staying with partner were found to be the determinants of better QOL (p>0.05).
Conclusions: The mean quality of life score was below average in intimacy domain. It was maximum in death and dying domain.
Keywords: Elderly, QOL, WHOQOL-OLD
Department of Community Medicine, Uttar Pradesh University of Medical Sciences, Saifai, Etawah, Uttar Pradesh, India
Received: 01 April 2019
Accepted: 19 April 2019
*Correspondence:
Dr. Anand M. Dixit,
E-mail: [email protected]
Copyright: © the author(s), publisher and licensee Medip Academy. This is an open-access article distributed under the terms of the Creative Commons Attribution Non-Commercial License, which permits unrestricted non-commercial use, distribution, and reproduction in any medium, provided the original work is properly cited.
It is estimated that the number of older persons aged ≥60 years is expected to more than double by 2050 and to more than triple by 2100, rising from 962 million globally in 2017 to 2.1 billion in 2050 and 3.1 billion in 2100.1 The present study was carried out with an objective to assess the Quality of Life in the geriatric population and its relation to various demographic factor.
METHODS
Study design: The present study was a community based
cross-sectional study conducted over a period of one and half month from 1st September 2018 to 15th October 2018. The study subject consist of geriatric population aged ≥60 years residing in the 6 villages of Saifai block of Etawah district namely- Henwra, Lichwai, Ramaiyapur, Geenja, Ujhyani, Baghuiya. Persons who refuse to give written consent were excluded from the study.
Sample size estimation:A study sample of 316 elderly was calculated by using the formula N=1.96σ2/l2 (where, σ = S.D, l = allowable error) assuming standard deviation (SD) of elderly as 1300, 1.5% allowable error at 95% confidence interval and 10% of non-response rate.
Sampling technique: Multistage random sampling technique was used to enroll the study subjects. There are 8 developmental block in Etawah District. Out of 8 developmental block, 3 block were selected randomly, from each block 2 villages were selected by lottery method, from each village 54 participants were interviewed by house to house visit till the sample size was completed. If more than one eligible participant were present during house to house visit only one were selected depending upon which were available first.
Study tools: The data on demographic factors were
collected by using self-structured questionnaire. QOL was assessed by WHOQOL-OLD questionnaire. This questionnaire consist of 6 domains namely- sensory abilities (SAB), autonomy (AUT), past, present and future activities (PPF), social participation (SOP), death and dying (DAD) and intimacy (INT). Each of these 6 domains has 4 questions on 5-point Likert scale. For negatively worded question, recoding was done by reversing the obtained score. After recoding, raw score were calculated. Higher value represents higher quality of life and lowest represent lower QOL. The mean score, t and transformed facet score (TFS) were calculated using WHOQOL-OLD manual8. The scores of these six domain or the values of these 24 questions were combined to produce overall rep quality of life score. A Pilot study was done on 20 elderly before the survey, concerned to ensure feasibility and acceptability of the study. WHO has developed two questionnaires for the assessment of QOL: WHOQOL-BREF and WHOQOL-OLD. Both have
Ethical clearance: Ethical clearance and approval was taken from university’s research and ethical committee prior to the initiation of study. Prior to start of study permission had also taken from WHO for using the questionnaire. Written informed consent was taken from study subject.
Data analysis: Statistical analyses were carried out by using Microsoft excel 2010 and statistical software SPSS-22. Results were obtained in terms of mean and standard deviation. Independent s t-test were used for assessing the association between categorical variables and QOL scores. P-value less than 0.05 was considered as significant.
RESULTS
A total of 316 study subjects were participated in study. Out of all subjects, 167 (52.8%) were females. Maximum 275 (86.4%) number of participants were <75 years of age. Approximately 210 (66.5%) of them were illiterate. Around 3/4th of the subjects 229 (72.5%) belonged to Joint family and 215 (68%) living with their spouse. Around 155 (49%) of study subjects were financially dependent on their family.
Table 1: Demographic characteristics of study subjects.
Demographic factors Number (%)
Gender
Male 149 (47.2)
Female 167 (52.8)
Age (in years)
<75 273 (86.4)
>75 43 (13.6)
Education
Illiterate 210 (66.5) Literate 106 (33.5)
Family type
Nuclear 87 (27.5)
Joint 229 (72.5)
Marital status
Currently married 215 (68)
Single 101 (32)
Financial status
Dependent 155 (49.1) Independent 161 (50.9)
Table 2 shows the descriptive statistics (mean and S.D.) of six domain representing quality of life among study participants.
significance of the difference between means was tested by independent t-test at 5% significance level.
Table 2: Quality of life scores of study participants.
QOL domains Mean S.D.# Median score
Sensory abilities 62.99 17.61 62.50
Autonomy 51.42 19.91 56.25
Past, present and future activities 56.28 16.65 56.25
Social participation 57.29 16.15 62.50
Death and dying 83.20 18.33 87.50
Intimacy 46.93 18.44 46.87
Overall QOL scores 59.69 20.50 60.41
#S.D- standard deviation.
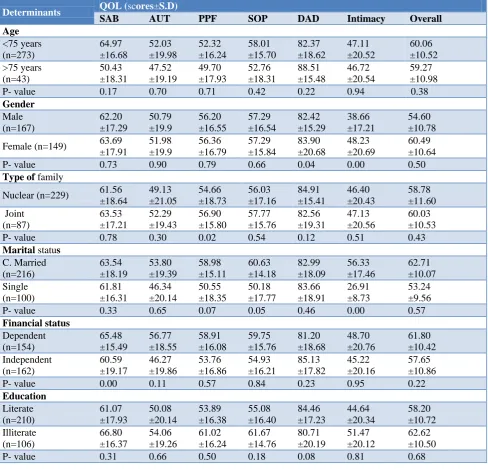
Table 3: Association of QOL scores with various socio-demographic factors.
Determinants QOL (scores±S.D)
SAB AUT PPF SOP DAD Intimacy Overall
Age <75 years (n=273) 64.97 ±16.68 52.03 ±19.98 52.32 ±16.24 58.01 ±15.70 82.37 ±18.62 47.11 ±20.52 60.06 ±10.52 >75 years (n=43) 50.43 ±18.31 47.52 ±19.19 49.70 ±17.93 52.76 ±18.31 88.51 ±15.48 46.72 ±20.54 59.27 ±10.98
P- value 0.17 0.70 0.71 0.42 0.22 0.94 0.38
Gender Male (n=167) 62.20 ±17.29 50.79 ±19.9 56.20 ±16.55 57.29 ±16.54 82.42 ±15.29 38.66 ±17.21 54.60 ±10.78
Female (n=149) 63.69 ±17.91 51.98 ±19.9 56.36 ±16.79 57.29 ±15.84 83.90 ±20.68 48.23 ±20.69 60.49 ±10.64
P- value 0.73 0.90 0.79 0.66 0.04 0.00 0.50
Type of family
Nuclear (n=229) 61.56 ±18.64 49.13 ±21.05 54.66 ±18.73 56.03 ±17.16 84.91 ±15.41 46.40 ±20.43 58.78 ±11.60 Joint (n=87) 63.53 ±17.21 52.29 ±19.43 56.90 ±15.80 57.77 ±15.76 82.56 ±19.31 47.13 ±20.56 60.03 ±10.53
P- value 0.78 0.30 0.02 0.54 0.12 0.51 0.43
Marital status
C. Married (n=216) 63.54 ±18.19 53.80 ±19.39 58.98 ±15.11 60.63 ±14.18 82.99 ±18.09 56.33 ±17.46 62.71 ±10.07 Single (n=100) 61.81 ±16.31 46.34 ±20.14 50.55 ±18.35 50.18 ±17.77 83.66 ±18.91 26.91 ±8.73 53.24 ±9.56
P- value 0.33 0.65 0.07 0.05 0.46 0.00 0.57
Financial status Dependent (n=154) 65.48 ±15.49 56.77 ±18.55 58.91 ±16.08 59.75 ±15.76 81.20 ±18.68 48.70 ±20.76 61.80 ±10.42 Independent (n=162) 60.59 ±19.17 46.27 ±19.86 53.76 ±16.86 54.93 ±16.21 85.13 ±17.82 45.22 ±20.16 57.65 ±10.86
P- value 0.00 0.11 0.57 0.84 0.23 0.95 0.22
Education Literate (n=210) 61.07 ±17.93 50.08 ±20.14 53.89 ±16.38 55.08 ±16.40 84.46 ±17.23 44.64 ±20.34 58.20 ±10.72 Illiterate (n=106) 66.80 ±16.37 54.06 ±19.26 61.02 ±16.24 61.67 ±14.76 80.71 ±20.19 51.47 ±20.12 62.62 ±10.50
DISCUSSION
Majority of elderly participants in our study were <75 years of age. The present study shows that 87% of elderly were living in joint family and 78% were living with their spouse.Similar findings were noted by Charan et a. and Akbar et al with respect to age.9,10 Out of all participants, female subjects were more in number. A study conducted among geriatric population of Dehradun by Kritika et al showed similar findings in respect to age, gender, type of family and marital status except gender.11
The overall quality of life score was 59.69 in present study which was comparable to other studies done by Kritika et al and Sultan et al where QOL score were 56.02 and 58 respectively.10,12 In a study done by Figueira et al in 2009 for cross-cultural comparison of QOL between Brazil (calculated by WHOQOL-OLD) and India (calculated by WHOQOL 100) revealed overall QOL score of 48% for Brazilian and 51% for Indian elderly population.13 Both of which were less as compared to the present study. The differences in QOL as perceived by the elderly belonging to different countries may due to differences in cultural practices and use of different study tool.
Comparing the facets of QOL, the death and dying facet showed the highest score (83.20) while the score of the facet “intimacy” was lowest (46.93). Similar results were observed by Kritika et al in their study.11 Consistent with the results of this study, another study showed that the highest QOL score was in the facet DAD but the lowest score was found to be in AUT.13 The physical, emotional and social changes occurring in elderly may contribute to the lowest QOL score in intimacy domain of our study. In a study of Turkey, the highest score was seen for the facet INT followed by AUT and PPF.12
In Brazil, it was found that PPF had a high score and DAD had the lowest score of just 38%.13 The scores for all the facets were less as compared to the present study which suggested that the QOL of elderly in India is better as compared to Brazil. The poor QOL were due to result of social inequalities and selection of elderlies from a low-income group.
In present study age was not associated with QOL. Concordant findings were observed by Praveen et al but Sowmiya et al and Kumar et al did not find any association between age and QOL.14-16
Gender was significantly associated with QOL in two facets namely DAD and intimacy. Females shows higher value in both domain. In studies done by Akbar et al, Sowmiya et al, Raj et al and Quadri et al, gender was found to be associated with QOL but opposite findings were observed by Praveen et al and Barua et al.10,14-19
done by Sowmiya et al, Kumar et al showed that the elderly living in joint families had better QOL than in nuclear families.15,16 This is contradicted by Hameed et al.20 According to that QOL depends more on the relationship with family members rather than the type of family alone.
Similar to the finding of Sowmiya et al, Kumar et al, Raj et al, Quadri et al, Barua et al,Hameed et al, and Gupta et al.15-20 this study also found significant relationship of QOL with marital status but no association was found in a study by Praveen et al.14,23 Financial independence was found to afford better QOL in elderly. Gupta et al had also found relationship between financial dependency and QOL.21
Funding: No funding sources Conflict of interest: None declared
Ethical approval: The study was approved by the Institutional Ethics Committee
REFERENCES
1. UN. World population prospects: the 2017 revision. Methodology of the United Nations population estimates and projections. United Nations Department of Economic and Social Affairs PD; 2014.
2. WHO. Study protocol for the world health organization project to develop a quality of life assessment instrument (WHOQOL). Qual Life Res. 1993;2:153-9.
3. Population Composition, Chapter 2, Census of India. Available at: http://www.censusindia.gov.in/ vitalstatistics/SRS Report/ 9Chap 2011.pdf. Accessed on 17 February 2015.
4. Wellbeing Measures in Primary Health care/ The DEPCARE project: Report on a WHO meeting; Regional office for Europe, the World Health Organization; 1998.
5. The WHOQOL Group. The development of the World Health Organization Quality of Life Assessment Instrument (the WHOQOL). In: Orley J, Kuyken W, editors. Quality of Life Assessment: International Perspectives. Springer-Verlag: Heidleberg; 1994: 43.
6. International Institute for Population Survey (IIPS). National Family Health Survey (NFHS-4), India 2015-2016: Uttar Pradesh. Mumbai : IIPS
7. Kumar SG, Majumdar A, Pavithra G. Quality of Life (QOL) and Its Associated Factors Using WHOQOL-BREF Among Elderly in Urban Puducherry, India. J Clin Diagnostic Res. 2014;8(1):54-7.
8. WHO. WHOQOL-OLD. Copenhagen; 2006: 1-61. 9. Charan S, Mathur JS, Mishra VN, Singh JV, Singh
1995;20(1-10. Akbar F, Kumar M, Das N, Chatterjee S, Mukhopadhyay S, Chakraborty M, et al. Quality of Life (QOL) Among Geriatric Population in Siliguri Sub-division of District Darjeeling, West Bengal NatJ Res Com Med. 2012;1(4):178-241.
11. Kritika, Kakkar R, Aggarwal P, Semwal J. Quality of Life (QOL) among the Elderly in Rural Dehradun. IJCH. 2017;29(01):43-4.
12. Sultan ESER, Gül SAATL, Erhan ESER, Hakan BAYDUR, Caner FİDANER. The Reliability and Validity of the Turkish Version of the World Health Organizati on Quality of Life Instrument-Older Adults Module (WHOQOL-Old). Turkish J Psychiatry. 2010.
13. Figueira, Helena A, Figueira JA, Bezerra JC, Dantas, Estélio HM. Old Aged Quality of Life: Brazil – India a Cross-cultural Perspective. Indian J Gerontol. 2009;23(1):6678.
14. Praveen V, M AR. Quality of life among elderly in a rural area. Int J Community Med Public Health. 2016;3(3):754-7.
15. Sowmiya KR, Nagarani. A Study on Quality of Life of Elderly Population in Mettupalayam, A Rural Area of Tamilnadu. NatJ Res Com Med. 2012;1(3):123-77.
16. Kumar SG, Majumdar A, G P. Quality of Life (QOL) and Its Associated Factors Using WHOQOL-BREF Among Elderly in Urban Puducherry, India. J Clin Diagn Res. 2014;8(1):547. 17. Raj D, Swain PK, Pedgaonkar SP. A study on quality of life satisfaction & physical health of
elderly people in Varanasi: An urban area of Uttar Pradesh, India. Int J Med Sci Public Health. 2014;3(5):616-20.
18. Qadri SS, Ahluwalia S, Ganai AM, Bali spS, Wani FA, Bashir. H. An epidemiological study on quality of life among rural elderly population of nothern India. Int J Med Sci Public Health. 2013;2(3):514-22.
19. Barua A, Mangesh R, Kumar HN, Saajan M. Assessment of the domains of quality of life in the geriatric population. Indian J Psychiatry. 2005;47(3):157-9.
20. Hameed S, Brahmbhatt KR, Dipak C Patil DC, S. PK, Jayaram S. Quality of life among the geriatric population in a rural area of Dakshina Kannada, Karnataka, India. Global J Med Public Health. 2014;3(3):1-5
21. Gupta A, Mohan U, Tiwari SC, Singh SK, Manar MK, Singh VK. Home away from Home: Quality of Life, Assessment of Facilities and Reason for Settlement in Old Age Homes of Lucknow, India. Ind J Comm Health. 2014;26(2):165-9.