Original Research Article
A study on associations and influence of health determinants on
systolic and diastolic blood pressure
Sreenivasa V. Yalamanchili*
INTRODUCTION
Hypertension or blood pressure is usually reported on the basis of both systolic blood pressure (SBP) and diastolic blood pressure (DBP). The impact of SBP and DBP on staging of hypertension or the resultant community burden varies with populations, age groups or gender. Hypertension is a very common condition in clinical practice, and it rarely causes symptoms in the early stages and many people go undiagnosed until developing cardiovascular complications, stroke, kidney failure and premature mortality or disability. As per the WHO report on non-communicable diseases (NCD’s) in India, the 2008 estimated prevalence of raised blood pressure was 33.2% males and 31.7% in females.1 High prevalence of
hypertension is despite the fact that it can be easily measured and is a well-known modifiable risk factor. Pre hypertension has a high likelihood of converting to hypertension if left untreated. Hypertension is a leading risk factor for cardiovascular diseases. The most striking fact emerging from the rapidly changing global health environment in the past few decades is the shift of disease burden from communicable to non-communicable diseases. Globalisation, demographic changes, rapid urbanisation, unhealthy lifestyles are the common causes of global disease burden. India is dealing with a dual disease burden. The disease burden in India, measured in
DALYs (Disability-Adjusted Life Years) shows
communicable diseases have decreased from 295 million (in 1996) to 153 million (in 2016) whereas non
ABSTRACT
Background: The aim of the study was to assess the prevalence of hypertension among Indian urban educated population and evaluate the association of various modifiable and non-modifiable risk factors on the development of systolic blood pressure (SBP) and diastolic blood pressure (DBP).
Methods: The retrospective study comprised of medical data obtained from 175 individuals who had undergone routine annual medical check-up during the period 2016 -2017. The data was analysed and interpreted using summary statistics, correlations and linear regression analysis. Most of the variables were measured values.
Results: Out of 175 reports analysed, 40 (22.9%) individuals comprising of 29 males and 11 females were found to be hypertensives. Isolated systolic hypertension was present in 4 (2.3%) individuals, isolated diastolic hypertension in 26 (14.9%) individuals and in 10 (5.7%) individuals both systolic and diastolic blood pressure was raised. Significant correlations were observed. Multiple linear regression showed significant positive influence of DBP, age and BMI on SBP whereas serum vitamin D level and left ventricular cardiac ejection fraction was negatively influencing SBP (R²=0.638, p=0.000). furthermore, multiple regression analysis with DBP as the dependent variable showed SBP, and serum vitamin D level to be the significant influencing determinants (R²=0.602, p=0.000).
Conclusions: The present study on the Influence of modifiable and non-modifiable risk factors on development of SBP and DBP improves knowledge for better preventive strategies.
Keywords: Hypertension, Systolic blood pressure, Diastolic blood pressure, Health determinants Balagangadhara Varma Nursing Home and Research Centre, Chennai, Tamil Nadu, India
Received: 12 August 2018
Accepted: 12 September 2018
*Correspondence:
Dr. Sreenivasa V. Yalamanchili, E-mail: [email protected]
Copyright: © the author(s), publisher and licensee Medip Academy. This is an open-access article distributed under the terms of the Creative Commons Attribution Non-Commercial License, which permits unrestricted non-commercial use, distribution, and reproduction in any medium, provided the original work is properly cited.
communicable diseases increased from 184 million (in 1996) to 259 million (in 2016). In 2016, cardiovascular disease contributed to 14.1% of the total disease burden in India.2 Lack of physical activity, stress, high fat and increased salt intake are some of the causes of hypertension. The adverse health consequences of hypertension are compounded because of associated risk factors such as obesity, high cholesterol and diabetes mellitus. Hypertension can be prevented and controlled with lifestyle modifications. This study analyses the associations and influences of health correlates on SBP and DBP in a group of educated and middle class employees and their spouses in Chennai, India.
METHODS
This was a retrospective cohort study using data obtained from reports of annual health check-up undertaken by educated, middle class employees of a national research organisation and their spouses in Chennai, India were collected for study data. The annual medical check-up was done during the period 2016 to 2017. Data was quantitative and empirical in nature. All participants gave their informed consent. Out of total 227 reports collected, incomplete data was excluded. The data of 175 individuals were found to be complete in all respects and considered in the study for further analysis and interpretation. All anthropometric measurements (Height in cm and Weight in Kg), Blood pressure readings, haematology (Blood Haemoglobin), biochemical values (serum lipid profile, serum thyroid stimulating hormone, serum vitamin D, serum vitamin B12, serum calcium), Cardiac ejection fraction percentage and ultrasonogr staging of fatty liver status was studied. Hypertension was defined as systolic blood pressure of ≥140 mmHg and diastolic blood pressure of ≥90 mmHg as per seventh report of Joint National Committee (JNC-7) on the prevention, detection, evaluation and treatment of high blood pressure. Body mass index (BMI) was calculated from height and weight measurements.
Statistical analysis was conducted using Statistical Package for Social Sciences version 16.0 (SPSS Inc., USA). Categorical variables (gender, fatty liver status staging) are reported as frequencies. Continuous variables are reported as descriptive statistics. Correlations analysis was conducted to analyse the associations between variables and linear regression analysis was conducted to analyse the influencing determinants on SBP and DBP independently. P<0.05 were considered significant.
RESULTS
General profile of the sample data
The total sample of 175 individuals comprised of 108 (61.7%) males and 67 (38.3%) females.
All the individuals were educated, belong to middle income group and reside in urban locality. The age of
male individuals ranged from 36 years to 60 years with mean and standard deviation (SD) of 44.1±5.6 years. The age of female individuals ranged from 35 years to 64 years with mean and standard deviation of 42.8±5.4 years. The mean BMI of males was 25.44±3.71 (SD) and of females 27.56±4.17 (SD). 56.7% females had <12.5 gm/dL haemoglobin (Hb) level while only 2.8% males had less than <13.0 gm/dL (Normal haemoglobin reference value used in females 12.5–14.5 gm/dL and males 13.0–17.0 gm/dL). 80.6% females showed deficient serum vitamin D levels (<20 ng/ml), 14.9% insufficient serum vitamin level (<30 ng/ml). Likewise 68.5% males had <20 ng/ml and 25% <30 ng/ml serum vitamin D levels. 31.5% males and 19.4% females were found to have low serum vitamin B12 level (<180 pg/ml). 16.7% males and 32.8% females were found to have low serum calcium level (<8.6 mg/ml). 15.7% males and 13.4% females had serum Thyroid stimulating hormone (TSH) >5.33 µIU/ml (Normal TSH reference value 0.38– 5.33µIU/ml). Majority of females (74.6%) had high Serum Triglycerides (TGL), 46.3% had high total cholesterol level, 23.9% had low high density lipoprotein cholesterol (HDL-C) and 49.3% high low density lipoprotein cholesterol (LDL-C). In males, 35.2% had high TGL, 57.4% high total cholesterol, 37% low HDL-C and 58.3% high LDL-C. Serum total cholesterol <170 mg/dL, serum TGL <150 mg/dL, serum LDL-C <100 mg/dL and Serum HDL-C >40 mg/dL were taken as reference values for data analysis. Ultrasonogram study of staging of fatty liver disease showed 74.1% males and 77.6% females had no fatty liver changes, 16.7% males and 16.4% females had grade I fatty liver changes and 9.3% males and 6% females showed grade II fatty liver changes. There was no appreciable difference in the range and mean values of the cardiac left ventricular ejection fraction (males- 68.5%±5.2 (SD) and females 69.7%±5.4 (SD)).
Hypertension prevalence and analysis
Figure 1: Age distribution prevalence of hypertensive individuals.
Legend:
--●-- Percentage of individuals with isolated SBP. ….■… Percentage of individuals with isolated DBP. --▲-- Percentage of individuals with SBP and DBP.
The correlation between SBP and DBP in the study population was highly positive and significant (r=0.744, p<0.001).
SBP is significantly and positively correlated with Age, Weight, BMI and serum TGL; while DBP is significantly
and positively correlated with Age, Weight, BMI, Serum TGL, Height and Haemoglobin level (Table 1).
Comparison between individuals with DBP <90mmHg with individuals with DBP ≥90 mmHg, shows that there is a significant increase in age, BMI, SBP (p<0.001), Haemoglobin level (p=0.015), serum vitamin D level, and serum calcium level in the group with DBP ≥90 mmHg. The comparison of lipid profile shows increase in serum total cholesterol (p=0.029), serum TGL, and serum LDL-C and a decrease in HDL-LDL-C level in the group whose DBP ≥90 mmHg. Serum TSH, serum vitamin B12 levels and the left ventricular Ejection fraction decreases in individuals with DBP ≥90 mmHG group. Similarly, comparing the mean change in study parameters between individuals with SBP <140 mmHg with individuals with SBP ≥140 mmHg, it is found that there is an increase in age (p=0.013), BMI (p=0.019), DBP (p=0.001), haemoglobin level, serum calcium level (p=0.003) and an decrease in serum vitamin D level, serum TSH, serum vitamin B12 levels and left ventricular Ejection fraction in the group with BP ≥140 mmHg. All the Lipid profile parameters TGL (p=0.081) and serum total cholesterol (p=0.074)) studied show an increase in the group whose SBP ≥140 mmHg (Table 2).
Table 1: Significant correlations of SBP with other study parameters.
Parameter “r” “p” Interpretation
Correlations of SBP with study parameters [Pearson correlation sig 2 tailed]
DBP 0.744 0.000 Highly Significant high positive correlation
Age 0.300 0.000 Highly Significant mild positive correlation
Weight 0.281 0.000 Highly Significant weak positive correlation
BMI 0.254 0.001 Significant weak positive correlation
Serum TGL 0.204 0.007 Significant weak positive correlation
Correlations of DBP with study parameters [Pearson correlation sig 2 tailed]
Weight 0.341 0.000 Highly Significant mild positive correlation
Haemoglobin level 0.245 0.001 Significant weak positive correlation
Height 0.211 0.005 Significant weak positive correlation
Serum TGL 0.197 0.009 Significant weak positive correlation
BMI 0.191 0.011 Significant weak positive correlation
Age 0.175 0.020 Significant weak positive correlation
Table 2: Comparison of study parameters among different groups.
Study parameters DBP <90 mmHg DBP ≥90 mmHg SBP <140 mmHg SBP ≥140 mmHg
Mean SD Mean SD Mean SD Mean SD Age in years 43.24 5.18 45.03 6.67 43.15 5.13 48.86 7.40
Height in cm 163.17 9.44 164.74 8.34 163.38 9.17 164.82 10.15
Weight in kg 69.33 10.37 74.02 13.11 69.75 10.84 76.52 12.66
BMI kg/m² 26.01 3.91 27.21 4.31 26.10 4.08 28.06 2.60
Systolic BP mmHg 116.01 9.93 133.61 8.33 117.48 9.72 144.29 6.46
Diastolic BP mmHg 75.18 6.44 91.67 5.07 77.52 8.08 90.71 11.41
Haemoglobin/dL 13.58 1.79 14.43 1.81 13.72 1.78 14.17 2.28
Total cholesterol mg/dL 171.72 33.09 180.81 47.45 173.16 33.43 178.52 63.87
Serum TGL mg/dL 128.48 68.36 145.42 71.57 128.44 66.70 172.50 85.76
Serum HDL mg/dL 44.07 9.76 43.56 7.55 43.77 8.47 46.21 16.63
Serum LDL mg/dL 101.96 28.83 110.81 30.82 103.71 27.74 104.64 45.62
0 5 10 15 20 25 30
35-44 45-54 55-64
Perc
entag
e
o
f
Indiv
idua
ls
Study parameters DBP <90mmHg DBP ≥90mmHg SBP <140mmHg SBP ≥140mmHg
Mean SD Mean SD Mean SD Mean SD Serum TSH µIU/ml 3.70 3.53 3.43 2.30 3.68 3.40 3.21 2.05
Serum vitamin D ng/ml 14.82 8.14 16.16 8.77 15.10 8.31 15.04 8.05
S Vitamin B12 pg/ml 289.20 222.83 253.88 116.10 282.29 211.88 277.79 116.39
Serum calcium mg/dL 8.74 0.32 8.80 0.32 8.74 0.33 8.92 0.18
Cardiac LV EF% 68.96 5.27 68.89 5.30 68.97 5.35 68.64 4.27
Gender male% 58.99 72.22 60.25 78.57
Gender female% 41.01 27.78 39.75 21.43
Fatty liver grade 0% 78 67 78 50
Fatty liver grade I% 15 22 14 43
Fatty liver grade II% 7 11 8 7
Number of cases 139 36 161 14
Table 3: Multivariate analysis – linear regression (n=175) –dependent variable – systolic blood pressure.
Independent variables Unstandardized coefficients Standardized coefficients t Sig.
B Std. Error Beta
(Constant) 21.066 18.049 1.167 0.245
Age 0.386 0.107 0.179 3.597 0.000
Gender (female-0, male-1) 0.255 1.762 0.010 0.145 0.885
BMI 0.435 0.158 0.146 2.752 0.007
DBP 0.892 0.069 0.678 12.841 0.000
Haemoglobin -0.311 0.481 -0.047 -0.645 0.520
Total cholesterol 0.017 0.019 0.048 0.866 0.388
Triglycerides 0.006 0.010 0.034 0.610 0.543
TSH -0.125 0.182 -0.035 -0.690 0.491
Vitamin D -0.160 0.073 -0.111 -2.202 0.029
Vitamin B12 -0.004 0.003 -0.075 -1.531 0.128
Calcium 3.058 1.995 0.082 1.533 0.127
Fatty liver staging (normal
-0, Grade I - 1, Grade II- 2) 0.068 0.967 0.003 0.070 0.944 Left Ventricular EF -0.320 0.112 -0.141 -2.848 0.005
R2=0.638, F = 21.871, Sig. 0.000 [p< 0.050 is significant].
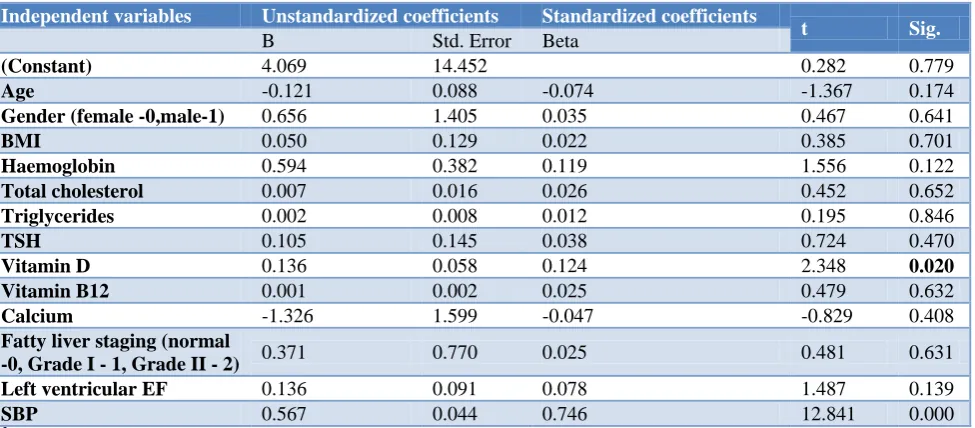
Table 4: Multivariate analysis – linear regression (n=175) dependent variable – diastolic blood pressure.
Independent variables Unstandardized coefficients Standardized coefficients
t Sig.
B Std. Error Beta
(Constant) 4.069 14.452 0.282 0.779
Age -0.121 0.088 -0.074 -1.367 0.174
Gender (female -0,male-1) 0.656 1.405 0.035 0.467 0.641
BMI 0.050 0.129 0.022 0.385 0.701
Haemoglobin 0.594 0.382 0.119 1.556 0.122
Total cholesterol 0.007 0.016 0.026 0.452 0.652
Triglycerides 0.002 0.008 0.012 0.195 0.846
TSH 0.105 0.145 0.038 0.724 0.470
Vitamin D 0.136 0.058 0.124 2.348 0.020
Vitamin B12 0.001 0.002 0.025 0.479 0.632
Calcium -1.326 1.599 -0.047 -0.829 0.408
Fatty liver staging (normal
-0, Grade I - 1, Grade II - 2) 0.371 0.770 0.025 0.481 0.631 Left ventricular EF 0.136 0.091 0.078 1.487 0.139
SBP 0.567 0.044 0.746 12.841 0.000
A multivariate linear regression model was proposed in which SBP was proposed to be a dependent variable on independent variables–age, gender, BMI, DBP, blood haemoglobin level, serum total cholesterol, serum triglycerides, serum TSH, serum vitamin D, serum vitamin B12, serum calcium, fatty liver staging and left ventricular ejection fraction respectively. The model showed a significant positive influence of DBP, age and BMI on SBP, whereas a significant negative influence of serum vitamin D and left ventricular ejection fraction was observed on SBP. Of the significantly influencing independent variables, DBP has the highest magnitude of influence followed by age, left ventricular ejection fraction, BMI and vitamin D in the order. The model had a reasonable explanatory power (r2=0.638), thus inferring that variations in independent variables correlated with variations in dependent variables to an estimated precision of 63.8% (Table 3).
DBP was proposed to be a dependent variable on independent variables–age, gender, BMI, SBP, blood haemoglobin level, serum total cholesterol, serum triglycerides, serum TSH, serum vitamin D, serum vitamin B12, serum calcium, fatty liver staging and left ventricular ejection fraction respectively and a multivariate regression analysis was done. The model showed a significant positive influence of SBP and serum vitamin D level on DBP. Of which, SBP was found to be the most important independent variable influencing DBP. The model has a reasonable explanatory power (r2=0.602), thus inferring that variations in independent variables correlated with variations in dependent variables to an estimated precision of 60.2% (Table 4).
DISCUSSION
Hypertension is a common health issue especially in emerging economies like India, china and African nations owing to changing lifestyle factors such as physical inactivity, increased salt intake, highly processed food, fatty food consumption, stress, rapid urbanisation and increased longevity.3 Geldsezter et al in their study carried out between 2012 to 2014 with sample size of 1.3 million adults in India, reported high prevalence of diabetes and hypertension in India among middle and old age and across all geographical and socio demographic distribution.4 The also reported that hypertension prevalence among young adults is higher than previously thought.
Here, in the present study, we attempted to study the prevalence of hypertension among the sample group and identify the associations and influences of the factors that lead to hypertension. We found that the 22.9% prevalence of hypertension among the study group was consistent to that reported from similar studies.5-7 The prevalence of hypertension was found to increase with increasing age and significant positive correlations between age with SBP and age with DBP were noted. Similar associations between age and hypertension were reported from earlier
studies.8-11 Multivariate logistic regression analysis in the present study shows that both SBP and DBP was significantly associated with age and this agrees with that reported by Rani et al and Mungreiphy et al.11,12 The prevalence of hypertension was more in male when compared to females in the present study similar to that reported by earlier researchers.10,13 Prevalence of overweight and abdominal obesity is higher in women than men. Even then they had a lower prevalence of hypertension due to using of lower cut-off point for abdominal obesity among women or due to biological protection of women against the effect of excess adiposity.14 Progressive physical inactivity and stress are known determinants for developing hypertension as age increases. Significant positive correlations between BMI and hypertension were noted in the study. We observed for SBP the correlation coefficient was 0.254 with BMI and for DBP it was 0.191 with BMI, similar to that reported by Deshmukh et al and multivariate analysis showed BMI to be a significant risk factor for SBP wear as the influence of BMI on DBP was found to be insignificant.15 Hypertension study group reported higher BMI to be associated with increased odds of being hypertensive.16 Most of the other studies, reported a significant association of escalating hypertension with obesity and truncal obesity in both sexes.13,17 They observed that increasing hypertension in India correlated with increasing adiposity levels. Our study shows that though the correlation of haemoglobin with SBP and DBP were significant, multiple regression analysis did not consider haemoglobin level as a significant risk factor influencing SBP or DBP. This could be due to the presence of cofounders in the regression analysis.
In our study we noted significant positive correlation of haemoglobin level with DBP (correlation coefficient 0.245). However no significant correlation was noted between Haemoglobin and SBP. Atsma et al in their study reported that haemoglobin level is positively associated with both SBP and DBP in healthy individuals and their observations showed consistent effects both between persons and also within persons.18 The mechanisms that might lead to an elevated blood pressure in individuals with an increased Haemoglobin level are not entirely known. Increased blood viscosity due to increase in haematocrit and haemoglobin levels coupled with arterial stiffness has a role in the development of hypertension.
development of hypertension. Dyslipidaemia with physical inactivity causes increased adiposity, overweight, obesity and leads to hypertension.13,17,19 The mean TSH levels were lower in individuals with SBP ≥140 mmHg and DBP ≥90 mmHg when compared to normotensive individuals. The correlations of TSH with SBP and DBP were insignificant and also multiple regression analysis did not establish TSH as a significant risk factor. Dhanju et al observed a positive linear correlation between TSH levels and SBP.20 Liu et al reported the prevalence of hypertension in subclinical hypothyroidism group significantly higher than in euthyroid group in females and also the change of TSH in normal range did not affect blood pressure.21
There are many studies with opposing views on the role of Vitamin D on development of hypertension; it appears that Vitamin D levels in the body modulate the blood pressure indirectly.22 Studies that support the role of vitamin D on development of hypertension have mostly reported that SBP and DBP had increased among individuals experiencing inadequacy of vitamin D which is associated with renin-angiotensin-aldosterone system regulation. Our study confirms with these findings. Multiple regression analysis in our study shows that Vitamin D has significant influence on SBP and DBP. Also in our study, serum calcium was not found to be influencing SBP or DBP. Few studies have reported that vitamin D or calcium supplementation had no influence on SBP or DBP of and individual.
The present study did not observe any difference among the hypertensive and non-hypertensive groups with regards to fatty liver grading of the individuals. We observed a significant correlation between left ventricular ejection fraction of the heart and SBP while an insignificant correlation existed between left ventricular ejection fraction of the heart and DBP. It is well known that strain on the cardiac muscle due to increased SBP leads to decrease in left ventricular ejection fraction of the heart and ultimately cardiac failure. Left ventricular hypertrophy, ischaemic changes on ECG, cardiomegaly on chest x-ray and hypertensive retinopathy changes were significantly higher in hypertensive group as compared to normal individuals.19
CONCLUSION
The prevalence of hypertension among the urban, educated group in Chennai confirms the rising trend of hypertension in India. Multiple linear regression analysis in the present study infers that DBP, age, BMI and serum vitamin D level of the individuals were found to explain 63.8% of the variation in SBP altogether. SBP and Serum vitamin D levels of the individual explains 60.2% variation altogether in DBP. These findings help create awareness on the various risk factors in the development of SBP and DBP. This helps build preventive strategies for control and management of hypertension.
Funding: No funding sources Conflict of interest: None declared Ethical approval: Not required
REFERENCES
1. World Health Organization-NCD Country Profiles, 2011. World Health Organization, Geneva; 2011. 2. Global Burden of Disease Collaborative Network.
Global Burden of Disease Study 2016 (GBD 2016) Results. Seattle, United States: Institute for Health Metrics and Evaluation (IHME), 2017. Available at: http://ghdx.healthdata.org/gbd-results-tool.
Accessed on 3 June 2018.
3. Gupta R, Khedar RS, Panwar RB. Strategies for Better Hypertension Control in India and Other Lower Middle Income Countries. J The Association of Physicians of India. 2016;64:58-64.
4. Geldsetzer P, Manne-Guehler J, Theilmann M, Davies JI, Awasthi A, Vollmer S, et al. Diabetes and Hypertension in India, A Nationally Representative study of 1.3 Million Adults. JAMA Intern Med. 2018;178(3):363-72.
5. Anchala R, Kannuri NK, Pant H, Khan H, Franco OH, Di Angelantonio E, et al. Hypertension in India: a systematic review and meta-analysis of prevalence, awareness, and control of hypertension, J Hypertens. 2014;32:1170-7.
6. Women M. Epidemiology of Hypertension. JAPI. 2013;61:12-3.
7. National Family Health Survey. 2017. Available at: http://rchiips.org/nfhs/abt.html. Accessed on 31 December 2017
8. Das SK, Sanyal K, Basu A. Study of Urban Community Survey in India: Growing Trend of High Prevalence of Hypertension in a Developing Country. Int J Med Sci. 2005;2:70-8.
9. Mohan V, Deepa M, Farooq S, Datta M, Deepa R. Prevalence, Awareness and Control of Hypertension
in Chennai–The Chennai Urban Rural
Epidemiology Study (CURES–52). JAPI.
2007;55:326-32.
10. Momin MIH, Deasi VK, Kavishwar AB. Study of Socio-Demographic Factors Affecting Prevalence of Hypertension among Bank Employee of Surat City. Indian J Public Health. 2012;56:44-8.
11. Mungreiphy NK, Kapoor S, Sinha R. Association Between BMI, Blood Pressure, and Age: Study among Tangkhul Naga Tribal Males and Northeast India. J Anthropol. 2011;2011:748147.
12. Shanthirani CS, Pradeep R, Deepa R, Premalatha G, Saroja R, Mohan V. Prevalence and Risk Factors of
Hypertension in a Selected South Indian
Population—the Chennai Urban Population Study. Journal of Assoc. Physicians India. 2003;51:20-6. 13. Desai MHV, Kavishwar A. A Study on Effect of
14. Chauhan RC, Purty AJ, Natesan M, Velavan A, Singh Z. Risk factors profile for noncommunicable diseases among adult urban population of puducherry in India. J Obes Metab Res. 2014;1:201-8.
15. Deshmukh PR. Gupta SS, Dongre AR, Bharambe
MS, Maliye C, Kaur S. Relationship of
Anthropometric Indicators with Blood Pressure Levels in Rural Wardha. Indian J Med Res. 2006;123:657-64.
16. Hypertension Study Group. Prevalence, Awareness, Treatment and Control of Hypertension among the Elderly in Bangladesh and India: A Multicentre
Study. Bull World Health Organization,
2001;79:490-500.
17. Gupta R, Gupta VP. Hypertension Epidemiology in India: Lessons from Jaipur Heart Watch. Current Sci. 2009;97:349-55.
18. Atsma F, Veldhuizen I, Kort W, Kraaij M, Pasker-de Jong P, Deinum J. Hemoglobin Level Is Positively Associated With Blood Pressure in a Large Cohort of Healthy Individuals, Hypertension. 2012;60:936-41.
19. Aggarwal HK, Jain D, Mor S, Yadav RK, Jain P.
Prevalence and Clinical Correlates of
Microalbuminuria in Patients with Essential Hypertension - A Tertiary Care Center Cross Sectional Study. J Association Physicians India. 2016.
20. Dhanju AS, Neki NS, Singh A, Sandhu PS. A Study on Association between Thyroid Stimulating
Hormone Levels and etabolic Syndrome
Components. Ann Int Med Den Res. 2016;2(3):102-5.
21. Liu D, Jiang F, Shan Z, Wang B, Wang J, Lai Y, et al. A cross-sectional survey of relationship between serum TSH level and blood pressure, Journal of Human Hypertension. 2010;24:134–8.
22. Mehta V, Agarwal S. Does Vitamin D Deficiency Lead to Hypertension? Cureus. 2017;9(2):e1038.
Cite this article as: Yalamanchili SV.A study on associations and influence of health determinants on systolic and diastolic blood pressure. Int J