Original Research Article
Assessment of undernutrition using composite index of anthropometric
failure among children less than 5 years in an urban
slum, Visakhapatnam
Naga Sowjanya Namburi
1, Madhavi Seepana
2*
INTRODUCTION
In developing countries, undernutrition continues to be the major cause of under-five mortality and morbidity. 5.6 million children under age five died in 2016 and India accounts a major part of it.1
The NFHS-4, data analysis showed a significant association between under five child mortality rates and child underweight rates.2 Malnourished children are more
susceptible to infections and have low recovering abilities. Furthermore, malnourished children do not grow to their optimum size and have lower IQ which in turn effects the development and prosperity of the nation.3 Estimation of under nutrition in children is conventionally indicated by anthropometric indicators such as stunting, wasting and underweight. Stunting is an indicator of chronic under nutrition; wasting is an indicator of acute undernutrition; underweight is used as
ABSTRACT
Background: Under nutrition continues to be a major public health problem in India despite years of incessant preventive measures. Composite index of anthropometric failure (CIAF) provides the burden of under nutrition as a single measure and helps in detection of children with multiple anthropometric failures. The objectives of this study are to assess the prevalence of under nutrition using CIAF as compared to conventional indicators and to identify the risk factors associated with Anthropometric Failure.
Methods: This was a community based, cross sectional descriptive study on Under 5 children done in the urban slum area under Allipuram Urban Health Centre, Visakhapatnam, A.P. Anthropometric measurements (height, weight and mid upper arm circumference) were taken and mothers of the study children were interviewed to obtain relevant information. WHO Z-score system and the CIAF were used to estimate the magnitude of under-nutrition.
Results: Out of 100 children, 56 children were suffering from under nutrition according to CIAF. Analysis of various factors showed that low birth weight, lesser duration of breast feeding, low education level of mother, over crowding and low socio economic status were significantly associated with under nutrition assessed by CIAF.
Conclusions: CIAF provides the actual prevalence or proportion of undernourished children in a community. So CIAF must be included in regular recordings of health status of children. The study also reinforces the importance of appropriate maternal care, proper infant and child feeding practices and family planning services in prevention of under nutrition.
Keywords: Under nutrition, Composite index of anthropometric failure, Z-scores, Wasting, Stunting, Underweight 1
Andhra Medical College, Visakhapatnam, Andhra Pradesh, India 2
Department of Community Medicine, Andhra Medical College, Visakhapatnam, Andhra Pradesh, India
Received: 01 July 2018
Revised: 17 September 2018
Accepted: 18 September 2018
*Correspondence:
Dr. Madhavi Seepana,
E-mail: [email protected]
Copyright: © the author(s), publisher and licensee Medip Academy. This is an open-access article distributed under the terms of the Creative Commons Attribution Non-Commercial License, which permits unrestricted non-commercial use, distribution, and reproduction in any medium, provided the original work is properly cited.
a composite indicator to reflect both acute and chronic under nutrition. But the limitations with these indicators are that they cannot provide the overall prevalence of malnutrition and often under estimate the actual burden. Moreover, these indices do not emphasize the children with multiple anthropometric failures who are more prone for morbidity and mortality.
Composite Index of Anthropometric Failure (CIAF) developed by Svedberg et al and modified by Nandy et al is the most recent and it envisages all the parameters for estimation of nutritional status of a child.4 It provides the burden of under nutrition as a single measure by counting all the children with wasting/stunting/underweight in six different categories (Group B, C, D, E, F and y) and by excluding children with no anthropometric failure (Group A). CIAF is a better index for screening child populations to evaluate the nutritional status and risk of malnutrition in those populations.
The current study uses the WHO Z score system and the CIAF to estimate the magnitude of under nutrition. Certain study variables were considered, as undernutrition results mostly because of inappropriate infant and young child feeding practices. Determining the magnitude of malnutrition using a single parameter along with its determinants will help the health administrators and policy makers to work on all the modifiable factors for effective prevention and control of this malady among the under five children
With this back ground, a study was undertaken to estimate the prevalence of undernutrition and determine various risk factors associated with it among under five children in an urban slum, Visakhapatnam.
METHODS
This was a community based, cross sectional descriptive study on under 5 children conducted from May 2016 to June 2016 in the urban slum area under Allipuram Urban Health Centre, Visakhapatnam, Andhra Pradesh.
Sample size
Sample size for the cross sectional prevalence study was calculated using the formula Sample size (n) =4PQ/d2. With an expected prevalence of under nutrition (P) of 50% and a relative precision (d) of 10% of P, the required sample size is 400. But because of feasibility, a sample of 100 children were considered.
Sampling technique
The desired sample (i.e., 100 children) was selected by simple random sampling method.
Inclusion criteria
Children below 5 years of age whose parents are willing to give consent.
Exclusion criteria
Children who are not resident of the slum, but visiting and children of families who had moved into slum with in the past one month and children whose mothers were not available at the time of survey.
Study tools
Semi structural pretested questionnaire, salters weighing scale, measuring tape, WHO Z score system (2006) and the CIAF was used to estimate the magnitude of undernutrition.
Study variables
Age, recumbent length/standing height, weight, under nutrition, feeding practices, demographic details of the family.
Data collection
Data collection was done by house to house survey. One hundred children in the age group of 0-5 years were selected randomly and the mothers of these children were interviewed using a semi structural pre tested questionnaire, the purpose of the study was explained and the confidentiality of the information was assured. Anthropometric measurements height, weight and age were measured.
Data analysis
The participants were classified as stunted, wasted and underweight as their nutritional status depending upon the Z score values which was calculated using WHO Anthro (version 3.2.2, 2011). If Z score <-2=moderately undernourished, if Z score <-3= severely undernourished. The responses to schedule by each participant were entered into an excel sheet and data was tabulated STATA 11 was used for univariate analysis.
Ethical considerations
Institutional Ethics Committee clearance was obtained prior to beginning of the study. Collection of data was done only after obtaining consent from the parents of the children.
RESULTS
distributed in both the sexes. The age wise distribution of CIAF among study participants can be observed in Table 1. Relatively the distribution of CIAF is highest in age group of 37 to 59 months.
Table 1: Age wise distribution of CIAF among study participants.
Age in months
CIAF Total (%)
Present (%) Absent (%)
0–6 4 (33.33) 8 (66.66) 12 (100)
7–12 11 (57.89) 8 (42.1) 19 (100)
13–36 20 (58.82) 14 (41.17) 34 (100)
37–59 21 (60) 14 (40) 35 (100)
Total 56 44 100
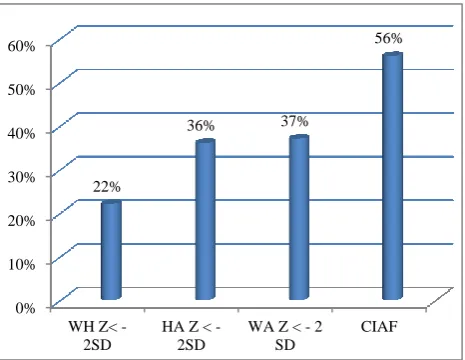
The wasting was observed in 22 participants, 36 participants were stunted and 37 were underweight. 56 children were suffering from one or more forms of undernutrition and these were depicted in Figure 1. Among the wasted children, 18 were moderately wasting and 4 were severely wasting, similarly 25 children were moderately underweight and 12 children were severely underweight, 23 children were moderately stunting and 13 were suffering from severe form of stunting.
Figure 1: Under nutrition in study population according to various anthropometric indicators.
Children show combination of various forms of under nutrition. 6 children were suffering from only wasting, 8 children were suffering from wasting and underweight, 8 children were suffering from all the three forms of under nutrition, 15 were suffering from stunting and underweight and 13 were suffering from only stunting. Table 2 shows the proportion of children in each of the sub groups. (i. e, A,B,C,D,E,F,Y). Six sub groups (B, C, D, E, F, Y) include children with CIAF and subgroup A include children with no anthropometric failure. Group E (containing children who are stunted and underweight) is the largest accounting 15% of study population.
Figure 2: Combination of various forms of under nutrition among study population.
Table 2: Under nutrition in study population as per CIAF categorization.
Group Description No. of
children
A No failure 44
B Wasting only 6
C Wasting and underweight 8
D Wasting, stunting and
underweight 8
E Stunting and underweight 15
F Stunting only 13
Y Underweight only 6
CIAF=B+C+
D+E+F+Y Anthropometric failure 56
Total 100
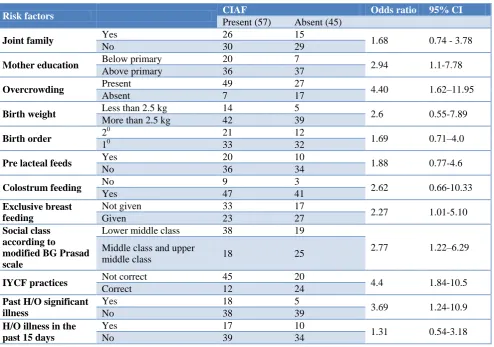
Among study population, 31% were delivered by caeserian section and all of them institutional delivery either in government health facility (69%) or in private nursing home (31%). 73% of the mothers had above primary education. Prelacteal feeding was given for 30% of the children with sweet water and honey being most commonly used. Children who were not given colustrum accounts only 12% of the study population. About 41% of the children live in joint families. Overcrowding was present in 76% of the families. 19 children were less than 2.5 kg of weight at the time of birth. Out of 100 children 65 children had birth order of 1, 33 children had birth order of 2 and only 2 children had birth order of 3. IYCF practices were correct in 36% of the children(IYCF practices includes exclusive breast feeding for 6 months and continuition of breast feeding for minimum 2 years and other feeding practices). According to modified BG prasad scale 57% of children belongs lower middle class and 43% of them belongs to middle class and upper middle class. 23 children had past history of significant illness(mostly suffered from diarrhoea, respiratory infection, jaundice), and 27 children were suffered with illness in the past 15 days ( mostly with fever and diarrhea). Table 3 shows the association and its strength
0% 10% 20% 30% 40% 50% 60%
WH Z< -2SD
HA Z < -2SD
WA Z < - 2 SD
CIAF 22%
36% 37%
56%
Underweight
6
Wasting 6
Stunting
13
15 8
of factors which were significantly associated with under nutrition assessed by CIAF.
The significant factors associated with increased risk of under nutrition (Table 3) were children with less educated mothers, overcrowding, not exclusively breastfed, from low social class, incorrect IYCF practices and past history of significant illness.
Variables like sex, religion, mother’s occupation, education and occupation of father, mode and place of delivery of the child and presence of separate kitchen were not significantly associated with under nutrition assessed by CIAF. All the children were accordingly immunized and with the exception of two all the families were using latrines.
Table 3: Univariate analysis of certain risk factors for anthropometric failure (CIAF).
Risk factors CIAF Odds ratio 95% CI
Present (57) Absent (45)
Joint family Yes 26 15 1.68 0.74 - 3.78
No 30 29
Mother education Below primary 20 7 2.94 1.1-7.78
Above primary 36 37
Overcrowding Present 49 27 4.40 1.62–11.95
Absent 7 17
Birth weight Less than 2.5 kg 14 5 2.6 0.55-7.89
More than 2.5 kg 42 39
Birth order 2
0
21 12
1.69 0.71–4.0
10 33 32
Pre lacteal feeds Yes 20 10 1.88 0.77-4.6
No 36 34
Colostrum feeding No 9 3 2.62 0.66-10.33
Yes 47 41
Exclusive breast feeding
Not given 33 17
2.27 1.01-5.10
Given 23 27
Social class according to
modified BG Prasad scale
Lower middle class 38 19
2.77 1.22–6.29 Middle class and upper
middle class 18 25
IYCF practices Not correct 45 20 4.4 1.84-10.5
Correct 12 24
Past H/O significant illness
Yes 18 5
3.69 1.24-10.9
No 38 39
H/O illness in the past 15 days
Yes 17 10
1.31 0.54-3.18
No 39 34
DISCUSSION
The present study identifies all the under nourished children who may be either wasted, stunted or underweight. The CIAF provides an overall estimate of the number of under nourished children in a population, which conventional indices do not.
This study conducted in an urban slum area in Visakhapatnam showed the prevalence of underweight, stunting and wasting among study participants as 37%, 36%, 22% respectively. According to NFHS–4 (Visakhapatnam), underweight was 33.1%, stunting 30.1% and wasting 17.2% in under 5 children.2 The prevalence of under nutrition is slightly higher in this study compared to NFHS-4, as the current study was conducted in slum area where the factors associated with undernutrition are relatively higher. At national level the rates of undernutrition for children below 5 years
according to NFHS-4 were 35.7% for underweight, 38.4% for stunting and 21.0% for wasting.
When taking CIAF into consideration for calculating prevalence of malnourished children, it was found to be 56%, which tends to be higher than the overall prevalence rates of stunting (36%), wasting (22%) and underweight (37%) calculated using conventional methods and this tendency was in agreement with the observations of other studies.5-10
The observed CIAF values in similar studies conducted by Mandal et al (73.1%), Dasgupta et al (55%), Gupta et al (45%), Seetharaman et al (68.6%), Dewan et al (73.2%) and Kherde et al (52%).
significant illness are more likely to have anthropometric failure. Similar findings were observed in the study by Gupta et al, Rastogi et al.6,11
This paper has demonstrated that conventional indices underestimate the prevalence of under nutrition, but Svedberg notes that CIAF indices may in fact leads to overestimate because they capture those who are primarily ill for reasons unrelated to nutrition.12 This implies the CIAF is also vulnerable to this limitation given that it is constructed from the conventional indices.
CONCLUSION
The prevalence of under nutrition was high among under 5 children in the urban slum. CIAF gives a better estimation of magnitude of under nutrition than isolated anthropometric indices. Modifiable factors such as low maternal education, not giving exclusive breast feeding, low social class, past history of significant illness and incorrect feeding practices were significantly associated with anthropometric failure. The study findings reinforce the need for continuing programs on promotion with exclusive breast feeding and correct IYCF practices.
Funding: No funding sources Conflict of interest: None declared
Ethical approval: The study was approved by the Institutional Ethics Committee
REFERENCES
1. Newborn and Child Mortality, Global Health Observatory Data; WHO Available at: www.who.int/gho/. Accessed on 3 June 2018. 2. NFHS 4 National family Health Survey, India;
Available at: rchiips.org/nfhs/nfhs 4.shtml. Accessed on 3 June 2018.
3. The mother and child health education trust. Available at: https://motherchildtrust.org/2017. Accessed on 3 June 2018.
4. Nandy SM, Irving M, Gordon D, Subramanian SV, Devi Smith G. Poverty, Child under nutrition and morbidity: new evidence from India. Bull World Health Organization. 2005;83:210-6.
5. Mandal GC, Bose K. Assessment of overall prevalence of under nutrition using CIAF among preschool children of West Bengal India. Iran J Pediatr. 2009;19(3):237-43.
6. Dasgupta A, Sahoo SK, Taraphdar P, Preeti PS, Biswas D, Kumar A, et al. Composite Index of Anthropometric Failure and its important correlates: a study among under five children in a slum of Kolkata, West Bengal, India. Int J Med Sci Public Health. 2015;4:414-9.
7. Gupta G, Sharma A, Choudhary TS. Assessment of under nutrition among children below 5, using Composite Index of Anthropometric Failure (CIAF). Indian J Community Health. 2017;29(1)108-13. 8. Gupta V, Mohapatra D, Kumar V. Nutritional
assessment among children (under five years of age) using various anthropometric indices in an urban area of district Rohtak, Haryana, India. Int J Biomed Res. 2015;6(9):629-34.
9. Nandy S, Irving M, Gordon D, Subramanian SV, Smith GD. Poverty, Child Under nutrition and Morbidity: new evidence from India. Bulletin of the WHO/. 2005;83(3).
10. Dasgupta A, Parthasarathi R, Ram Prabhakar V, Biswas R, Geethanjali A. Assessment of under nutrition with Composite Index of Anthropometric Failure (CIAF) among under five children in a rural area of West Bengal. Indian J Community Health. 2014;26(2)132-8.
11. Rastogi S, Maheshwari C, Raghav SK, Lala MK. Assessing Burden of Under-Nutrition among Under five Children of Urban Slum by Using Composite Index of Anthropometric Failure in Ahmedabad City, Gujarat, India. National J Comm Med. 2017;8(8)496-500.
12. Svedberg P. Poverty and under nutrition: theory, measurement and policy. New Delhi: Oxford India Paperbacks; 2000.