---ABSTRACT--- Fingerprints are today the most widely used biometric features for personal identification. With the increasing usage of biometric systems the question arises naturally how to store and handle the acquired sensor data. Our algorithm for the digitized images is based on adaptive uniform scalar quantization of discrete wavelet transform sub band decomposition. This technique referred to as the wavelet scalar quantization method. The algorithm produces archival quality images at compression ratios of around 15 to 1 and will allow the current database of paper finger print cards to be replaced by digital imagery. A compliance testing program is also being implemented to ensure high standards of image quality and interchangeability of data between different implementations.
Keywords: fingerprint compression, discrete wavelet, binarization, adaptive quantization
--- Paper Submitted: 10 May 2009 Accepted: 19 August 2009
--- 1. Introduction
I
n distributed biometric systems, the data acquisition stage is often dislocated from the feature extraction and matching stage. In such environment the sensor data have to be transferred via a network link to the respective location, often over wireless channels with low bandwidth and high latency. Therefore, a minimization of the amount of data to be transferred is highly desirable, which is achieved by compressing the data before transmission. When a typical fingerprint card is scanned at 500 dpi, with 8 bits/pixel, it results in about 10Mb of data. For 200 million cards, the total size of the digitized collection would be more than 2000 terabytes .Finger print images are routinely sent between law enforcement agencies. Overnight delivery of the actual card is too slow and risky, and sending 10 Mb of data through a 9600 baud modem takes about three hours. Compression is, therefore, a must. At first, it seems that fingerprint compression must be lossless because of the small but important details involved. However, lossless compression methods produce typical compression ratios of 0.5. Most lossy image compression methods involve the loss of small details and are therefore unacceptable. This is where wavelets come into the picture. Our proposed workwavelet scalar quantization (WSQ) is a lossy wavelet compression. We are carefully designed, it can satisfy the criteria above and results are efficient compression, where important small details are preserved, or at least identifiable. Fingerprint images exhibit characteristic high energy in certain high frequency bands resulting from the ridge valley pattern and other structures. These minutiae characteristics are local discontinuities in the fingerprint pattern which represent terminations and bifurcations. A ridge termination is defined as the point at which a ridge ends abruptly. A ridge bifurcation is defined as the point at which a ridge forks or diverges into branch ridges. The ridge structure in fingerprint images is not always well defined, and therefore, an enhancement is required before compression [5]. In our work enhancement is carried out using local histogram equalization and wiener filtering and image binarization. To account for this property, the wavelet scalar quantization (WSQ) standard for lossy fingerprint compression uses a specific wavelet packet sub band structure, which emphasis the important high frequency bands [1]. Filter choice is classical pyramidal coding scheme specifically tuned for fingerprint compression. It is identified that biorthogonal filters are being superior to orthogonal filters and also they optimize filters for fingerprint compression. In this work a
WAVELET SCALAR QUANTIZATION
B.Karuna kumar
Department of Electronics and Communication Engineering, Government Polytechnic, Proddatur
Email: [email protected]
Dr. K.Satya Prasad
Professor and Director of Evaluation J.N.T.University, Kakinada,A.P
special type of wavelet filter is suggested to adapt for the high frequency content [4].
2. Implementation
2.1 Enhancement: Extracting minutiae from fingerprint images is one of the most important step in automatic fingerprint identification and classification. So before compression enhancement is a must. The main stages of our proposed enhancement process conducted on a binary fingerprint images are shown in Fig (1).
Figure-1: Filtering and binarization process Histogram equalization defines a mapping of gray levels p
into gray levels q such that the distribution of gray level q is
uniform. We propose to use a pixel wise adaptive wiener filter method for noise reduction. The operation that converts a gray scale image into a binary image is known as binarization [4]. We carried out the binarization process using an adaptive threshold. Each pixel is assigned a new value (1 or 0) according to the intensity mean in a local neighborhood.
Figure- 2: Original image and its histogram
Figure-3: Wiener filtering result and binarization image 2.2 Compression /Reconstruction
Our method involved three steps 1) A discrete wavelet transforms.
2) Adaptive Scalar quantization of the wavelet transforms coefficients.
3) A two pass Huffman coding of the quantization indices.
Compressed data Figure 4 Compression process
Compressed data Reconstructed Image
Figure 5 Image reconstruction process
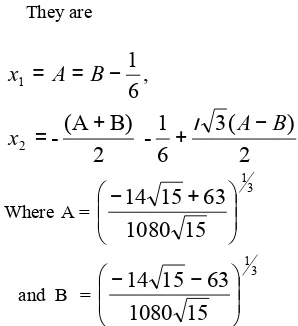
We are using a symmetric discrete wavelet transform (SWT). To implements this transform symmetric filter coefficients are used. Our symmetric filter has 7 and 9 impulse response taps and they depend on the two numbers x1(real) and x2(complex) [1,6].
They are
,
6
1
1
=
A
=
B
−
x
2
)
(
3
6
1
2
B)
(A
-
2
B
A
x
=
+
+
ι
−
Where A =
3 1
15
1080
63
15
14
−
+
and B =
3 1
15
1080
63
15
14
−
−
The symmetric wavelet filter coefficients are
=
oh
[0.85269879 0.377402855 -0.1106244 -0.023849465 0.03782845]1
=
h
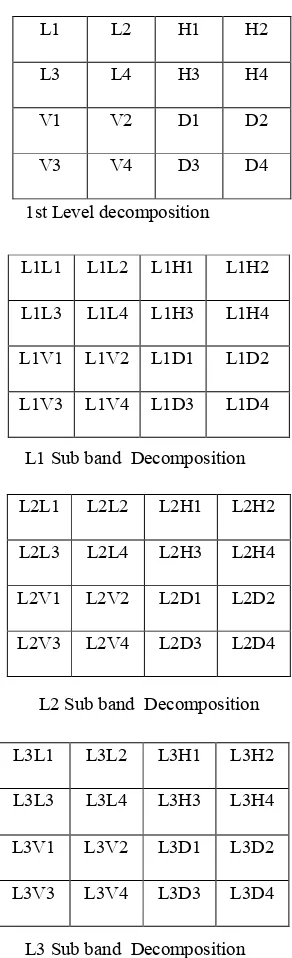
[ 0.788485616 -0.418092273 -0.0406894176 0.0645388826]The method of wavelet image decomposition used in this work is different from those conventional methods. Wavelet transform is first applied to the image rows and columns, resulting in 4x4=16 sub-bands. The wavelet transform is then applied to the same manner to three of the 16 sub-bands. The last step is to decompose the top left sub-band into four smaller ones [1,2].
Original fingerprin t image
Histogra m equaliz
ation
Wiener Filterin
g
Binariz ation
Enhanc ement image
DWT QuantizatiScalar on
Huffman
Coder 10011101
Huffman Decoder
Scalar De-Quantizati
on
1st Level decomposition
L1 Sub band Decomposition
L2 Sub band Decomposition
L3 Sub band Decomposition
Figure 6 Symmetric Image wavelet decomposition. The transform coefficients in the 64 sub-bands are floating point numbers to be denoted by ‘a’. They are quantized to a finite number of floating-point numbers that are denoted by
'
'
a
∧ . The encoder maps a transform coefficient ‘a’ to a quantization index ‘p’. The index “p” can be considered a pointer to the quantization bin where “a” lies. The decoder receives an index “p” and maps it to a value'
a
∧'
that is close, but not identical, to ‘a’. The set of'
a
∧'
values is a discrete set of floating point numbers called the quantized wavelet coefficients. The quantization depends onparameters that may vary from sub-band to sub-band, since different sub-bands have different quantization requirements.
Figure 7 Scalar Quantization
Fig(7) shows the setup of quantization bins for sub band “K”. Parameter Zk is the width of the zero bin, and parameter Qk is the width of the other bins. Parameter “C” is the range [0,1]. It determines the reconstructed value
'
a
∧'
. For C=0.5, the reconstructed value for each quantization bin is the center of the bin[4,7]./2 ( , ) /2 )
, (
a
,
1
mn kk k
k n m
k
Z
Q
Z
a
>
+
−
(m,n) k
P
=0
−
Z
k/2≤
a
k(
m
,
n
)
≤
Z
k/2/2 ( , ) /2
) , (
a
,
1
mn kk k
k n m
k
Z
Q
Z
a
−
<
+
+
…...(1)
(
)
P
(m,n)0
k , 2 / )
,
(
−
+
>
k k n
m
k
C
Q
Z
P
'a∧'= 0
P
k(m,n)=
0
(
(m,n)+
)
k−
k/2,P
k(m,n)<
0
k
C
Q
Z
P
…… (2)The equation (1) shows how parameters Zk and Qk are used by the encoder to quantize a transform coefficient ak(m,n) to an index Pk (m,n), and how the decoder computers a quantized coefficient
∧
) , (mn k
a
from that index.Adopted C value is 0.44, and determines the bin widths Qk and ZK from the variances of the transform coefficients in the different sub-bands given below:
L1 L2 H1 H2 L3 L4 H3 H4 V1 V2 D1 D2 V3 V4 D3 D4
L1L1 L1L2 L1H1 L1H2 L1L3 L1L4 L1H3 L1H4 L1V1 L1V2 L1D1 L1D2 L1V3 L1V4 L1D3 L1D4
L2L1 L2L2 L2H1 L2H2 L2L3 L2L4 L2H3 L2H4 L2V1 L2V2 L2D1 L2D2 L2V3 L2V4 L2D3 L2D4
L3L1 L3L2 L3H1 L3H2 L3L3 L3L4 L3H3 L3H4 L3V1 L3V2 L3D1 L3D2 L3V3 L3V4 L3D3 L3D4
) 1 (
2 Q C
Z
− +
S
2 Z
−
Q Z
+ −
2 Q
Z
3 2+
− a
Step1:- Calculation of width, height, top left and bottom right position of the sub band
Let the width and height of sub band k be denoted by XK and YK, respectively.
We compute the six quantities
WK=
4
3
X
K,HK=
16
7
Y
K(3)
Xok=
8
K
X
,x1K=xok+wk-1 (4)
Yok=
32
9
Y
K,Y1k=Y0k+HK-1 (5)
Step2: Calculation of variance of the sub band K
The variance σk2 of the sub-band k from position (Xok, Yok) to the position (X1k,Y1k), assuming the position (0,0) is the top-left corner of the sub band is given by
σk2 =
(
(
,
)
)
2
1
0
1
0k
x
n
1
.
1
k
n
m
k
a
k
y
k
y
m
k
x
H
W
−
=Σ
=Σ
−
µ
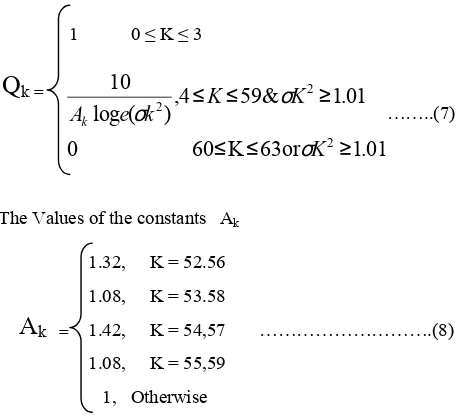
…… (6)Where µk denotes the mean of ak (m,n) in the region. Step3: Calculation of bin width for the sub band and proportional constant Parameter Qk is computed by 1 0 ≤ K ≤ 3
01
.
1
or
63
K
60
0
01
.
1
&
59
4
,
)
(
log
10
2 2 2
≥
≤
≤
≥
≤
≤
K
K
K
k
e
A
kσ
σ
σ
……..(7)The Values of the constants Ak 1.32, K = 52.56 1.08, K = 53.58
1.42, K = 54,57 ……….(8) 1.08, K = 55,59
1, Otherwise
The bin width for sub bands 60-63 are zero. These sub bands consisting of the finest detail coefficients are simply discarded.
Step 4:- The width of the zero bin in set to Zk = 1.2QK. The last step is to prepare the Huffman code tables. Which are to be written on the compressed stream as they depend on the image A Huffman code table for sub band is prepared by counting the number of times, the code is repeated. The
counts are used to determine the length of each code and to construct the Huffman code tree. This is a two-pass job. One pass to determine the code tables and the 2nd pass to encode.
3. Results
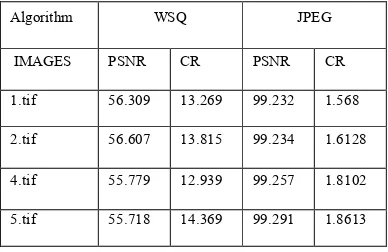
In the concrete experiments we enhance the raw fingerprint image and then compress it. Record the compression ratio corresponding PSNR value and reconstruct the image. We tabulate (Table1) the compression ratios and PSNR values for different fingerprint images. We compared to the JPEG results (see Table 1) PSNR values are consistently higher: for ratio 12, PSNR ranges between 50dB to 60dB and 25dB to 30Db for JPEG respectively.
Figure 8 Fingerprint database
Figure 9 1st level sub band decomposition
Figure 10 2nd level sub band decomposition
Figure-11:Reconstructed image
Q
k =A
k =Table -1: Comparative table for WSQ and JPEG
** Peak signal to noise ratio (PSNR) is calculated as follows
PSNR= 20
RMSE
pi
i/
/
max
log
10* Compression Ratio (CR) is calculated as follows CR = N1/N2
N1–number of information carrying bytes in the original image.
N2–number of information carrying bytes in the encoded image.
Root mean square error (RMSE) =
∑
=
−
n
i
Qi
pi
n
12
)
(
1
Where Pi = pixel of original image, Qi = pixel of reconstructed image. Here the encoded image is MAT file. 3.1 Interesting features
Each of the 64 sub bands has been normalized independently for visualization as a gray scale image; this is why the background intensities appear to vary randomly. Independent normalization is necessary because the variance of these sub bands differ by much more than this visualization would lead one to believe. The variance of the lowest frequency sub band (upper left) surpasses the variance of the highest frequency band (lower right) by six orders of magnitude. This allows the encoder to deploy its resources more efficiently by allocating more bits to the bands with greater variances.
The sub bands along the top, which have been high pass filtered along rows and low pass filtered along columns, pick up the vertical line near the right edge of the picture. The sub bands along the left side, however, which have been high pass filtered along columns and low pass filtered along rows, pick up the horizontal lines at the top and bottom edges of the picture. Side-effect of this orientation selectivity is that the band in the upper-right corner, which has been low pass filtered twice along columns and high pass filtered
twice along rows, has conveniently isolated all of the scanner noise in this particular image.
Finally some of the sub bands represent aliasing due to the non-ideal nature of the digital filters used in the multirate wavelet filter bank. This aliasing is completely cancelled by the inverse DWT in the absence of quantization noise or floating-point round off error (“perfect reconstruction in perfect arithmetic”).
4. Conclusion and Feature Work
This paper proposed an efficient fingerprint compression algorithm using wavelets. The proposed technique is particularly preserve important small details in fingerprints such as ridges and sweat pores for matching purpose. Choosing wavelets for image coding applications is still a somewhat inexact science, depending on a lot of trail and error. In the future we can investigate whether the good PSNR and high compression performance of some technique tailored especially a target modality does carry over to matching.
References
[1] L. Hong, Y. Wan, and A. Jain,” Fingerprint Image Enhancement: Algorithm and Performance Evaluation,” IEEE Trans Pattern Analysis and Machine Intelligence, vol 20,no 8 pp 777- 780, 1998
[2].B. Jerabek, P. Schneider, and A. Uhl, “Comparison of lossy image compression methods applied to photo-realistic and graphical images using public domain sources,” Tech. Rep. RIST++15/98, Research Institute for Software technology, University of Salzburg, 1998.
[3] David Salomon “Data Compression: The Complete
reference”, 2nd Edition
[4] M.Vetterli & J.Kovaceric, “Wavelets and subband
coding “ Ph PTR
[5]. W. Pennebaker and J. Mitchell, JPEG – Still image
compression standard, VanNostrand Reinhold, NewYork,
1993.
[6]. M. A. Lepley, “Profile for1000ppi fingerprint
compression,” Tech. Rep. MTR 04B0000022, The MITRE
Corporation,2004.
[7] Raghuveer M.rao and Ajit S.Bopardikar “Waqvelet
transforms”, Persons education.
[8]Bradley, Jonathan N. Christopher M.Brishawn, and Tom Hopper (1993) “The FBI Wavelet / Scalar Quantization standard for Gray Seale Fingerprint image compression” proc of visual information processing II, ordiando, FL, SPIE.
[9]. J. N. Bradley, C. M. Brislawn, and T. Hopper,“The FBI wavelet/scalar quantization standard for gray-scale fingerprint image compression,”in SPIE Proceedings, Visual Information Processing II, 1961, pp. 293– 304,(Orlando, FL, USA), Apr. 1993.
Algorithm WSQ JPEG
IMAGES PSNR CR PSNR CR
[10]. D. Taubman and M. Marcellin, JPEG2000 Image Compression Fundamentals, Standards and Practice, Kluwer Academic Publishers, 2002.
[11]. Y. Fisher, T. Shen, and D. Rogovin, “A comparison of fractal methods with DCT (JPEG) and wavelets (EPIC),” in Neural and Stochastic Methods in Image and Signal Processing III, SPIE Proceedings 2304-16, (San Diego, CA, USA), July 1994.
[12]. D. Santa-Cruz and T. Ebrahimi, “A study of JPEG 2000 still image coding versus other standards,” in Proceding of the 10th European Signal Processing Conference, EUSIPCO ’00, (Tampere, Finland), Sept. 2000.
[13]. A. Zhang, B. Cheng, R. Acharya, and R. Menon, “Comparison of wavelet transforms and fractal coding in texture-based image retrieval,” in Visual Data Exploration and Analysis III, G. Grinstein and R. Erbacher, eds., SPIE Proceedings 2656, pp. 116–125, SPIE, Mar. 1996.
[14]. D. Kr¨amer, A. Bruckmann, T. Freina, M. Reichl, and A. Uhl, “Comparison of wavelet, fractal and DCT based methods on the compression of prediction-error images,” in Proceedings of the International Picture Coding Symposium (PCS’97), ITG-Fachberichte 143, pp. 393–397,VDE-Verlag, Berlin, Offenbach, Sept. 1997.
Authors Biography
B.Karuna kumar received B Tech. degree in Electronics and Communication Engineering from JNTU college of Engineering, Anantapur, Andhra Pradesh, India in 1993 and M.Tech. degree in Digital systems and Computer. Engineering from JNTU college of Engineering, Anantapur, Andhra Pradesh, India in 2004. .He joined State Board of Technical Education, Hyderebad as Lecturer in 1995 and served in different constituent Colleges viz., Madanapalle, Anantapur and Proddatur. He has published 2 technical papers in Internationl conferences. He is a member of various professional bodies like IETE, IE, and ISTE.
K.Satya Prasad received B Tech. degree in Electronics and Communication Engineering from JNTU college of Engineering, Anantapur, Andhra Pradesh, India in 1977 and M. E. degree in Communication Systems from Guindy college of Engg. , Madras University, Chennai, India in 1979 and Ph D from Indian Institute of Technology, Madras in 1989. He started his teaching carrier as Teaching Assistant at Regional Engineering College, Warangalin 1979.He joined Jnt University , Hyderebad as Lecturer in 1980 and served in different constituent colleges viz., Kakinada, Hyderabad and Anantapur and at different capacities viz., Associate Professor, Professor, Head of the Department, Vice Principal and Principal. He has published more than 50 technical papers in different National & International conferences and Journals and Authored one Text book. He has guided 4 Ph.D scholars and at present 12 scholars are working with him. His areas of Research include Communications Signal Processing, Image Processing,
Speech Processing, Neural Networks & Ad-hoc wireless networks etc. Dr.Prasad is a Fellow member of various