THE SIGNIFICANCE OF NEWS CHANNELS’ ADVERTISEMENT INVENTORY TOWARDS TELECOM BRAND RECALL FROM CONSUMERS’ PERSPECTIVE
Owais Hussain Azhar
MS Student
Faculty Member SZABIST, Karachi
Dr. Jawaid Ahmed Qureshi (Corresponding author) MS Student
Faculty Member SZABIST, Karachi E-mail: jawedkhanqureshi@gmail.com
ABSTRACT
TV channels advertisement is an important tool of media marketing communication. News channels are one of the largest media in Pakistan to provide opportunities to telecom industry for building their brands. This study investigates the relationship between news channels advertisement inventories/properties and telecom brand recall. There are many factors of news channel advertisement that influence on telecom advertisement recall. This study also examines the four key inventories of news channels that are loose spots placement, fixed spots, news clock sponsorship and program branding. It adopts quantitative method of research and primary data is collected through closed-ended and structured questionnaire from consumers. The findings reveal the telecom consumers’ perspective regarding news channel inventories and validate the developed argument: the news channels inventories have an important role to build the telecom brand recall and especially loose spots, fixed spots, program branding, and news clock sponsorship have a very positive and significant role.
Keywords: News Channels’ Advertisement Inventory, Brand Recall, Consumer Perspective ______________
1. INTRODUCTION
1.1 Research Problem
The major problem and reason of carrying out this study is to investigate the influence of news channel advertisements on telecom sector advertisements and their brand recall. In Pakistan, five major telecom companies operative in the cellular industry include: Mobilink Telenor, Warid, Zong and Ufone, and their budgets are very huge for TV commercials (TVCs). The primary medium of advertising is TV. Advertisers spend approximate 70 to 80% budgets on different TV channels and remaining 20 to 30 % on other mediums (Aurora, 2014). News channels are one of the largest media to provide opportunities to telecom sector for building their brands. But the common issues advertisers are facing include clutter on top-rated news channels. The prime time slots are highly cluttered by different brands, which tend to create problem for telecom sector’s ads as well. Switching power is another major problem as during the commercial break mostly viewers change the TV channel. The problem is to learn that which property of news channel plays most effective role to get the higher results and this probe wants to get consumer’s point in this regard. Advertisers are also facing a serious problem in news channels, frequently their commercial spots are dropped due to breaking news and excess of commercials’ air time in different time slots. This study discovers the relationship and impact of news channels advertisements properties on telecom sector’s brand recall.
1.2 Research Questions
The key queries under the enquiry are lodged underneath:
1) What is the consumers’ opinion towards recall of telecom brands’ advertisements, which are airing on Pakistani news channels?
2) Is the news channels’ advertisement properties most appropriate tool for telecom brands’ recall?
3) Which advertising inventory is the most effective property in news channels for telecom brands?
4) What is the relationship and impact of news channels advertisement inventories/properties on telecom brand recall?
1.3 Research Objectives
Following are the aims and objectives of this investigation:
To find the consumers’ point of views regarding recall of telecom brands’ advertisements aired on news channels of Pakistan.
To enquire whether the news channels’ advertisement properties most appropriate tool for telecom brands’ recall.
To provide direction to brand managers of telecom sector regarding the most appropriate news channel advertisements’ inventory.
To determine the relationship and impact of news channels advertisement inventories/properties on telecom brand recall.
1.4 Significance and Justification of the Study
This research is seeking about the telecom advertisement on news channels and its effectiveness on consumer mindset in the light of commercial realm. The probe is significant in many ways. It assists the advertisers in assessing the effectiveness of their advertisements on news channels. The power of advertising persuades our beliefs and can play with consumer minds and society. Advertising tries to represent a better image of products for consumers and advertisers use news channels inventories to build their brand recall. In Pakistan, there are many news channels available for advertising and have different properties/inventories. Commercial air time, news clock sponsorship, fix spot, and program branding are key inventories/properties of news channel. This study helps to select the news channels with the most effective inventory for telecom advertiser to build a better recall of their brands, products, packages, or promotional campaign, so that advertisers can get the better results of their campaigns within highly cluttered news channels. This study is based on consumers’ point of view, so it extracts results from consumer mind-set perspective.
1.5 Scope and Delimitations of the Study
2. LITERATURE REVIEW
Advertisement is the non-personal communication of information (Etzell, 2008). It is usually paid in nature and is about any product, services or idea which is identified by a sponsor to use any type of medium (Sashidhar, 2006). The advertisers intend to spread an idea about a product and offerings among the prospects of a target market. The basic aim to advertise their product is to create the recall of it in consumer mind, which may lead to purchase their products or services. The majority of marketers use the mass media for their marketing communication (Etzell, 2008). The choice of media depends upon the type of advertisement campaign or nature of message and the intended target audience (Heckler et al., 2014). Television advertisement is one of the best-selling and economical media, which covers the all types of socio-economic classes of consumers or audience (Etzell, 2008). It has a comparatively better impact than any other media of advertisement (Saxena, 2005). The advantage of television inventory over the other media is that it is perceived as a combination of audio and video features. Television has relatively more properties than other mass media and it provides products with instant reach and great possibility for creative advertising. Television is watched by upper and middle class of society and it is also common in poorer society of urban and rural areas (Brasel & Gips, 2014). The impact of TV advertisement inventory has appeared to be stronger than other media of advertisement. The advertisers try to find the most effective way to use television inventory to reach the consumers and target the specific consumer mind-set. TV advertising not only changes the consumer emotions but it gives strong message that influences on daily lives of people (Ramaswami, 2004). Advertiser can be reached through television towards targeted audience. There are many advertisers who still like print advertisements but such medium is not the medium of this century. Although many advertisers prefer print advertising for their clients, but the Pakistani private TV channels have been claiming the largest chunk of ad spending since 2001 and it is continuously growing.
There are many options to utilize advertising space on TV channels. Advertisers need to understand cost effective options of TV advertisement. Mostly advertiser place only loose spot in different available time slots with the help of TV channel ratings but they have many low cost properties like slot branding, scroll, picture and picture, etc. (Etzell, 2008). The conventional theory of demand and supply works in the case of advertising too. The viewership of television in comparison with radio is greater. TV screen provides the high quality of communication to advertisers and more options for communicating the message like visual and audio, whereas radio has only audio option. Thus demands for TV advertisement is greater than radio due to more senses are involved. Geographically TV has a greater reach in terms of broadcasting. In the same manner, the demand for high-rated TV channels is greater than those with low-ratings (Connel, 2014; Walker, 2008). The rate per minute for a TV commercial is comparatively higher for top-rated news channels. There is another factor which is affecting the cost of TV channels advertising that is production. The production of a TV commercial costs very high because it involves many departments and money to build a creative and effective commercial. In this regard, telecom sector in Pakistan is spending huge amount of money for its commercial’s production, because its campaigns are continuously changed due to rapidly changing packages and intensity of competition.
2.1 TV Channel Ratings Drive the Advertising Prices
from non-prime ones. Out of the available choices like, sponsored programs, branded shows, Picture in Picture (PIP), scroll, etc., every inventory have different rates and a media buyer has to suggest which inventory is the best for a client.
2.2 News Channels’ Market Share and Telecom Advertisement Spending
In 2014, telecom sector focused only on 14 Pakistani news channels out of 27 (Media Monitors Pakistan, 2015). Advertising agencies planned their budgets according to TV channels ratings, and top-rated channels got the higher business comparatively. TV channel business also depends on tariff rate per minute. There are two dimensions to see the business performance of any TV channels, one is how many minutes they have aired and how much business they get in terms of Rupees or Dollars. Tariff rates of every channel have to be different respectively. The main inventory of news channels is loose spot or Run out Daypart (RODP). The total advertisement spent of news channels was Rs. 911 Billion on top 14 news channels. Express News was the most successful channel who got the highest business than others, which was Rs.179.3 billion and the 20% of total news channel business. Then, Geo News had Rs.165 billion business, it got 18% market share, Duniya News achieved 12% of total for Rs.105 billion, Samaa News got 11% share that was for Rs.99.5 billion and ARY News did Rs.74.3 billion, which was around 8% of total revenue of Pakistani news channels. But the major concern is that AbbTak News aired maximum number of minutes. It was around one lac twenty four thousand and the revenue was Rs.70 Billion and it got 8% of market share (Op cite, 2015). The difference of minutes and business in term of Rupees shows that the tariff of every channel is different. AbbTak News aired the highest minutes of commercial air-time but the revenue was on 6th position of all. Express News had around one lac
twenty three thousand minutes of commercial air-time but it had 1st position in term of revenue. If we analyze
the overall news channel minutes and revenue, we can say that Geo News was the most successful channel in 2014 because Geo News aired approximately sixty one thousand minutes of commercial air time, which was around 5% of total minutes of news channels and it had 18% market share in term of revenue. It means that the rate per minute and other inventories of Geo News were expensive than other news channels and Geo News cost per rating point (CPRP) was comparatively the highest. The same facts are highlighted in table 1 on the next page. Din News performance was very feeble in term of revenue and minutes as well. It aired only twenty three thousand minutes of commercial air time and gross business was Rs.3.8 billion and its overall market share was 1% (Media Monitors Pakistan, 2015).
Regarding telecom advertisement spending on news channels, five GSM companies are operating in Pakistan and they contribute around Rs.131 billion (Ibid, 2015). The major portion of their budgets they spent on Express News, which was Rs.28 billion Rupees. The total air-time they got on Express News inventory was approximately fourteen thousand minutes. It was around 20% of overall telecom industry’s budget for TV ads (Ibid, 2015). The telecom sector’s share in overall news channels was 14% in 2014. Telecom industry was one of major contributors in news channels revenue. If we analyze minutes spending, AbbTak News was also leading in minutes. Telecom sector got the maximum number of minutes on AbbTak News, while the major reason was the low rate. If the rate per minute is low and ratings are high, then a brand can easily measure its advertising return through cost per rating point (CPRP) formula. The major objective of media planners is to achieve CPRP (Banerjee, 2009). The overall analysis of this discourse is that the telecom sector is the main player of advertisement industry of Pakistan, but it availed all types of properties from news channels to create recall of related brands by delivering the messages. The major inventories were Loose Spot Placement and Program/News Sponsorship. The major spending of telecom sector was revolving around seven major news channels. It was Rs.113 billion. These channels compose of Express News, Geo News, Samaa, AbbTak, Duniya News, ARY News and Dawn News. These all are satellite channels and 86% news channels budgets were spread among them (Media Monitors Pakistan, 2015).
Table 1: TV Channels’ Share in Advertising Revenues
Source: Media Monitors Pakistan (2015)
S. No. TV Channels Revenue (in Pak Rupees) Market Share
(rounded)
1 Express News 179.3 billion 20%
2 Geo News 165 billion 18%
3 Duniya News 105 billion 12%
4 Samaa News 99.5 billion 10%
5 ARY News 74.3 billion 8%
6 AbbTak News 70.0 billion 8%
2.3 Brand Recall
Brand recall is the ability to remember the name of a particular brand. In addition, consumers may also recall its quality, features, benefits, assortment, maker or company, famous advertisements, promotional campaigns, etc. (Keller, 1993). Together brand recognition and brand recall constitute brand awareness (Aaker, 1991). In today’s competitive environment, domestic and international brands vie against each other for the market share. It tends to be very difficult to make the desired place in the market. Generally, frequent brand recall leaves a unique, positive, and strong association of a brand that enhances the chances of its success in terms of sales revenues and market share. Greater the brand awareness, greater is the repeat purchase (Hoyer and Brown, 1990). Brand recall adds substantial value to a brand in building its brand loyalty, brand equity, customer-based equity, and organizational or corporate equity (Keller, 1993; Keller & Lehmann, 2006). Hence, in this probe, brand recall is taken as the dependent variable.
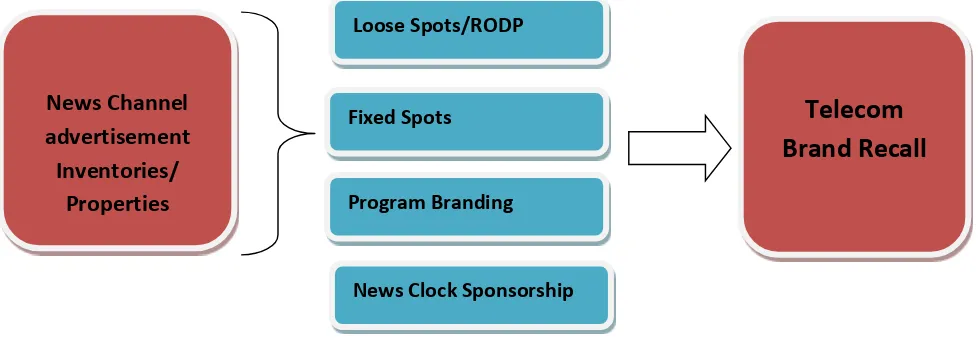
2.4 News Channels’ Inventories/Properties
The common and basic inventory/property of a TV channel is commercial air-time [CAT], (Bart, et al., 2014). From Pakistani media industry perspective, news channels have four common properties i.e. Loose Spots or Run of Daypart, Fixed Spots or Island Spots, News Clock Sponsorship, and Program Sponsorship or Slot Branding. Island Spots and News Clock Sponsorship are the familiar properties which are generally available only on news channels. The reason is that news channel air hourly news 24/7 and they provide branding opportunities to advertisers.
2.4.1 Loose Spot Placement or Run of Daypart (RODP)
Run of Daypart refers to as "daypart rotator," wherein a broadcast spot is purchased to air at any time within a defined daypart (Advertising Media Internet Community, 2011). It is a very basic and common property to advertise on any TV channel. They are TV commercials (TVCs) which are placed on TV within specific time periods of a day. A media planner suggests the time slots according to advertiser /clients views and three basic things are to be considered during the media planning that are: TV channel ratings, target audience of time slot or program and rate per minute. A commercial can be placed in any time slot and every time slot has different rate per minute. Duration of a commercial is very important because some TV channels are restricted to air the commercials as per their convenient duration. Hence, we formulate the hypotheses that:
H1a: Loose spots or daypart (RODP) has a significant and positive relationship with telecom brand recall. H1b: Loose spots or daypart (RODP) has a significant and positive impact on telecom brand recall.
2.4.2 Fixed Spots
Fixed Spots are also used along with Island Spots but they are two different types of inventories on TV channels; however they are used in an integrated fashion. Fixed Spot are that TV commercials whose position is confirmed by media suppliers (Banerjee, 2009). Generally news channels sell before and after news headlines for commercial spots on premium rates. There are more chances that a commercial will not be missed by viewers’ eyes. The return on investment (ROI) of fixed spots is generally better than that of loose spots (Qureshi, 2015). Island Spot is also a premium inventory of any TV channel. It is a single commercial which is aired during a TV program. It is not restricted to be aired in a commercial break. The term Island Spot is used because before and after of this spot not any single commercial be aired. Hence, we formulate the hypotheses that:
H2a: Fixed spot has a significant and positive relationship with telecom brand recall. H2b: Fixed spot has a significant and positive impact on telecom brand recall.
2.4.3 Program Branding/Sponsorship
In Pakistan, news channels are presenting variety of programs with up to 17 hours per day (Aurora, 2014). Some programs are live including news bulletin and some are recorded. From the past ten years, news channels tend to become infotainment channels not hard core news channels, which include political talk shows and often regularly aired "feel-good stories" or humorous reports. Generally, such a program’s duration is an hour with 20 minutes’ commercial breaks per hour. Program Branding or Sponsorship is based on opening and closing announcement. Branding announcement duration can be approximately 7 to 10 seconds along with commercial spot. Regarding the price of program branding or sponsorship, there is a practice by media planners and buyers; they get program sponsorship as value addition against spending of commercial air time. These announcements do not convey proper message of brand but it is very helpful tool to create brand recall (Stanglein, 2014), whereas the full ad is run after that. Hence, we formulate the hypotheses that:
2.4.4 News Clock Sponsorship
For media market in Pakistan and India, news trends are different than other countries. The most valuable property of any news channel is News Clock Sponsorship (Nidhi, Neelima, & Arjee, 2008). Majority of news channels air news bulletins on hourly basis. News channels brand their news through announcements and fix spots. Announcements tend to be like: “This hourly news clock is brought to you by XYZ” along with 10-second commercial tail. Commercial tail is a 7 to 10 10-seconds ending line of a commercial, which is used in the package of any sponsorship or branding. News channels charge a premium price on News Clock Sponsorship, but the mileage or benefit of this property is very high (Qureshi, 2015). Hence, we formulate the hypotheses that:
H4a: News clock sponsorship has a significant and positive relationship with telecom brand recall. H4b: News clock sponsorship has a significant and positive impact on telecom brand recall.
2.5 Conceptual Framework
The below mentioned model in figure 1 is adapted with the help of different research articles and literature review. The criterion variable is telecom brand recall and the predictors consist of: Loose Spots/RODP, Fixed Spots, Program Branding, and News Clock Sponsorship. These variables are very well depicted in the literature.
Figure 1: Conceptual Framework
3. RESEARCH METHODOLOGY
The philosophy of this research is post positivism. The positivist researchers believe that they can discover and understand some phenomenon based on experiences and observations. Concepts and knowledge are held to be the product of straightforward experience, interpreted through rational deduction. It is based on deductive approach. Deductive approach works from general solutions to the more specific ones. It might begin with thinking up a theory about the topic of interest and then narrows that down into more specific hypotheses that can be tested. Further when we garner observations to address the hypotheses, this ultimately leads us to be able to test the hypotheses with specific data in order to confirm the original theories (Newstead, 2004). This study follows the survey research strategy for data collections and uses quantitative technique and describes the relationship and impact of independent variables on the dependent variable (Saunders et al., 201).
This study relies on telecom consumers’ opinions and experiences regarding news channel advertisement and applies survey questionnaire for primary data collection. The setting of research is non-contrived and the data is collected from natural environment from telecom consumers to get their point of views. The data is collected through structured and close-ended questionnaire prepared on 5-point Likert scale to get their opinions regarding telecom advertisements on Pakistani news channels. The population of study is Pakistani telecom consumers which are 135,762,031 till December 2014 (Pakistan Telecommunication Authority, 2014). The sample size is 384 calculated and respondents are selected through non-probability convenience sampling calculator (Fox, 2009). The literature suggests that a pilot study sample should be 10% of the sample (i.e. 38 samples) projected for the larger parent study (Hertzog, 2008; Zailinawati, 2006). Pilot testing analyzes the important factors of questionnaire and ensures that the idea behind questions is more appropriate and relevant (Hassan, 2006). It allows eliminating any confusing items.
News Clock Sponsorship
Program Branding
Fixed Spots
Loose Spots/RODP
Telecom
Brand Recall
News Channel
advertisement
Inventories/
4. DATA ANALYSIS AND FINDINGS
This study uses three statistical tools for obtaining the results. The first one is reliability test to measure the internal consistency of scale. The second test is Correlation Analysis to find the relationship among the concerned variables and the third test is Regression Analysis to determine the cause and effect among variables. The alpha coefficient (in table 2) for the twenty items is .932, which indicates a high level of internal consistency for the scale with this specific sample.
Table 2: Reliability Statistics
Cronbach's Alpha N of Items
0.932 20
From the table 3 beneath, the Correlation analysis exhibits that all the variables are positively and significantly correlated with each other with the values ranging from (.292 or 29.2% to .528 or 52.8%). The independent variables are also correlated with the dependent variables. It describes that the independent variable Loose Spots and dependent variable Telecom Brand Recall have moderate relationship with a value of (.402 or 40.2%), whereas, there is slightly better correlation of Fixed Spots and dependent variable with a value of (.494 or 49.4%), Program Branding/Sponsorship shows week relationship with dependent variable with a value of (.371 or 37.1%), and News Clock Sponsorship is highly correlated with Telecom Brand Recall with a value of (.528 or 52.8%). With the help of correlation results, we fail to reject the four hypotheses, H1a, H2a, H3a, and H4a, because all four independent variables have a positive and significant relation with the dependent variable.
Table 3: Correlations
Brand Recall Loose Spots Fixed Spots
Program
Branding News Clock
Brand Recall Pearson
Correlation 1 .402** .494** .371** .528**
Sig. (2-tailed) 0 0 0 0
N 347 347 347 347 347
Loose Spots Pearson
Correlation .402** 1 .327** .323** .292**
Sig. (2-tailed) 0 0 0 0
N 347 347 347 347 347
Fixed Spots Pearson
Correlation .494** .327** 1 .329** .481**
Sig. (2-tailed) 0 0 0 0
N 347 347 347 347 347
Program Branding/ Sponsorship
Pearson
Correlation .371** .323** .329** 1 .329**
Sig. (2-tailed) 0 0 0 0
N 347 347 347 347 347
News Clock Sponsorship
Pearson
Correlation .528** .292** .481** .329** 1
Sig. (2-tailed) 0 0 0 0
N 347 347 347 347 347
**. Correlation is significant at the 0.01 level (2-tailed).
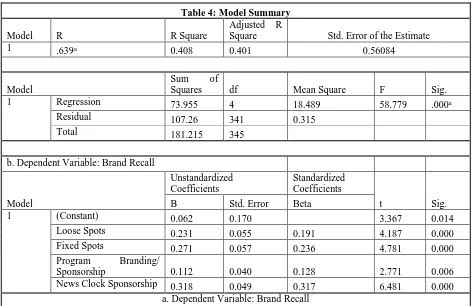
From the table number 4 on the next page, the "R" column represents the multiple correlation coefficient. Its value is (.639 or approximately 64%) that indicates a good level of prediction of the dependent variable. The R2
value is (.408), it means that the independent variables explain the dependent variable by (40.8%). The "Adjusted R Square" (adj. R2) value stands (.401 or 40%) that appears very close to "R Square" value. The test
Table 4: Model Summary
Model R R Square
Adjusted R
Square Std. Error of the Estimate
1 .639a 0.408 0.401 0.56084
Model
Sum of
Squares df Mean Square F Sig.
1 Regression 73.955 4 18.489 58.779 .000a
Residual 107.26 341 0.315
Total 181.215 345
b. Dependent Variable: Brand Recall
Model
Unstandardized Coefficients
Standardized Coefficients
t Sig.
B Std. Error Beta
1 (Constant) 0.062 0.170 3.367 0.014
Loose Spots 0.231 0.055 0.191 4.187 0.000
Fixed Spots 0.271 0.057 0.236 4.781 0.000
Program Branding/
Sponsorship 0.112 0.040 0.128 2.771 0.006
News Clock Sponsorship 0.318 0.049 0.317 6.481 0.000
a. Dependent Variable: Brand Recall
4.1 Discussion of Results
The results of this study are supporting the argument which we developed in the early stage of this probe that TV channels have a major chunk of business in Pakistani media market and especially news channels are playing a significant role in it. We took the four major inventories of news channel and tested their relationship and impact on telecom brand recall, as the telecom sector is a key spender in advertisement industry of Pakistan. Therefore, the object of any advertising campaign is to target potential buyers or consumers. This study raised four major questions about news channels inventories. First question was seeking about the telecom consumers’ opinion towards recall of telecom brands advertisements on news channels. Second question was elaborating the overall efficiency of news channel inventory. The third one about which inventory plays the most effective role towards telecom brand recall. And the fourth one inquired about the relationship and impact of the independent variables with the dependent variables. The results of the questionnaire survey are depicting the telecom consumers’ opinions regarding news channels advertising.
5. CONCLUSION, RECOMMENDATIONS, AND AREAS OF FUTURE RESEARCH
This probe resolves its research problem, answers its queries, and fulfills its objectives. A questionnaire-based survey was conducted from consumers to inquire about their brand recall concerned with telecom sector brands and to discover the role of advertising inventories on their recall. It is concluded that the consumers find it easy to recall a brand of telecom sector if it is aired on news TV channels, since they are frequently watched. The news channels are the primary media of above the line advertising and it is playing very significant role in electronic media market. The analytic tools consisted of Cronbach Alpha test, Correlation Analysis, and Multiple Regression Analysis. The aggregate results led to acceptance of the study hypotheses.
From the Correlation matrix and Regression analysis, it was found that news clock sponsorship has the highest relationship and impact on telecom brand recall, and then fixed spots and loose spots have relationship and impact on it respectively, whereas program branding has the least link and effect on it. The extant literature also supports this argument because normally advertisers get any program branding or sponsorship as a value addition of any campaign. It is just a brief announcement of a brand, usually along with its display. Advertisement clutter is another issue on news channels screen. Fixed spot is one of the prominent inventories to break the clutter. The position of a commercial is decided by the client and advertiser or media concerned, who places it at a fix position. The visibility of fix spot is highly rated and there is very minimal chance to miss it from audience end. The results of this probe are also supporting this argument which was developed at its early stage. Generally advertisers place their fixed spots before and after the news headlines, because viewership of news headlines of any news channel is very high in comparison with the other time slots. Loose spots or run of daypart (RODP) is a very basic and common inventory of any TV channel. Its cost and viewership vary according to time slots, the primetime has higher viewership with higher rates and non-prime slots have relatively low rates with minimal viewers’ ratings. In addition to commercial clutter, another problem advertisers are facing in RODP is that news channels frequently drop their commercial spots due to breaking news and excess of commercials airtime in different time slots. However, fixed spot and program branding and news clock sponsorships are the inventories which can compensate regarding these issues. The news clock sponsorship is the most premium inventory of any news channel, if a telecom brand buys it, it will be the most beneficial, because it has been proved to be the most effective property and normally news audience do not miss to watch news clock. Hourly news clock ratings and cost are comparatively higher than other time slots, but it is the most helpful property to build telecom brand recall.
Following are few recommendations which can be helpful for advertisers, media planners and buyers to get their desired results and to earmark their budget spending in the right direction.
Hourly news clock sponsorship is the most effective property for advertisements; it has the best recall value as compared to the other inventories. Telecom brands need to purchase it on quarterly or half yearly basis; as it is the premium inventory for any news channel and it is not easily available. Fixed spots are the second most effective inventory and it should be obtained as the second priority. If advertisers need proper brand recall of their commercials then they should spend 40% of their news channels’ budgets on Run of Daypart (RODP) and the remaining 60% on other inventories, because the ads will keep airing on different time slots. Program branding is not a high impact inventory, media buyers should try to get it as a value addition from news channels.
The areas of future research include: it incorporates only four common inventories/properties of news channels. Hence, in future, new independent variables can be tested to explore this area in more detail. This research is limited to telecom brand recall; researchers can also take other dependent variables and sectors with enhanced number of samples and geographic regions to check the impact of news channels inventory. Brands from fast moving consumer goods (FMCGs), financial sectors, automobiles, etc. are also floating their advertising budgets heavily on Pakistani news channels. Qualitative studies can also be conducted to gauge advertisers’ insights as this study is based on consumers’ point of view only. Though the data is available that which news channels are market leaders or that have relatively higher viewership, it can be ascertained that in the News Clock inventory, which time slots can be the best for advertisers.
REFERENCES
1. Aaker, D. A. (1991). Managing Brand Equity, The Free Press, New York.
2. Advertising Media Internet Community. (2011). Common Television Advertising Terms. Retrieved Feb 27, 2015, from AMIC.com: http://www.acronymattic.com/RODP.html
4. Banerjee, R. (2009, Sep 9). Media measurements: Cost per rating point vs cost per thousand. Retrieved Feb 23, 2015, from The Economic Times: http://articles.economictimes.indiatimes.com/2009-09-09/news/27643157_1_cpts-media-agencies-ad
5. Bart, Y., Andrew, T., Stephen, & Sarvary, M. (2014). Which products are best suited to mobile advertising? A field study of mobile display advertising effects on consumer attitudes and intentions.
Journal of Marketing Research, 51(3), 270-285.
6. Brasel, S. A. & Gips, J. (2014). Enhancing Television Advertising: Same-language Subtitles Can Improve Brand Recall, Verbal Memory, and Behavioral Intent. Jounal of Advance Marketing Science,
42(3), 322-336.
7. Connell, M. B. (2014). How Childhood Advertising Exposure Can Create Biased Product Evaluations That Persist into Adulthood. Journal of Consumer Research, 41(1), 24-26.
8. Etzell, W. B. (2008). Marketing- Concepts and Cases. New Delhi: Tata Macgraw. 9. Field. (2005). Discovering statistics using SPSS. London: Sage.
10. Fox, N. (2009). Sampling and Sample Size Calculation. The NIHR Research Design Service, 6-7. 11. Heckler, S. E., Keller, K. L., Houston, M. J., & Avery, J. (2014). Building brand knowledge structures:
Elaboration and interference effects on the processing of sequentially advertised brand benefit claims.
Journal of Marketing Communications, 20(3), 176-196.
12. Hertzog. (2008). Considerations in determining sample size for pilot studies. Research in Nursing & Health, 180-190.
13. Hoyer, W. D., & Brown, S. P. (1990). Effects of brand awareness on choice for a common, repeat-purchase product. Journal of Consumer Research, 141-148.
14. Nidhi, K., Neelima, G., & Arjee, D. (2008). Impact of T.V on Buying Pattern of Adolescent Girls.
Journal of Social Sciences, 4(2), 51-55.
15. Kavitha. (2008). A Study On The Effectiveness Of The Advertising Techniques Used In The Personal Care Segment Of Women Consumers. Indian Journal of Marketing, 36(8), 12-16.
16. Keller, K. L. (1993). Conceptualizing, measuring, and managing customer-based brand equity. The Journal of Marketing, 1-22.
17. Keller, K. L., & Lehmann, D. R. (2006). Brands and branding: Research findings and future priorities. Marketing Science, 25(6), 740-759.
18. Medialogic. (2015). An Overview of Medialogic Pakistan. http://www.casbaa.com/advertising/resources/partners/medialogic
19. Media Monitors Pakistan. (2015). An Overview of Media Monitors Pakistan. www.mediamonotors.com.pk/
20. Newstead, H. (2004). Individual differences in deductive reasoning. The Quarterly Journal of Experimental Psychology, 33-60.
21. Pakistan Telecommunication Authority. (2015). An Overview of Pakistan Telecommunication Authority. Retrieved Feb 18, 2015, from www.pta.gov.pk:
http://www.pta.gov.pk/index.php?Itemid=599
22. Qureshi, S. (2015). Advertising inventory valuation at Starcom. 23. Ramaswami, N. (2004). Marketing Management. India: MACMILLAN.
24. Sashidhar, A. (2006). Advertising to Kids Is It Justified? Advertising Express , 12-16.
25. Saunders, M., Lewis, P., & Thornhill, A. (2011). Research Methods for Business Students, 4th ed.,
Delhi, Pearson Education Limited.
26. Saxena. (2005). Marketing Management. New Delhi: Tata Mc Graw.
27. Srinivasa, D. A. (2008). Advertisements Do They Match Consumer Preferences? Marketing Mastermind, 59-62.
28. Stanglein, M. D. (2014). Internet Versus Television Advertising: A Brand-Building Comparison.
Journal of Marketing Research, 578-590.
29. Walker, S. (2008). TV Advertising Prices. Retrieved Januaray 29, 2014, from Suite.io: https://suite.io/scott-walker/t7f223
30. Zailinawati, H. (2006). Doing a Pilot Study: Why is it essential? Malaysian Family Physician. Kuala Lumpur.