* To whom all correspondence should be addressed. Fax: +98 21 82884931; Tel.: +98 21 82884917; E-mail: [email protected]
Process Optimization and Modeling of Anaerobic
Digestion of Cow Manure for Enhanced Biogas Yield in a
Mixed Plug-flow Reactor using Response Surface Methodology
Majid Rasouli1*, Yahya Ajabshirchi2, Seyyed Mohammad Mousavi3,
Mohsen Nosrati4 and Soheila Yaghmaei5
1Department of Biosystem Engineering, Faculty of Agricultural Engineering, University of Tabriz, Tabriz, Iran.
2 Department of Biosystem Engineering, Faculty of Agricultural Engineering, University of Tabriz, Tabriz, Iran.
3 Biotechnology Group, Chemical Engineering Department, Tarbiat Modares University, Tehran, Iran.
4 Biotechnology Group, Chemical Engineering Department, Tarbiat Modares University, Tehran, Iran. 5 Department of Chemical and Petroleum Engineering, Sharif University of Technology, Tehran, Iran.
DOI: http://dx.doi.org/10.13005/bbra/1909
(Received: 12 May 2015; accepted: 10 July 2015)
Pilot scale experiments were performed on the digestion of dairy cow manure in a semi-continuous process using a mixed plug flow reactor (MPFR) to determine the effects of organic loading rate (OLR), temperature and mixing levels on production biogas and methane yield. Response surface methodology (RSM) was applied for the design and analysis of experiments with the optimization of OLR, temperature and mixing level during the biogas production process. Experiments were designed as per the central composite design technique. Four cubic mathematical models were derived for prediction of the responses. The optimization study has been carried out to identify the highest yields achievable when the factors temperature and mixing are minimized. In process optimization, maximum values of biogas production and methane yield were achieved as 0.570 m3/m3 day and 0.113 m3/kgVS added, respectively, with an OLR of 3.15 kgVS/m3 day,
temperature of 37.66 °C and mixing regime of 20.32 rpm for 10 min per 2 hours.
Keywords: Anaerobic digestion; Bio-gas; Mixed plug flow reactor (MPFR); Response surface methodology (RSM); Optimization.
Environmental contamination is one of the most serious problems of the world existence face in the 21 century. We are also faced with the consequences of climate change, increased global demand on fossil fuels, energy insecurity, and continual exploitation of limited natural resources
1. The International Panel on Climate Change
(IPCC) and World Energy Council (WEC) have estimated the consumption of energy in 2100 will be 3-fold and 4.2-fold higher than in 1990, providing a high demand respectively 2.
animal waste management option is biotechnology of anaerobic digestion 3.
Biotechnology of anaerobic is a eco-friendly procedure that integrates waste treatment with the recuperation of advantageous by products and renewable bioenergy 1, 4, and suggestion a its
several environmental and economic advantage, it will make better the health of users, decreasing pathogen and organic waste, could be a sustainable source of bioenergy, advantages the environment and prepared a way to treatment and reuse various wastes-animal, human, agricultural, municipal and industrial 5.
Several previous anaerobic digestion studies were conducted on Taiwanese-model, which are plug-flow systems and are not heated, or contain any mixed mechanisms 6, 7. There have
been only few studies on bio-gas production were conducted on mixed plug flow reactor (MPFR) 8.
Plug-flow reactors are limited to applications with low amounts of dirt, sand, or grit, because these substances will leaning to laminate and settle out inside the reactor, requiring significant endeavor to clean out 9, 10. After five years of operation, a
plug-flow reactor in New York was discharge for a compulsive repair. During this process it was found that settled solids and crusting had decreased the operational volume of the reactor by 16% 11.
Plug-flow reactors are also subject to crusting, the result of lighter solids floating to the top of the slurry in the reactor and drying to form a skin 9. In this study,
a mixed plug flow reactor set-up was used to avoid problems with a thick/rigid floating layer or large amounts of sediments. Mixing conditions are: 1) No axial mixing (in the flow direction), 2) perfect radial mixing (perpendicular to the flow direction). According to previous research, the performance of animal waste-fed anaerobic digesters is affected by important process parameters such as the temperature 12, 13, organic
loading rate (OLR) 14, and mixing regime 15.
In the past literature, The technique of RSM has been used to optimize, evaluate and analyze the interactive effects of autonomous agents in numerous biochemical, bioenvironmental processes and chemical , but its use to the modeling of anaerobic digestion processes and analysis has been presented only few studies 16, 17.
In this study, unlike most of the previous anaerobic digestion research, the RSM was applied to model
the process and analyze with respect to the synchronous effects of four parameters (methane yield, methane production, gas yield and bio-gas production) and three operating variables (temperature, organic loading rate (OLR) and mixing regime) were assessed as responses. The significant factors and a continual response surface of the main parameters were developed to provide an optimal area that fulfils the process specifications. The concept of RSM is that of sequential experimentation for building appropriate models that enable one to understand the engineering system. The target of RSM to accomplish a map of response, either in the form of contours or as a 3-D rendering 18, 19.
The objectives of this research were to explore the effect of temperature, organic loading rate and different mixing regime on anaerobic digestion of cow dung in mixed plug-flow reactor using response surface methodology, propose models, and try to find the optimum conditions for maximizing bio-gas production rate and methane yield.
MATERIALS AND METHOD
Substrate Collection and Preparation
Fresh cow dung used in the present study was obtained from a dairy farm with 100 cows located in Divin (a village in Hamadan Province, Iran). The dung was screened to take away coarse materials such as straws and other large fibrous materials. The screened manure was collected in a 100 L tank, diluted with water to obtain the desired solid concentration and then mixed thoroughly.
Analytical methods
Total solids (TS), total Kjeldahl nitrogen (TKN) volatile solids (VS), pH, , total organic carbon (TOC), phosphorus and potassium were distinguished pursuant to standard procedure 20.
The pH was measured applying the Metrohm 620 pH meter (Metrohm Inc., Germany). Bio-gas flow rate was measured using a diaphragm gas meter G4-AL 25cm (E.G.C Inc., Iran). Methane concentrations in bio-gas were distinguished with a Figaro TGS 2611 methane sensor (FIGARO Inc., USA).
Experimental setup
volume of 1.35 m3 and working volume of 0.9 m3
and was operated semi-continually with daily manure feeding for 15 days hydraulic retention time. The MPFR was made with a cylindrical in shape, entirely of stainless steel (INOX 316), 350 cm in length, and external and internal diameters of 73 and 70 cm, respectively. the ratio of diameter to the length of digester was about 1:5 that is apperceived generally in the plug-flow systems 9.
An electric motor-driven, flat-bladed turbine impeller was used to mix the contents of the mixed plug flow reactor and enables smooth homogenization, re-suspension of heavier material, optimal degassing and temperature distribution. The impeller had 32 blades and operated at 20-100 rpm range. A thermostatically controlled electric heating strip attached to the outer surface of the reactor was used to maintain the temperature in the digesters at the desired levels. The glass wool was used on the surface of the reactor to be insulated and minimize the heat losses from the surface. The temperature was monitored with an
excavatorconjunct to a sender. The feedstock was stored in a tank and 60 L/day were fed to the reactor via an electro submersible slurry pumps. Fig. 1 shows picture and schematic of the mixed plug flow pilot-measure anaerobic digestion system.
Reactor start-up and operation
For start-up, the reactor was filled up with 900 L of feed consisting of 88% and 22% (v/v) of water and cow dung respectively (similar run 1), and was operated anaerobically at a batch mode for 16 days. The reactor was subsequently switched to continual mode at the designated HRT (15 days). The reactor was then operated according to design of experiment (DOE) for 271 days.
Experimental designs
We investigated factors influencing bio-gas and methane production and optimized the conditions for uttermost bio-gas and methane production and methane yield using central composite design (CCD) and response surface methodology (RSM).
Response surface methodology consists of an accumulation of statistical and mathematical techniques that are based on the fitting of an suitable empirical model, generally a first- or a second- order polynomial model, to observed responses which depend on a number of
explanatory variables in order to investigate the nature of the response surface in the proximity of the optimum operating conditions and evaluate the relative importance of several affecting factors, even in the attendance of complex interactions 18, 19, 21.
Central composite design is the most popular response surface method for fitting second-order models 19, 22, which was used in the present study
to design of the experiment (DOE). Full uniformly routable central compound designs contain the following experimental runs: (1) a 2k full factorial
runs during which factors are studied at +1 and -1 levels; (2) a nc center points that all factors are at their center levels, that aids in specifying the curvature, and repetition helps to approximate pure error; and (3) a 2k axial or star points, that are exactly to center point, but one factor takes the values above and below the median of the two factorial levels, generally both outside their range (at a distance α from its center). Axial points create the design rotatable 19, 21. Three independent factors
and their levels were used in the CCD are presented in Table 1.
Therefore, 18 experiments were conducted, according to N=k²+2k+cp, where k is the factor number and cp is the replicate number of the central point. Each factor was varied at five levels (-, -1, 0, +1, +). -values depend on the number of variables and can be calculated by. For three variable, it is 1.68 21. Table 2 presents the coded
and actual values of the experimental matrices for the application of these designs, sorted by standard order. Model parameters were estimated using a cubic equation as follows 23:
ε β β β β β β β β + + + + + + + + =
∑
∑
∑
∑
∑
∑
∑
<< <<< < < = < < = = k n j i n k j i j i ijk j i ijj n j i j i iij n i i iii n j i j i ij n i i ii n i i i x x x x x x x x x x x x Y 1 1 2 1 2 1 3 1 1 2 1 0
where Y is the expected value of the response variable, k is the number of variables, β0, βi, βii, βij, βiii, βiij, βijk, are the model parameters, xi, xj, xk are the coded factors evaluated and ε residual associated to the experiments.
RESULTS AND DISCUSSION
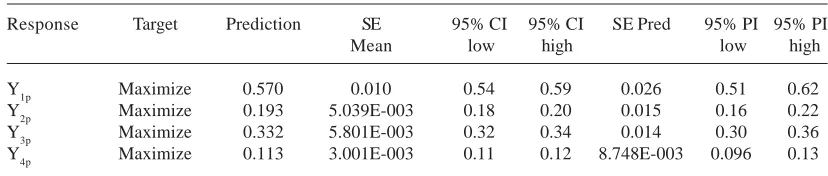
The characteristics of the substrate used The characteristics of the substrate (Cow dung), used for this study are as shown in Table 3.
Central composite design and fitted regression models
The CCD for current study utilized a 23=8
(i.e., three factors) full factorial design completed by 2×3=6 axial points at (±α, 0, 0, … , 0), (0, 0, ±α, … , 0), … , (0, 0, 0, … , ) and 4 center points at (0, 0, … , 0), where is the distance of the axial point from the center. Random error (standard deviation) is estimated from the center points. The choice of establishes the central composite design rotatable. The distance of the axial points from the center point is calculated by. For three-factor design variable, it is 1.68. Therefore, 18 (8 factorial points + 8 axial points + 6 center points) run were
implementation to satisfy a central composite design. The RSM coded and actual design matrix, sorted by standard order, and the corresponding results of CCD experiments to distinguish the effects of the three independent variables are shown in Table 2.
The reduced cubic correlations associated to the response in terms of coded factors distinguished by the software can be written as follows (Eqs. (2)– (5)):
Y1p = 0.51+0.15A+0.050B+0.042AB-0.047A2-0.12B2
-0.034C2+0.089A2B-0.077AB2 ...(2)
Y2p = 0.20+0.020B-0.018A2-0.044B2-0.011C2+
0.038A2B-0.025AB2 ...(3)
Y3p = 0.31+0.079A+0.025B+0.020AB-0.036A2
-0.072B2-0.022C2+0.050A2B-0.045AB2 ...(4)
Y4p = 0.12+9.809E-003B-0.012A2-0.028B2
-7.448E-003C2+0.022A2B-0.018AB2 ...(5)
where Y1p, Y2p, Y3p and Y4p are,
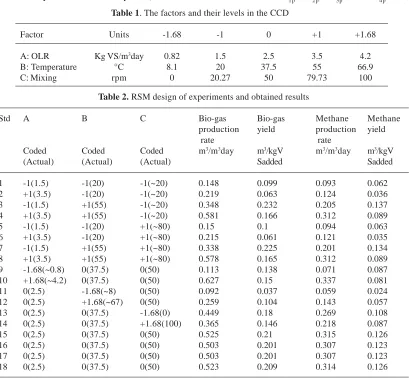
Table 1. The factors and their levels in the CCD
Factor Units -1.68 -1 0 +1 +1.68
A: OLR Kg VS/m3day 0.82 1.5 2.5 3.5 4.2
B: Temperature °C 8.1 20 37.5 55 66.9
C: Mixing rpm 0 20.27 50 79.73 100
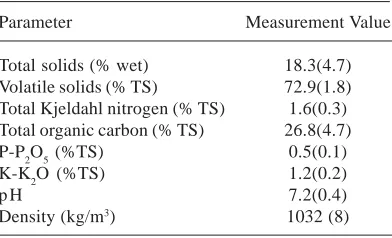
Table 2. RSM design of experiments and obtained results
Std A B C Bio-gas Bio-gas Methane Methane
production yield production yield
rate rate
Coded Coded Coded m3/m3day m3/kgV m3/m3day m3/kgV
(Actual) (Actual) (Actual) Sadded Sadded
1 -1(1.5) -1(20) -1(~20) 0.148 0.099 0.093 0.062
2 +1(3.5) -1(20) -1(~20) 0.219 0.063 0.124 0.036
3 -1(1.5) +1(55) -1(~20) 0.348 0.232 0.205 0.137
4 +1(3.5) +1(55) -1(~20) 0.581 0.166 0.312 0.089
5 -1(1.5) -1(20) +1(~80) 0.15 0.1 0.094 0.063
6 +1(3.5) -1(20) +1(~80) 0.215 0.061 0.121 0.035
7 -1(1.5) +1(55) +1(~80) 0.338 0.225 0.201 0.134
8 +1(3.5) +1(55) +1(~80) 0.578 0.165 0.312 0.089
9 -1.68(~0.8) 0(37.5) 0(50) 0.113 0.138 0.071 0.087
10 +1.68(~4.2) 0(37.5) 0(50) 0.627 0.15 0.337 0.081
11 0(2.5) -1.68(~8) 0(50) 0.092 0.037 0.059 0.024
12 0(2.5) +1.68(~67) 0(50) 0.259 0.104 0.143 0.057
13 0(2.5) 0(37.5) -1.68(0) 0.449 0.18 0.269 0.108
14 0(2.5) 0(37.5) +1.68(100) 0.365 0.146 0.218 0.087
15 0(2.5) 0(37.5) 0(50) 0.525 0.21 0.315 0.126
16 0(2.5) 0(37.5) 0(50) 0.503 0.201 0.307 0.123
17 0(2.5) 0(37.5) 0(50) 0.503 0.201 0.307 0.123
Table 3. Characteristics of fresh cow dung (before diluted) used in the experiments
Parameter Measurement Value
Total solids (% wet) 18.3(4.7)
Volatile solids (% TS) 72.9(1.8)
Total Kjeldahl nitrogen (% TS) 1.6(0.3)
Total organic carbon (% TS) 26.8(4.7)
P-P2O5 (%TS) 0.5(0.1)
K-K2O (%TS) 1.2(0.2)
p H 7.2(0.4)
Density (kg/m3) 1032 (8)
Parameter mean and standard deviation (Values in parentheses) are comprised of 3 data points. Manures were sampled in June, July, and August, 2014.
Table 4. Statistical results of the ANOVA for response surface models
Statistical result Y1p Y2p Y3p Y4p
Model F-value 123.55 52.15 121.81 52.92
Model p-Value < 0.0001 < 0.0001 < 0.0001 < 0.0001
Lack of fit F-value 5.04 10.41 13.23 30.57
Lack of fit p-Value 0.1063 0.0399 0.0291 0.0086
R-Squared 0.9910 0.9660 0.9908 0.9665
Adj R-Squared 0.9830 0.9475 0.9827 0.9482
Pred R-Squared 0.9129 0.5920 0.9315 0.6522
Std. Dev 0.023 0.014 0.013 8.217E-003
C.V% 6.43 9.24 6.23 9.32
Adeq precision 19.521 18.331 29.877 19.516
respectively, predicted bio-gas production rate, bio-gas yield, methane production rate and methane yield and; A is organic loading rate; B is temperature; and C is mixing.
The statistical significance of the model equations (Eqs. (2)– (5)) was evaluated by the F-test for analysis of variance (ANOVA), which indicated that the regressions were statistically significant. As shown in Table 4, the ‘Prob > F’ value for the models were <0.0001 (p-value < 0.05), which indicates that the models were statistically significant with a confidence interval of 99.99%. The model F-values (123.55 for Y1P, 52.15 for Y2P, 121.81 for Y3p and 52.92 for Y14) imply that the models were significant and that there was only a 0.01% chance that a ‘Model F-value’ could occur because of noise. The actual and the predicted bio-gas and methane production are shown in Fig. 2. Actual values are the measured response data
for a particular run, and the predicted values are evaluated using the approximating functions generated for the models (Eqs. (2)– (5)). The adjacency of the points to the 45æ% line shows that
the models are appropriate for predicting the responses. The quality of fit of the model equations (Eqs. (2)– (5)) were expressed by the coefficient of determination (R2). The coefficient of determination
(R2) provided the proportion of the total variation
in the response variable described by the predictors included in the model. The relatively high R2 values
indicated that the reduced cubic models for the bio-gas and methane production rate, bio-gas and methane were very capable of representing the system under the given experimental domain. Adequate precision is a measure of the range of the predicted response relative to its associated error or, in other words, a signal-to-noise ratio. Its desired value is four or more 24. The adequate
precision value was found to be in the range of 18.33-29.88, which indicates good model discrimination (Table 4). However, low response values for the coefficients of variation (CVs) indicated good accuracy and dependability of the experiments. As a general rule, a model can be considered reasonably reproducible if the CV is not greater than 10%.
factors for the reduced cubic model (Y1p) are shown in Table 5. According to the p-values of the model terms, independent variables A (organic loading rate) and B (temperature), interaction variable AB, quadratic variables A2, B2 and C2, cubic variables
A2B and AB2 were taken as significant terms and
the insignificant terms were dropped from the model. The correlation adequacy was tested by the F-test for lack of fit 19. The lack of fit F-statistics
were not statistically significant because the p -values (0.1063) were greater than 0.05.
According to the p-values of the model terms (data not shown), independent variables A (organic loading rate) and B (temperature), interaction variable AB, quadratic variables A2, B2
and C2, cubic variables A2B and AB2 are common
significant terms in Y1p and Y3p fitted models. These terms have high effect in obtaining the optimized condition in which bio-gas and methane production rate are as high as possible. Independent B (temperature), quadratic variables A2, B2 and C2, cubic variables A2B and AB2 are the
most significant factors affecting the bio-gas and
methane yield (Y2p and Y4p).
Interpretation of Contour plots and 3D response surfaces
Using Design Expert software, contour plots and 3D surface plots were generated to find the optimum operating conditions of the anaerobic digestion process for cow dung in a mixed plug flow reactor. Contour and surface plots are useful for establishing desirable response values. A contour plot provides a two-dimensional view where all points that have the same response are connected to produce contour lines of constant responses. A surface plot provides a three-dimensional view that may provide a clearer picture of the response surface 25. Fig. 3 and Fig. 4(a) show
the three-dimensional response surfaces of bio-gas production rate and methane yield as well as contour plots of the relationship between different parameters at the optimized values. According to the models, interactions between variables have significant effects on the responses; therefore, results were presented and discussed in terms of interactions. Organic loading rate (OLR) and
Table 5. ANOVA for Response Surface Reduced Cubic Model (Bio-gas production rate)
Source Statistics
SS Df MS F-value p-Value
Model 0.54 8 0.067 123.55 < 0.0001
A 0.13 1 0.13 242.32 < 0.0001
B 0.014 1 0.014 25.57 0.0007
AB 0.014 1 0.014 26.04 0.0006
A2 0.028 1 0.028 51.60 < 0.0001
B2 0.17 1 0.17 311.83 < 0.0001
C2 0.015 1 0.015 26.95 0.0006
A2B 0.027 1 0.027 48.67 < 0.0001
AB2 0.019 1 0.019 35.75 0.0002
Residual 4.906E-003 9 5.451E-004 -
-Lack of Fit 4.463E-003 6 7.439E-004 5.04 0.1063
Pure Error 4.430E-004 3 1.477E-004 -
-Cor. Total 0.54 17 -
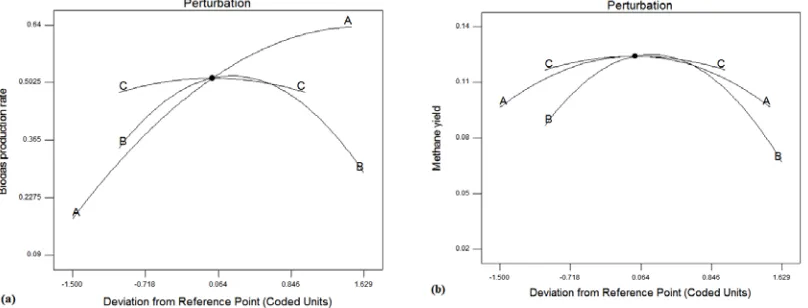
-Table 6. Point prediction of the responses at the optimal conditions
Response Target Prediction SE 95% CI 95% CI SE Pred 95% PI 95% PI
Mean low high low high
Y1p Maximize 0.570 0.010 0.54 0.59 0.026 0.51 0.62
Y2p Maximize 0.193 5.039E-003 0.18 0.20 0.015 0.16 0.22
Y3p Maximize 0.332 5.801E-003 0.32 0.34 0.014 0.30 0.36
Fig. 1. Picture and schematic of the mixed plug flow pilot-measure anaerobic digestion system
Fig. 2. Predicted vs. actual plot for: (a) bio-gas production rate and (b) methane yield
Fig. 3. Contour plots (a) and Response surface plot (b) showing the effect of Temperature and OLR on bio-gas production rate at mixing=50 rpm
temperature are shown to have major effects on the bio-gas production rate and methane yield, as shown in the results.
The perturbation plot in Fig. 5 (a and b) shows that factors OLR, temperature and mixing
Fig. 4. Response surface plots (a) the effect of temperature and OLR on methane yield at mixing=50 rpm, (b) the effect of mixing and OLR on methane yield at 37.5 °C
Fig. 5. Perturbation plot showing the effect of process parameters on bio-gas production rate (a) and methane yield (b) Effect of temperature on response
Fig. 3 and Fig. 4(a) illustrates the effects of temperature and OLR on bio-gas production and methane yield. Increasing the temperature from 20 °C to 37.5 °C or decreasing it from about 66 °C to 55 °C has a consistent positive effect on the bio-gas production rate and methane yield. Therefore in the case of bio-gas production rate and methane yield, the desirable temperatures are around either 37.5 °C or 55 °C. The average volumetric bio-gas production rate for reactor operation at 20 °C (3.5 kgVS/m3dayOLR) was 0.217 m3/m3day with a yield
of 0.036 m3 CH
4/kgVS added, whereas for operation
at 55 °C the volumetric bio-gas production rate increased by 62.59% (to 0.580 m3/m3day with a
yield of 0.089 m3 CH
4/kgVS added). As to be
expected, the volumetric bio-gas production rate and methane yield decreased as the temperature was degraded. The methane production rate and bio-gas yield followed the same pattern.
Nevertheless, an increase of the temperature in the reactor to 67 °C caused an instant drop in the volumetric bio-gas production and a change in the quality of bio-gas (55% methane). This result is in accordance with other investigations. Ahring, Ibrahim 12, showed that the consequence of the
temperature shift from 55 to 65 °C is a lower methane yield (165 ml/gVS day compared to 200 ml/gVS day at 55 °C).
Clearly, the anaerobic digestion is a process that is strongly dependent on temperature. On the other hand, the methane content in the bio-gas increased at low temperature. The methane content in the bio-gas increased from 59.3% to 63% between 55 and 20 °C (at 1.5 kgVS/m3day
OLR), which partly counteracted the decrease in volumetric bio-gas production rate. Similar results were obtained by Alvarez and Lidén 26, Hansen,
Angelidaki 27 and Zeeman, Wiegant 28, where the
is reduced compared to mesophilic and thermophilic reactors treating cow dung.
Effect of OLR on response
The effect of varying the organic loading rates on the bio-gas productivity in anaerobic digestion was studied. According to the result, digesters’ performance in terms of daily bio-gas production would improve by increasing the OLR above 1.5 kgVS/m3day (Fig.4). However, the
digesters with higher OLR values were more sensitive. Fluctuating behavior caused difficulties in stabilizing the experiments with high VS add-up in the feed (in experiments 4, 8, 6, 2, 10). Similar behavior has been reported previously 29-31.
On the other hand, bio-gas and methane yields decrease with increased in organic loading rate from 1.5 to 4.2 kgVS/m3day (see also Fig. 4(a)).
The uttermost bio-gas and methane yield of 0.232 and 0.137 m3/kgVS added was obtained at 1.5 kgVS/
m3day OLR. These results are in accord with 31 an
apparent decrease in the methane content was observed after the OLR increase. The lowest recorded value was 53.7% at 4.2 kgVS/m3day OLR.
The observed results suggest that the uttermost OLR value occurs between 1.5 and 2.5 kgVS/m3day
for a system digesting dairy cow dung at temperatures between 20 and 37 °C and between 2.5 and 3.5 kgVS/m3day for a system digesting
dairy cow dung at temperatures between 37 °C and 55 °C.
Effect of mixing levels on response
The effect of intermittent mixing (20, 50, 80 rpm for 10 min per 2hr), continual mixing (100 rpm) and non-mixing on bio-gas production was investigated. Results from the present study showed that impeller mixing strategies and intensities affect process performance and bio-gas production during anaerobic digestion of dairy cow dung. Pilot-measure studies in MPFR showed that intermittent mixing improved bio-gas production compared to continual mixing or non-mixing (Fig. 4(b)). These results are in accord with Kaparaju, Buendia 15 and Stroot, McMahon 32. The improved
bio-gas production under intermittent mixing compared to continuous mixing in the pilot-measure plant can be attributed to better solids and biomass retention in the reactor 15. On
comparison to continual mixing, intermittent and non- mixing strategies improved bio-gas productions by 28.99% and 18.71%, respectively. On the other hand, the data obtained showed that at intermittent mixing, the degree of mixing (20, 50, 80 rpm) did not affect the bio-gas production and operation of the reactor. For the three conditions studied, reactor operation was almost identical with similar bio-gas production.
Desirability=0.803
The highest methane yield obtained in the present study for dairy cow dung is 0.137 m3CH
4/kgVS added. Previous anaerobic digestion
studies on cow dung report methane yields of 0.1 m3CH
4/kgVS added
31, 0.148 m3CH
4/kgVS added 33
and 0.16 m3CH
4/kgVS added
34 . The reason of
different is likely caused by the differences in manure composition and bioreactor operating conditions which affects the degradation process.
Process optimization
In order to anticipation the best factor levels that will maximize the bio-gas and methane production and yield; the optimizing function include the maximization of Y1p, Y2p, Y3p and Y4p, but it is restricted from an economical point of view (minimum temperature and mixing). A numerical optimization provided by Design-Expert was employed to the RSM dataset, followed by a ramps of the numerical optimization. The numerical study will offer the ideal factor levels to attainment the uppermost the methane and bio-gas production and yield, while the ramps of solutions tool investigation will result in a ramp that associates the factor levels to an area of main target defined by the user. In the numerical optimization, levels of significance were assigned to each factor and response criteria. Factors temperature and mixing were minimized with importance 4, while the four responses were maximized with importance 5. Factor OLR was left in the same range as the experiment of RSM.
Table 6 shows the optimum anaerobic digestion operation conditions for objective according to numerical optimization by Design-Expert. As to be expected, the volumetric bio-gas production rate and methane yield decreased as the temperature was degraded. Even so, a thermophilic range of temperature causes enhancement operating costs due to upper energy consumption of the heating units. On the other hand, energy requirement for impeller mixing causes increased operating costs. Therefore an optimization study has been carried out to identify the highest yields achievable when the factors temperature and mixing are minimized.
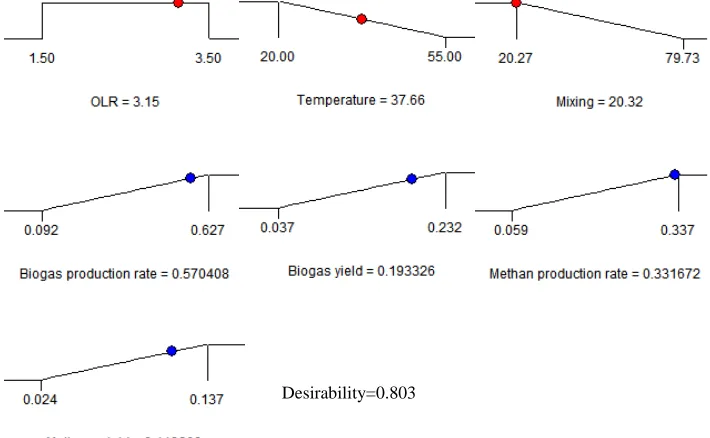
In Fig. 6, the ramps view shows the desirability for each factor (OLR, temperature and mixing) and each response (Y1p, Y2p, Y3p and Y4p), as well as the combined desirability. A highlighted (red and blue) point shows both the precise value of the factor or response (horizontal movement of
the point) and how well that target was satisfied (how high up the ramp). The advisability of the optimization of process was found to be 0.803, and the value is thoroughly dependent on how proximity the lower and upper limits are set relative to the real optimum. It should be noted that the optimization target is to trade a good set of conditions that will meet all of the goals, not just get to an advisability value of 1.0. Advisability is a mathematical method to trade the optimum.
Point prediction
The final step in any experiment is to predict the response at the optimal settings (Table 6), which allows entering levels for each factor or component into the current model. The software then calculates the expected responses and attendant confidence intervals based on the anticipation equation shown in the ANOVA output. The 95% confidence interval (C.I.) is the range in which the process average was expected to fall 95% of the time, while the 95% prediction interval (P.I.) is the range in which it was expected that any individual value to fall 95% of the time. As shown (Table 6), the P.I. is larger (a wider spread) than the C.I. since more scatter in individual values is expected than in averages. In this table, SE mean mention to the standard deviation attendant with the anticipation of an average value at the selected component levels, while the standard deviation associated with SE pred. demonstrate the anticipation of an individual observation at the selected factor or component levels 35.
CONCLUSION
The optimization study has been implementation to identify the uppermost yields achievable when the factors temperature and mixing are minimized. In this process optimization, uttermost values of bio-gas production and methane yield were proceeds as 0.570 m3/m3day
and 0.113 m3/kgVS added, respectively, with an
OLR of 3.15 kgVS/m3day, temperature of 37.66 °C
and mixing regime of 20.32 rpm.
The influence of temperature and OLR on bio-gas production and methane yield was more significant than the influence of mixing level.
Recommendation
Biomass retention capacity is an important consideration when using a mixed plug flow reactor because anaerobes grow slowly during metabolic generation of methane. It is frequently essential to select a bioreactor configuration that decouples the hydraulic retention time (HRT) from the solids retention time (SRT). Control mixing regime is an approach for decoupling SRT from HRT. Such decoupling can maintain a significantly high SRT/HRT ratio and prevents washout of slow-growing anaerobes. Further work is required to evaluation the effect of mixing regime on decoupling HRT from SRT in order to optimize gas production and methane yield whilst minimizing overall energy input.
ACKNOWLEDGEMENTS
Iran Small Industries and Industrial Park Organization (ISIPO) is gratefully acknowledged for partial funding of this project (contract economic No. 4111-7993-1741).
REFERENCES
1. Khanal, S.K. Anaerobic biotechnology for
bioenergy production: Principles and Applications. A John Wiley & Sons, Ltd. Publication, USA, 2008.
2. Dueblein, D.,Steinhauser, A., Biogas from waste
and renewable resources.KGaA: Wiley-VCH
Verlag GmbH and Co, 2008.
3. Karim, K., et al., Mesophilic digestion kinetics
of manure slurry. Appl Biochem Biotechnol,
2007; 142(3): 231-42.
4. Neves, L., Oliveira, R.,Alves, M.M.,
Co-digestion of cow manure, food waste and
intermittent input of fat. Bioresour Technol,
2009; 100(6): 1957-62.
5. Bond, T.,Templeton, M.R., History and future
of domestic biogas plants in the developing
world.Energy Sustain Dev, 2011; 15(4):
347-354.
6. Masse, D.I., et al., Low-temperature anaerobic
digestion of swine manure in a plug-flow reactor.
Environ Technol, 2013; 34(17-20): 2617-24.
7. Ferrer, I., et al., Biogas production in low-cost
household digesters at the Peruvian Andes.
Biomass Bioenerg, 2011; 35(5): 1668-1674.
8. Cournoyer, M., Chagnon, R.,Eng, P., A mixed
plug flow anaerobic digester for dairy manure.
ASAE, paper No.84-4562., 1984(84-4562).
9. Lusk, P.,Wiselogel, A. Methane recovery from
animal manures: the current opportunities casebook. Vol. 3. National Renewable Energy Laboratory Golden, CO, 1998.
10. Kaparaju, P.,Angelidaki, I., Effect of temperature
and active biogas process on passive separation
of digested manure. Bioresour Technol, 2008;
99(5): 1345-1352.
11. Inglis, S.F., Gooch, C.A.,Aneshansley, D.
Cleanout of a Plug-Flow Anaerobic Digester after Five Years of Continuous Operation. in
Proceedings of the International Symposium on Air Quality and Waste Management for Agriculture. Presented at the International Symposium on Air Quality and Waste Management for Agriculture, ASABE, Broomfield, CO. 2007.
12. Ahring, B.K., Ibrahim, A.A.,Mladenovska, Z.,
Effect of temperature increase from 55 to 65 degrees C on performance and microbial population dynamics of an anaerobic reactor
treating cattle manure.Water Res, 2001; 35(10):
2446-52.
13. Divya, D., Gopinath, L.R.,Merlin Christy, P., A
review on current aspects and diverse prospects for enhancing biogas production in sustainable
means.Renew Sustain Energy Rev, 2015; 42(0):
690-699.
14. Mähnert, P.,Linke, B., Kinetic study of biogas
production from energy crops and animal waste slurry: Effect of organic loading rate and reactor size. Environmental Technology, 2008; 30(1): 93-99.
15. Kaparaju, P., et al., Effects of mixing on methane
production during thermophilic anaerobic digestion of manure: Lab-scale and pilot-scale
studies. Bioresour Technol, 2008; 99(11):
4919-4928.
16. Amani, T., Nosrati, M.,Mousavi, S.M., Using
enriched cultures for elevation of anaerobic syntrophic interactions between acetogens and
methanogens in a high-load continuous digester.
Bioresour Technol, 2011; 102(4): 3716-23.
17. Tedesco, S., Marrero Barroso, T.,Olabi, A.G.,
Optimization of mechanical pre-treatment of
Laminariaceae spp. biomass-derived biogas.
Renew Energ, 2014; 62(0): 527-534.
18. Khuri, A.I. Response surface methodology and
related topics. World scientific publishing Co. Pte. Ltd., 2006.
19. Montgomery, D.C. Design and analysis of
experiments. New York: John Wiley & Sons, 2008.
20. APHA, AWWA,WPCF Standard methods for
Association., 1998.
21. Bezerra, M.A., et al., Response surface
methodology (RSM) as a tool for optimization
in analytical chemistry.Talanta, 2008; 76(5):
965-77.
22. Myers, R.H., Montgomery,
D.C.,Anderson-Cook, C.M. Response surface methodology: process and product optimization using designed experiments. Vol. 705. John Wiley & Sons, 2009.
23. Bazrafshan, Z., Ataeefard, M.,
Nourmohammadian, F., Modeling the effect of pigments and processing parameters in polymeric composite for printing ink application using the response surface
methodology. Progress in Organic Coatings,
2015; 82: 68-73.
24. Mason, R.L., Gunst, R.F.,Hess, J.L. Statistical
design and analysis of experiments: with applications to engineering and science, second ed. New York: John Wiley & Sons, 2003.
25. Rao, P.V.,Baral, S.S., Experimental design of
mixture for the anaerobic co-digestion of sewage
sludge.Chemical Engineering Journal, 2011;
172(2-3): 977-986.
26. Alvarez, R.,Lidén, G., The effect of temperature
variation on biomethanation at high altitude.
Bioresource Technology, 2008; 99(15): 7278-7284.
27. Hansen, K.H., Angelidaki, I.,Ahring, B.K.,
Anaerobic digestion of swine manure: Inhibition
by ammonia. Water Res, 1998; 32(1): 5-12.
28. Zeeman, G., et al., The influence of the
total-ammonia concentration on the thermophilic
digestion of cow manure. Agr Wastes, 1985;
14(1): 19-35.
29. Hill, D.,Bolte, J., Methane production from low
solid concentration liquid swine waste using
conventional anaerobic fermentation.
Bioresource Technology, 2000; 74(3): 241-247.
30. Salminen, E.A.,Rintala, J.A., Semi-continuous
anaerobic digestion of solid poultry slaughterhouse waste: effect of hydraulic
retention time and loading.Water research, 2002;
36(13): 3175-3182.
31. Alvarez, R.,Lidén, G., Low temperature
anaerobic digestion of mixtures of llama, cow and sheep manure for improved methane
production. Biomass Bioenerg, 2009; 33(3):
527-533.
32. Stroot, P.G., et al., Anaerobic codigestion of
municipal solid waste and biosolids under various mixing conditions—I. digester
performance.Water Research, 2001; 35(7):
1804-1816.
33. Møller, H.B., Sommer, S.G.,Ahring, B.K.,
Methane productivity of manure, straw and solid
fractions of manure.Biomass Bioenerg, 2004;
26(5): 485-495.
34. Kalia, A.K.,Singh, S.P., Horse dung as a partial
substitute for cattle dung for operating
family-size biogas plants in a hilly region.Bioresource
Technology, 1998; 64(1): 63-66.
35. Mafi Gholami, R., Mousavi, S.M.,Borghei, S.M.,
Process optimization and modeling of heavy metals extraction from a molybdenum rich spent catalyst by Aspergillus niger using response
surface methodology.J Ind Eng Chem, 2012;