F 24 CHEMICAL ENGINEERING: Processes in Machines and Devices JOURNAL OF ENGINEERING SCIENCES
ЖУРНАЛ ІНЖЕНЕРНИХ НАУК
ЖУРНАЛ ИНЖЕНЕРНЫХ НАУК
Web site: http://jes.sumdu.edu.ua
DOI: 10.21272/jes.2019.6(2).f4 Volume 6, Issue 2 (2019)
The Estimation of Feed Solution Composition Influence on Concentration
Polarization Layer Resistance during Reverse Osmosis
Huliienko S. V.1*, Protsiuk O. O.1, Gatilov K. O.2, Kaminskyi V. S.1, 3
1 National Technical University of Ukraine “Igor Sikorsky Kyiv Polytechnic Institute”, 37 Peremohy Ave., 03056 Kyiv, Ukraine; 2 Archer Daniels Midland Company ADM Europoort B.V., 125 Elbeweg, 3198 LC, Rotterdam, Netherlands;
3 Technical University of Kosice, 9 Letna St., 042 00 Kosice, Slovak Republic
Article info:
Paper received:
The final version of the paper received: Paper accepted online:
May 14, 2019 August 29, 2019 September 3, 2019
*Corresponding Author’s Address:
[email protected]
Abstract. The experimental determination of concentration polarization layer resistance during reverse osmosis of mineral salts solutions was carried out with the aim to estimate the influence of solution composition on the value of mentioned resistance. In experimental conditions, the membrane resistance remains constant (the mean value was 0.534·1014 m-1) which means that the membrane compaction was not observed. Moreover, under experimental
condi-tions, the hypothesis about linear dependence between the concentration polarization layer and applied pressure was confirmed for all solutions under investigations. It was defined that value of concentration polarization layer re-sistance different salt solutions was varied less than 10 % although under experimental conditions the diffusion coef-ficient values of magnesium sulfate were more than three times higher than corresponded values for other salts. The increasing of solutions concertation determines the increasing of concentration polarization layer resistance. At the same time, in previous study it was defined that changes in hydrodynamic regime in membrane module under similar conditions could determine the change in concentration polarization layer resistance in 3–5 times, while in both stud-ies the trends of impact of hydrodynamic conditions still similar to the value of considered resistance decrease with Reynolds number increasing. Such results showed that in considered range of concentrations the hydrodynamic con-ditions have a lower influence on concentration polarization layer resistance than solution composition. The obtained results are in agreement with the film theory of concentration polarization.
Keywords: membrane, reverse osmosis, concentration polarization, diffusion coefficient, Reynolds number, Schmidt number.
1
Introduction
The pressure-driven membrane processes, i. e. reverse osmosis, are widely used in the chemical industry and additionally in allied branches such as biotechnological, pharmaceutical and food proceedings, water treatment systems and environmental protection [1]. The concentra-tion polarizaconcentra-tion phenomenon and fouling formaconcentra-tion on the membrane surface is the main problem in the explora-tion of membrane apparatuses and set-ups [2]. The num-bers of researches are dedicated to this topic but there is no sufficient attention to the determination of mass trans-fer resistance due to concentration polarization layer.
Current research is the extension of our previous work [3] which was dedicated to the development of the tech-nique for the experimental determination of concentration polarization layer resistance and additionally to defining of influence of working parameters on the value of men-tioned resistance. However, in work [3] the experiments
were carried out with using sodium chloride with various concentrations as feed solution. This does not allow to define the influence of feed solution composition on the value of concentration polarization layer resistance. For estimation of this impact, the experimental research was carried out for three different salt solutions.
2
Literature Review
For concentration polarization phenomenon descrip-tion, it was proposed several models, the main of them are: film model, Spiegler–Kedem model, osmotic pres-sure model, gel layer model and others [1, 2]. At that, in some models, including osmotic pressure and gel layer models, the transmembrane flux is described by an equa-tion in such form [2]:
(
Rm Rcp Rf Rp)
pJ
+ + +
− =
Journal of Engineering Sciences, Volume 6, Issue 2 (2019), pp. F 24–F 29 F 25 where Δp – applied pressure (driving force); Δπ –
osmo-tic pressures difference; Rm – membrane resistance; Rcp –
concentration polarization layer resistance; Rf – fouling
layer resistance; Rp – pore blocking resistance.
According to [2], in an ideal case, there should be only membrane resistance which can be determined experi-mentally by measuring transmembrane flux for pure sol-vent. In that case, this value can be calculated from such equation as [2]:
J p Rm ·
= . (2)
In work [3], it was mentioned set of works dedicated determination to techniques of determination of fouling layer resistance, i. e. defining of the relation between specific cake layer resistance and applied pressure during dead-end ultrafiltration of carbohydrates solutions in work [5].
The pore-blocking resistance is typical only for the microfiltration process [1] so that in some works for pres-sure-driven membrane description this value is not con-sidered as in work [5] during the analysis of the nanofil-tration process.
At the same time works dedicated to the determination of the concentration polarization layer resistance are al-most absent in literature sources. In the review [2] it was mentioned about using indirect methods in preceding works. On the other hand, the majority of concertation polarization researches have theoretical character and dedicated to problems of numeric simulation of this phe-nomenon and influence to the intensity of scaling for-mation [6]; development of models for inorganic salts transport through the membrane [7]; simulation of the concentration field during flow in channels with spacers [8], determination of limiting fluxes [9] and impact to fouling formation [10, 11].
In work [3] it was mentioned out that the most com-prehensive study of the concentration polarization layer resistance was carried out by Macedo and al. [12]. Partic-ularly, in mentioned research it was assumed that the value of Rcp is directly proportional to applied pressure,
that is:
p
Rcp =· . (3) Additionally, in work [12], it was shown that taking into account the equation (3) the equation (1) can be re-written in a form:
(
)
+ + = p R RJ m f
1 1
. (4)
The proposed equation is a practical tool for the de-termination of fouling layer resistance, which allows estimating the necessity of regeneration using transmem-brane flux data. If there was a reliable relationship for the concentration polarization layer resistance or the value of
coefficient φ the equation (4) would be suitable for use in automatic control of the membrane separation process.
In our previous work [3] it was defined, that assump-tion about the linear dependence between concentraassump-tion polarization layer resistance and the applied pressure is reasonable, and it was determined the influence of operat-ing parameters (applied pressure and hydrodynamic con-ditions in membrane module) on the concentration polari-zation layer resistance. However, those results do not allow to define the relationship for determination of con-centration polarization layer resistance due to the absence of information about the influence of solution composi-tion on the value of mencomposi-tioned resistance, since the ex-periments were carried out with using of one solution namely NaCl.
3
Research Methodology
3.1
Materials
As it has been done in work [3], the researches were carried out with commercially available membrane mod-ules but anther trademark namely HID TFC 1812-75 GPD (Made in China). As membrane modules, Dow Filmtec TW30-1812-50, which used in work [3] the membrane module under investigation is destined for tap water post-treatment. The membrane modules HID TFC 1812-75 GPD have higher productivity up to 50 % and lower selectivity up to 10 % by comparison with the membrane modules Dow Filmtec TW30-1812-50.
For measuring the membrane resistance, the deionized water (reverse osmosis permeate with total dissolved solids in the range of 5–15 mg/dm3) was used. For meas-uring of concentration polarization layer resistance, the solutions of sodium chloride (NaCl), magnesium sulfate (MgSO4) and sodium nitrate (NaNO3) were used. The experiments were carried out with using solutions with concentrations of 100 and 200 mg/dm3.
3.2
Description of the experimental set-up
The research was carried out on the same experimental set-up as in work [3] (Figure 1), which includes feed solution tank 1, pump 2, membrane apparatus 3 and con-tain-ers and tanks 5-8. For control of flow rate, valve 5 is provided. The applied pressure was monitored using the manometer 9.
F 26 CHEMICAL ENGINEERING: Processes in Machines and Devices
Figure 1 – The design scheme of the experimental set-up
3.3
Experimental procedure and main
measurements
In the current research, the same experimental tech-nique as in work [3] was used. It involves the pumping the feed solution under predetermined applied pressure by pump 9 into membrane apparatus 3 and measurements of permeate and retentate flor rates be volumetric technique. Firstly, measurements were carried out for mew mem-brane module HID TFC 1812-75 GPD with using of de-ionized water as a test solution, then measurements were carried out for salt solution separation. After each mem-brane module working cycle with each salt solutions the mem-brane cleaning was carried out using deionized water. It was done with the aim to remove the salt solu-tion remains.
The measurements were carried out for each test solu-tion in a range of applied pressure of 0.2–0.6 MPa and under ambient temperature. In this case, the ambient tem-perature was varied in a range of 13–17 °C.
The processing of results and determination of concen-tration polarization layer resistance were carried out ac-cording to the technique represented in [3]. The physical properties of the solution were determined according to reference literature [13, 14].
For determination of salt diffusivities in solution, the experimental result represented in work [15] were used. Since experiments were carried out under temperatures which differs from 25 °C for that experimental data rep-resented in [15], for the revaluation it was used following equation [16]:
( )
( )
( )
( )
=
0 0
0 · ·
T T T
T T D T
D . (5)
where D(T0) – diffusion coefficient under the base tem-perature; T – solution temperature under operation condi-tion; T0 – base temperature (in this case the temperature for which the experimental results are represented, name-ly 25 °C), μ(T) – dynamic viscosity coefficient under operation temperature; μ(T0) – dynamic viscosity coeffi-cient under base temperature. The values of dynamic viscosity coefficients were defined using reference litera-ture [13, 14].
4
Results and Discussion
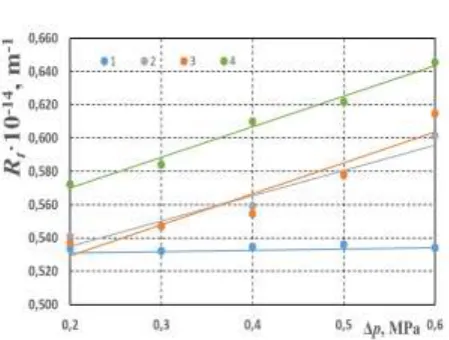
The total membrane resistance of mass transfer through the membrane, which was measured according to the mentioned technique, is represented in Figures 2, 3. The obtained results, in general, confirmed the conclusion obtained in work [3]. In a case, during the measurement of productivity for pure solvent (deionized water) the value of total resistance was varied less than 1 % and the average value was 0.534·1014 m-1. Therefore, the influ-ence of membrane compaction was negligible and ob-tained value can be assumed equal to membrane re-sistance Rm. It should be noticed membrane rere-sistance value for modules HID TFC 1812-75 GPD is lower than one for modules Dow Filmtec TW30-1812-50 (Rm = 0,755·1014 m-1), which are used in work [3].
Figure 2 – The dependence of total resistance to membrane transfer thorough the membrane from applied pressure: 1 – deionized water; 2 – MgSO4 solution (100 mg/dm3);
3 – NaNO3 solution (100 mg/dm3); 4 – NaCl solution
(100 mg/dm3)
Figure 3 – The dependence of total resistance to membrane transfer thorough the membrane from applied pressure: 1 – deionized water; 2 – MgSO4 solution (200 mg/dm3);
3 – NaNO3 solution (200 mg/dm3); 4 – NaCl solution
Journal of Engineering Sciences, Volume 6, Issue 2 (2019), pp. F 24–F 29 F 27
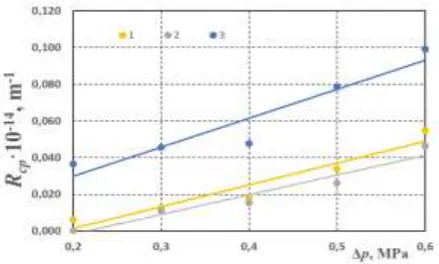
Figure 4 – The dependence of concentration layer resistance from applied pressure: 1 – MgSO4 solution (100 mg/dm3);
2 – NaNO3 solution (100 mg/dm3); 3 – NaCl solution
(100 mg/dm3)
In this case, the hypothesis about linear dependence between applied pressure and concentration polarization layer resistance is confirmed not only for NaCl and for others salts which were used in experiments.
It should be noticed that the value of concentration po-larization layer resistance for MgSO4 and NaNO3 was on the approximately same level (the difference was less than 2 %) for the same concentration (curves 1 and 2 in Figures 4, 5), whereas for NaCl these values were higher for 5–8 % (curves 3 for the same figures). Such results were unexpected considering the properties of solutions. According to [15] and with correction using equation (5) the values of diffusion coefficient for MgSO4 under ex-perimental conditions were in a range of D = (7.715– 7.744)·10–9 m2/s, for NaNO
3 these values were
D = (1.788–1.789) 10–9 m2/s and correspondingly for NaCl these ones were D = (1.800–1.803)·10–3 m2/s. Con-sidering that values of diffusion coefficient were close for NaNO3 and NaCl solutions, the bigger difference should expect for the case of MgSO4 solution. The probable reason for this difference is temperature condition. As mentioned above the experiments were carried out under ambient temperatures with variated in a range 13–17 °C. Moreover, during experiments with NaNO3 and MgSO4 solutions, the temperature was approximately the same namely 16.5–17.0 °C whereas in a case of NaCl the ex-periments were carried out under lower temperatures (13–14 °C).
The impact of solution concentration in all cases corre-sponded to results obtained in work [3] namely increasing of concentration polarization layer with increasing of concentration (Figures 6, 7).
It should be noticed, that influence of solution compo-sition on concentration polarization layer resistance value under experimental conditions in particularly considered salts and their concentrations was lower than the influ-ence of hydrodynamic conditions which was investigated in work [3]. Moreover, the obtained in that work behavior is confirmed. In particular, the value of concentration layer polarization resistance is decreased with increasing the Reynolds number (Figure 8) as it was predicted by the film theory of concentration polarization [1, 2].
Figure 5 – The dependence of concentration layer resistance from applied pressure: 1 – MgSO4 solution (200 mg/dm3);
2 – NaNO3 solution (200 mg/dm3); 3 – NaCl solution
(200 mg/dm3)
Figure 6 – The dependence of concentration polarization layer resistance from applied pressure during MgSO4 solutions
sepa-ration: 1 –100 mg/dm3; 2 – 200 mg/dm3
Figure 7 – The dependence of concentration polarization layer resistance from applied pressure during NaNO3 solutions
sepa-ration: 1 –100 mg/dm3; 2 – 200 mg/dm3
F 28 CHEMICAL ENGINEERING: Processes in Machines and Devices The obtained data did not allow to define influence the
Schmidt number on values of concentration polarization layer resistance since the value of this parameter for NaNO3 and NaCl were close (Sc = 630–640) whereas for MgSO4 it was substantively different (Sc = 140–150).
This was determined by mentioned above values of diffusivity coefficients of salts under investigation under experimental conditions. This fact also can be the reason of low correlation (correlation coefficient was lower than 0.6) between the concentration polarization layer resistance and the Reynolds number with observed in Figure 8.
For determination of such relationship the further ex-periments with corresponding selections of solutions, its concentrations, and operating temperatures are needed.
5
Conclusions
The evaluation of influence of solution composition on concentration polarization layer resistance during the reverse osmosis and it shown that during reverse osmosis separation of diluted salt solutions (concentration up to 200 mg/dm3) the value on considered does not change by more than 10 %, whereas variations in hydrodynamic conditions can change Rcp value 3–5 times in a range of
applied pressure of 0.2–0.6 MPa or in range of Reynolds number 2–13, as it was shown in previous work [3].
Therefore, the influence of hydrodynamic condition is more significant than the impact of solution composition.
The obtained results did not allow to define a depend-ence of concentration polarization layer resistance from the Schmidt number.
The obtained results confirm the hypothesis about lin-ear dependence of concentration polarization layer re-sistance from applied pressure not only for NaCl but also for other mineral salts. The results also are in agreement with the film theory of concentration polarization.
References
1. Mulder, M. (1996). Basic Principles of Membrane Technology. Dordrecht, Kluwer Academic Publishers.
2. Shirazi, S., Lin, C.-J., Chen, D. (2010). Inorganic fouling of pressure-driven membrane processes – A critical review. Desalina-tion, Vol. 250(1), pp. 236–248, doi: 10.1016/j.desal.2009.02.056.
3. Huliienko, S., Leshchenko, O. (2019). Influence of operating pressure on concentration polarization layer resistance in reverse osmosis. Ukrainian Food Journal, Vol. 8(1), pp. 119–132, doi: 10.24263/2304-974X-2019-8-1-13.
4. Sioutopoulos, D., Karabelas, A. (2015). The effect of permeation flux on the specific resistance of polysaccharide fouling layers developing during dead-end ultrafiltration. Journal of Membrane Science, Vol. 473, pp. 292–301, doi: 10.1016/j.memsci.2014.09.030.
5. Luo, J., Ding, L., Su, Y., Wei, Sh., Wan, Y. (2010). Concentration polarization in concentrated saline solution during desalina-tion of iron dextran by nanofiltradesalina-tion. Journal of Membrane Science, Vol. 363, pp. 170–179, doi: 10.1016/j.memsci.2010.07.033. 6. Li, W., Su, X., Palazzolo, A., Ahmed, S. (2019). Numerical modelling of concentration polarization and inorganic fouling growth in the pressure-driven membrane filtration process. Journal of Membrane Science, Vol. 569, pp. 71–82, doi: 10.1016/j.memsci.2018.10.007.
7. Jang, E.-S., Mickols, W., Sujanani, R., Sujanani, R., Dilenschneider, T., Kamcev, J., Paul, D., Freeman, B. (2019). Influence of concentration polarization and thermodynamic non-ideality on salt transport in reverse osmosis membranes. Journal of Mem-brane Science, Vol. 572, pp. 668–675, doi: 10.1016/j.memsci.2018.11.006.
8. Amokrane, M., Sadaoui, D., Koutsou, C. P., Karabelas, A. J., Dudeck, M. (2015). A study of flow field and concentration polar-ization evolution in membrane channels with two-dimensional spacers during water desalination. Journal of Membrane Science, Vol. 477, pp. 139–150.
9. McGovern, R. K., Lienhard, J. H. (2016). On the asymptotic flux of ultrapermeable seawater reverse osmosis membranes due to concentration polarization. Journal of Membrane Science, Vol. 520, pp. 560–565, doi: 10.1016/j.memsci.2016.07.028.
10. Freire-Gormaly, M., Bilton, A. M. (2019). Impact of intermittent operation on reverse osmosis membrane fouling for brackish groundwater desalination systems. Journal of Membrane Science, Vol. 583, pp. 220–230, doi: 10.1016/j.memsci.2019.04.010. 11. Suwarno, S. R., Chen, X., Chong, T. H., McDougald, D., Cohen, Y., Rice, S. A., Fane, A. G. (2014). Biofouling in reverse
os-mosis processes: The roles of flux, crossflow velocity and concentration polarization in biofilm development. Journal of Mem-brane Science, Vol. 467, pp. 116–125, doi: 10.1016/j.memsci.2014.04.052.
12. Macedo, A., Duarte, E., Pinho, M. (2011). The role of concentration polarization in ultrafiltration of ovine cheese whey. Journal of Membrane Science, Vol. 381, pp. 34–40, doi: 10.1016/j.memsci.2011.07.012.
13. Nikolskij, B. (2013). Chemist’s Handbook, Vol. 3 – Chemical Equilibrium and Kinetics. Properties. Demand Ltd.
14. Yaws, C. (1999), Chemical Properties Handbook: Physical, Thermodynamic, Environmental, Transport, Safety and Heals Re-lated Properties for Organic and Inorganic Chemicals. McGraw-Hill, New York.
15. Dytnerskii, Iu. I. (1986). Baromembrane Processes. Theory and Calculation. Chemistry, Moscow.
Journal of Engineering Sciences, Volume 6, Issue 2 (2019), pp. F 24–F 29 F 29
УДК 66.081.63
Оцінювання впливу складу розділюваного розчину на опір шару
концентраційної поляризації при зворотному осмосі
Гулієнко С. В.1, Процюк О. О.1, Гатілов К. О.2, Камінський В. С.1, 3
1 Національний технічний університет України «Київський політехнчний інститут ім. Ігоря Сікорського»,
просп. Перемоги, 37, 03056, м. Київ, Україна;
2 Archer Daniels Midland Company ADM Europoort B.V., 3198 LC, м. Роттердам, Нідерланди; 3 Технічний університет м. Кошице, вул. Літня, 9, 042 00, м. Кошице, Словаччина
Анотація. У роботі експериментально визначено опір шару концентраційної поляризації при зворотно-осмотичному розділенні розбавлених розчинів мінеральних солей з метою оцінювання впливу складу розчи-ну на величирозчи-ну зазначеного опору. Як модельне середовище обрано розчини хлориду натрію, сульфату маг-нію та нітрату натрію з концентраціями 100 та 200 мг/дм3, а також знесолена вода для визначення опору
мем-брани. Робочий тиск варіювався у межах 0,2–0,6 МПа. Дослідження проводилися за температур оточуючого середовища 13–17 °С. За таких умов опір мембрани залишався постійним, а його середнє значення становило 0,534·1014 м–1, тобто ущільнення мембрани не спостерігалось. Окрім того, в умовах проведення
експеримен-тальних досліджень підтверджується гіпотеза лінійної залежності опору шару концентраційної поляризації від тиску не лише для хлориду натрію, але й для всіх досліджуваних солей. Також встановлено, що значення опору шару концентраційної поляризації для різних солей відрізнялося не більше, ніж на 10 %. Проте, за умов проведення досліджень значення коефіцієнту дифузії для розчину сульфату магнію більше, ніж утричі перевищували відповідні значення для інших солей. Зростання концентрації розчину обумовлює відповідне збільшення опору шару концентраційної поляризації. У той же час, у попередніх дослідженнях було встанов-лено, що зміна гідродинамічного режиму в мембранному модулі за аналогічних умов може обумовити зміну опору шару концентраційної поляризації у 3–5 разів. Більше того, в обох дослідженнях тенденції впливу гід-родинамічних характеристик залишаються однаковими. Зокрема, значення досліджуваного опору зменшуєть-ся зі збільшенням критерію Рейнольдса. Такі результати свідчать, що в розглядуваному діапазоні концентра-цій гідродинамічні умови чинять більший вплив на величину опору шару концентраконцентра-ційної поляризації, ніж склад розчину, що розділюється. Результати досліджень узгоджуються з плівковою теорією концентраційної поляризації. Проте, отримати залежність опору шару концентраційної поляризації від критерію Шмідта не вдалось.