Genetics and Molecular Research 17 (2): gmr16039914
Selection of progenies of snap beans using mixed
models (REML/BLUP)
D.P. Cruz1, G.A. Gravina1, T.R.A. Oliveira1, A.B.S. Gomes1, C.Q. Silva1, M. Vivas1, K.C. Araújo1, R.F. Daher1, L.M. Gravina1, R. Moraes1 and V.B. Silva2
1
Laboratório de Engenharia Agrícola, Universidade Estadual do Norte Fluminense Darcy Ribeiro, Campos dos Goytacazes, RJ, Brazil
2
Departamento de Fitotecnia, Universidade Federal do Piauí, Teresina, PI, Brazil
Corresponding author: D.P. Cruz
E-mail: [email protected]
Genet. Mol. Res. 17 (2): gmr16039914
Received Dec 06, 2017
Accepted May 01, 2018
Published May 04, 2018
DOI: http://dx.doi.org/10.4238/gmr16039914
Copyright © 2018 The Authors. This is an open-access article distributed under the terms of the Creative Commons Attribution ShareAlike (CC BY-SA) 4.0 License.
ABSTRACT. The purpose of this research was to select the development of superior genotypes of snap beans adapted to edaphoclimatic conditions of the North and Northwest of Rio de Janeiro State, Brazil, applying the mixed model methodology. The test was installed and carried out in the experimental area of the Instituto Federal Fluminense (IFF), located in the municipality of Bom Jesus do Itabapoana, Rio de Janeiro State, Brazil, using the modified SSD (Single Seed Descent) method. The experiment was of randomized block design with three replications. We evaluated weight of pod per plant and number of pod per plant in ten progenies from the snap bean breeding program of the Universidade Estadual do Norte Fluminense (UENF); individual plants were assessed in each plot and in each replication (block). All progenies had mean productivity superior to 1 kg of pod per plant and 144 pods per plant. The 7 and 2 progenies, which came from the crossings between (UENF 7-5-1) L6 × L20 (UENF 14-3-3) and (UENF 7-5-1) L6 × L13 (UENF 7-20-1), stood out from the others, as they led to a higher predicted additive gain for the two evaluated traits. We concluded that the selection for production of snap beans and grains applying BLUP enabled the prediction and achievement of significant genetic gains for breeding snap beans for subsequent generations
Key words:Phaseolus vulgaris L; Genetic breeding; Productivity
Genetics and Molecular Research 17 (2): gmr16039914
INTRODUCTION
Snap beans are characterized as being traditionally produced in small properties, either for own consumption or commercial purpose (Vieira et al., 2014). According to the Food and Agriculture Organization of the United Nations (FAO) (2014), world production is around 21 million tonnes, and China, Indonesia, and India are the largest producers. The South and Southeast Brazil produce around 75% of snap beans (Melo and Vilela, 2008). Rio de Janeiro State is one of the largest national markets of snap beans and is responsible for 21% of the total produced in the Southeast of the country. However, despite being valued, this culture presents low productivity in the North and Northwest of the state due to its lack of cultivars adapted to these regions (Vilela et al.; 2009; Francelino et al., 2011). It is possible to obtain superior and adapted genotypes by means of genetic breeding techniques. However, the development of researches on the snap bean culture is still scarce, especially with regard to the increase of traits related to the production and quality of pods, considering that there are few registered cultivars, when comparing to other registers (Brasil, 2017).
The REML/BLUP (Restricted Maximum Likelihood/ Best Linear Unbiased Prediction) method has proven to be efficient for data analysis, both balanced and unbalanced ones. In this methodology, the effects of treatments are considered as random effects, and the other main effects regarded as fixed effects (Resende, 2007b). Besides, this technique involves estimation of variance components and prediction of genetic values, simultaneously. Information about genetic progress is of fundamental importance, since it allows breeding programs to be evaluated regularly in order to evaluate their success. Moreover, it enables the study of new methodologies that will increase their efficiency and guide future researches. This way, the estimate of the genetic progress constitutes a relevant option used to evaluate breeding programs. As far as we know, the application of the REML/BLUP focusing on the assumption of the individual genotypic value has not been used in the process of selection of snap beans. However, this methodology was efficient in the study of adaptability and stability of common bean and cowpea (Carbonnel et al., 2007; Torres et al., 2015). Therefore, the aim of this work was to select snap bean progenies applying mixed models (REML/BLUP).
MATERIAL AND METHODS
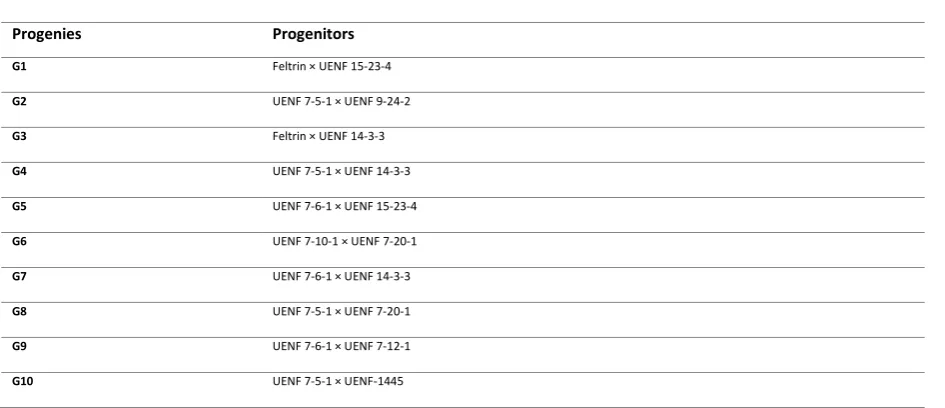
The test was conducted in the experimental area of the Instituto Federal Fluminense, located in the municipality of Bom Jesus de Itabapoana, Northwest of Rio de Janeiro State (21°08, 41°40' W, 88 meters above sea level), Brazil. According to the Köppen-Geiger climate classification system (1928), its local climate is the Aw alternating hot and rainy season with dry season, annual temperature averaging between 22°C and 25°C, and annual average precipitation between 1200 mm and 1300 mm. To perform this research, we started characterizing and studying the genetic diversity of 25 accessions of the Germplasm Bank of the Universidade Estadual do Norte Fluminense, of indeterminate growth habit. Subsequently, crossings between the divergent accessions and desirable traits were executed, obtaining diallel hybrids. Lastly, generations were advanced to select the best genotypes to follow the breeding program (Table 1).
Progenies Progenitors
G1 Feltrin × UENF 15-23-4
G2 UENF 7-5-1 × UENF 9-24-2
G3 Feltrin × UENF 14-3-3
G4 UENF 7-5-1 × UENF 14-3-3
G5 UENF 7-6-1 × UENF 15-23-4
G6 UENF 7-10-1 × UENF 7-20-1
G7 UENF 7-6-1 × UENF 14-3-3
G8 UENF 7-5-1 × UENF 7-20-1
G9 UENF 7-6-1 × UENF 7-12-1
G10 UENF 7-5-1 × UENF-1445
Genetics and Molecular Research 17 (2): gmr16039914
The F3 population was conducted in a randomized block experimental design with three replications. The
experimental plot was of ten plants in 1.0 m × 0.5 m spacing, which totaled 300 experimental units, and only the eight central plants of each line were evaluated. The sowing was performed with three seeds per pit. Ten days after sowing, the thinning was carried out, and one plant per pit was left; fifteen days after emerging, the plants were staked with bamboo and wire trellis. According to Filgueira (2013), the cultivation and phytosanitary treatments were performed as recommended for the culture. Data were collected from the physiological maturity of the culture, and the analyzed traits were the weight of pod per plant (PVP) – quantification of total weight in (kg) of pods of each plant obtained by means of a precision scale, and the number of pod per plant (NVP) – measured by the total count of pods in each plant after harvest. The individual statistic and genetic analyses were conducted based on the mixed model methodology for estimation of the variance components and of the genotypic parameters by means of the Restricted Maximum Likelihood (REML) and collection of the Best Linear Unbiased Prediction (BLUP) of the genotypic effects. Variables were analyzed according to the 61 models (Resende, 2016) with the following description:
Y = Xr + Za + Wp + Tb + ε
in which y is the vector of data; r is the vector of the effect of populations and testimonies, considered as fixed effects; a is the vector of the individual additive genetic effects (assumed as random); p is the vector of plot effect (assumed as random); b is the vector of errors or residuals (random); and X, Z, W, T are incidence matrices for r, a, p, and b, respectively.
RESULTS AND DISCUSSION
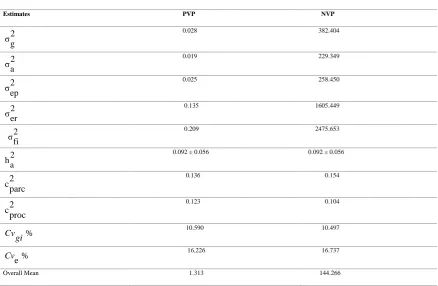
Analyzing results in details, it can be seen that there was no difference in the coefficient of heritability for the two
traits, which was considered of low magnitude; the coefficients of variation (σ2 g, 2 σ a, 2 σ ep, 2 σ er , 2 e σ
fi
)
in theweight of pod per plant (PVP) character were lower than in the number of pod per plant (NVP) character (Table 2). This perception shows a possible difficulty when selecting this character, mainly in generations with a high percentage of heterozygotes, due to the low fixation of favorable alleles for the traits under study.
Estimates PVP NVP
2
σg 0.028 382.404
2
σa 0.019 229.349
2 σ
ep
0.025 258.450
2 σ
er
0.135 1605.449
σ2
fi
0.209 2475.653
2 h
a
0.092 ± 0.056 0.092 ± 0.056
2 c
parc
0.136 0.154
2 c
proc
0.123 0.104
%
Cv gi
10.590 10.497
% e
Cv 16.226 16.737
Overall Mean 1.313 144.266
Genetics and Molecular Research 17 (2): gmr16039914
Moreto (2008) states that genetic and phenotypic parameters are not easy to presume, since there are differences in the evaluation unit, experimental precision, number of plants, genotypic interaction × environments, among other factors besides the genetic variation of populations that may interfere the estimates.
The heritability coefficient varies according to the various agronomic characters evaluated. For PVP and NVP
traits, the individual heritability coefficient (h )2
a
s
presented low magnitude proving that only 9.2% of the existent variation are from genetic causes. The inherited value for the traits showed to be highly influenced by the expressive environmental variation, which hinders the success in the selection process.As claimed by Borém (1997), characters that develop in a short period of time would be less subjected to the interaction with the environment. This way, they would express higher heritability value than the characters subjected to a higher period of development; and that can be seen in this study due to a constant formation and development of the snap beans and consequent impact on the heritability values for both traits under study.
The coefficients of determination of the plot effects (C2 )
parc sand of determination of population effects 2 (C )
porc
which distinguish the experimental quality and measure the environmental variation between plots in blocks and
populations, respectively, are also measured. The values of (C2 ) parc and
2 (C )
porc were considered low for the
two variables and indicated good experimental accuracy.
Besides, the estimates of the coefficient of experimental variation (CVe) demonstrated considerably lsow values
for both traits and validated good conditions and accuracy in the conduction of tshe experimsent. The coefficient of individual additive genetic variation (CVgi %) which quantifies the magnitude of the genetic variable
available for the selection, presented 10.590 values for the PVP and 10.497 values for the NVP. It reveals that there may be higher emphasis of the genetic variation for the subsequent evaluations. Another important parameter as a selection strategy for breeding is the coefficient of relative variation (CVr) or variation index
(IV), which represents the ratio between the (CVgi) and the (CVe). According to Vencovsky (1987), when the
index is close to or above 1, we can interpret that there are great conditions for selecting a specific trait.
Based on the coefficient of relative variable, the PVP and NVP traits can provide acceptable genetic gains, since the parameter magnitude for the traits were of 0.652 and of 0.627, respectively, considered moderate. Those values show a significant proportion of genetic variation with sregard to the environmental influence and give condition to the selection process. With respect to classification, F3 progenies, selected to obtain the weight of
pod per plant, also ranked first for the number of pod per plant trait; it demonstrated a high level of interdependence between the evaluated characters (Figure 1). Therefore, G7 (UENF 7-5-1 × UENF 9-24-2), G2 (UENF 7-5-1 × UENF 7-20-1), G10 (UENF 7-6-1 × UENF 15-23-4), and G6 (Feltrin × UENF 14-3-3) genotypes were indicated as superior for the two evaluated traits, providing an increase in productivity. With the exception of G10, all of them were from crossings using at least one of the best testimonies (Feltrin and UENF 7-5-1).
Genetics and Molecular Research 17 (2): gmr16039914
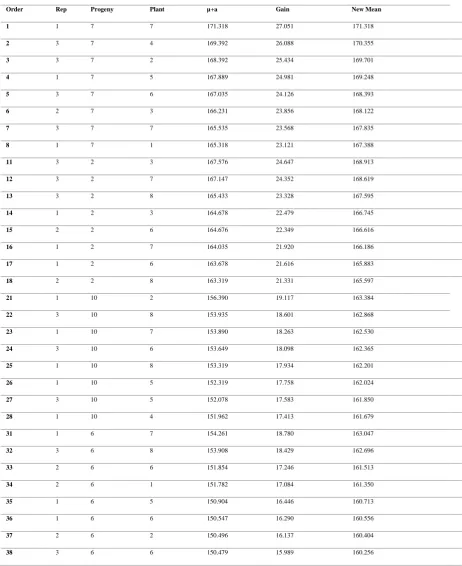
G2 and G7 progenies presented important values for number of pod per plant, which, when selecting, will be able to give mean predicted genetic gains of 16 pods per plant for the subsequent generation. In accordance with Chiorato et al. (2008), the effective selection of superior genotypes is associated with the components of the variance and with the components of the mean, and, to obtain significant genetic gains, the breeder genotypes of higher means and higher genetic variability should be selected. Thus, it is important to apply the rank and prediction of genetic values, based on criteria of high interest for the culture, emphasizing the increase of genetic gains by the selection of the best plants among the selected progenies. In the selection within progeny established by the BLUP methodology, it was possible to capture the total genotypic variation occurred between and within the progenies considering the best individuals of the best progenies (Tables 3 and 4). Four progenies and eight superior individuals of each of them were selected for the two traits applying a selection intensity of 10.6% in the original population, which totalized 32 plants to generate F4 generation.
Order Rep Progeny Plant µ+a Gain (kg) New Mean
1 1 7 7 1.601 0.287 1.601
2 3 7 4 1.598 0.86 1.599
3 3 7 6 1.591 0.283 1.596
4 3 7 2 1.569 0.276 1.589
5 1 7 5 1.561 0.270 1.584
6 1 7 1 1.558 0.266 1.579
7 3 7 7 1.555 0.263 1.576
8 1 7 2 1.554 0.260 1.573
11 1 2 1 1.511 0.234 1.547
12 3 2 7 1.506 0.231 1.544
13 3 2 3 1.497 0.229 1.542
14 3 2 8 1.494 0.227 1.541
15 2 2 8 1.491 0.224 1.537
16 2 2 6 1.488 0.222 1.535
17 1 2 3 1.478 0.220 1.534
18 1 2 4 1.478 0.219 1.532
21 3 6 3 1.427 0.194 1.507
22 3 6 8 1.420 0.190 1.503
23 1 6 7 1.408 0.187 1.500
24 2 6 6 1.398 0.185 1.498
25 3 6 6 1.398 0.183 1.496
26 1 6 5 1.393 0.179 1.492
27 2 6 1 1.391 0.177 1.491
28 1 6 6 1.391 0.176 1.489
31 3 10 8 1.395 0.181 1.494
32 1 10 2 1.358 0.151 1.464
33 1 10 8 1.341 0.142 1.455
34 3 10 6 1.341 0.139 1.452
35 1 10 7 1.336 0.136 1.450
36 3 10 5 1.325 0.135 1.448
Table 3. Plants selected within the best F3 progenies of snap beans for the weight of pod per plant (PVP) trait based on
Genetics and Molecular Research 17 (2): gmr16039914
37 1 10 5 1.323 0.132 1.445
38 1 10 4 1.319 0.128 1.441
Order Rep Progeny Plant µ+a Gain New Mean
1 1 7 7 171.318 27.051 171.318
2 3 7 4 169.392 26.088 170.355
3 3 7 2 168.392 25.434 169.701
4 1 7 5 167.889 24.981 169.248
5 3 7 6 167.035 24.126 168.393
6 2 7 3 166.231 23.856 168.122
7 3 7 7 165.535 23.568 167.835
8 1 7 1 165.318 23.121 167.388
11 3 2 3 167.576 24.647 168.913
12 3 2 7 167.147 24.352 168.619
13 3 2 8 165.433 23.328 167.595
14 1 2 3 164.678 22.479 166.745
15 2 2 6 164.676 22.349 166.616
16 1 2 7 164.035 21.920 166.186
17 1 2 6 163.678 21.616 165.883
18 2 2 8 163.319 21.331 165.597
21 1 10 2 156.390 19.117 163.384
22 3 10 8 153.935 18.601 162.868
23 1 10 7 153.890 18.263 162.530
24 3 10 6 153.649 18.098 162.365
25 1 10 8 153.319 17.934 162.201
26 1 10 5 152.319 17.758 162.024
27 3 10 5 152.078 17.583 161.850
28 1 10 4 151.962 17.413 161.679
31 1 6 7 154.261 18.780 163.047
32 3 6 8 153.908 18.429 162.696
33 2 6 6 151.854 17.246 161.513
34 2 6 1 151.782 17.084 161.350
35 1 6 5 150.904 16.446 160.713
36 1 6 6 150.547 16.290 160.556
37 2 6 2 150.496 16.137 160.404
38 3 6 6 150.479 15.989 160.256
Genetics and Molecular Research 17 (2): gmr16039914
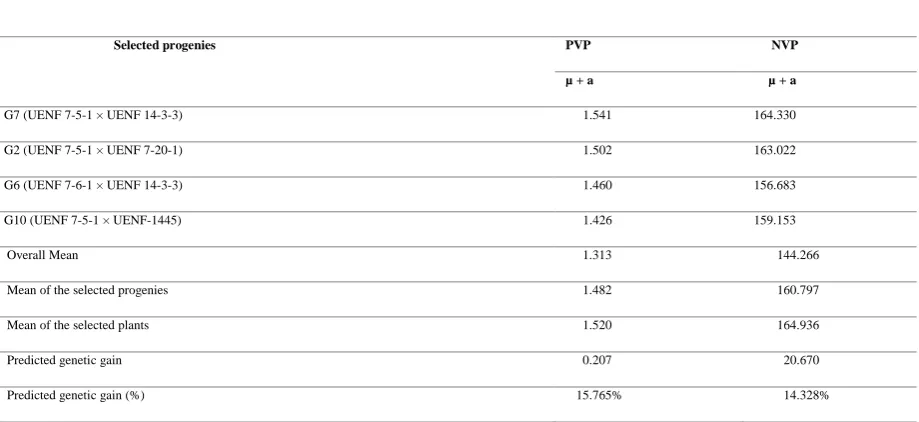
G7 progeny had the best productive performance for the weight of pod per plant (PVP) and number of pod per plant (NVP) traits, with mean predicted genetic value of 1.541 kg and 164.330 kg, respectively. The environmental variance had a high impact on the conduction of the experiment. As a result, low heritability values were obtained, which directly influenced in the genetic gain for both traits. The new selection of 32 plants (10.6% of selection intensity) based on the highest predicted genetic values, both for weight of pod per plant and number of pod per plant, will provide simultaneous predicted additive genetic gain of 15.765% for PVP and of 14.328% for NVP in relation to the mean of the original population (Table 5).
Selected progenies PVP NVP
µ + a µ + a
G7 (UENF 7-5-1 × UENF 14-3-3) 1.541 164.330
G2 (UENF 7-5-1 × UENF 7-20-1) 1.502 163.022
G6 (UENF 7-6-1 × UENF 14-3-3) 1.460 156.683
G10 (UENF 7-5-1 × UENF-1445) 1.426 159.153
Overall Mean 1.313 144.266
Mean of the selected progenies 1.482 160.797
Mean of the selected plants 1.520 164.936
Predicted genetic gain 0.207 20.670
Predicted genetic gain (%) 15.765% 14.328%
CONCLUSION
The REML/BLUP methodology was efficient in the selection of progenies and superior individuals, and provided significant gains to the snap bean breeding. G7 and G2 progenies stood out from the others because of the high values obtained for weight of pod per plant and number of pod per plant. By means of the selection between and within the progenies for PVP and NVP, predicted additive gains of 15.765% and of 14.328% were respectively obtained.
CONFLICTS OF INTEREST
The authors declare no conflict of interest.
ACKNOWLEDGMENTS
The authors thank Coordenação de Aperfeiçoamento de Pessoal de Nível Superior (CAPES) and Fundação Carlos Chagas Filho de Amparo à Pesquisa do Estado do Rio de Janeiro (FAPERJ) for the scholarships that were granted and their assistance.
REFERENCES
Borém A (1997). Melhoramento de plantas. Viçosa: Editora da UFV, 547 p.
Brasil. (2017) Lista de cultivares protegidas. Disponível em: http://www.agricultura.gov.br/vegetal/registros-autorizacoes/protecao-cultivares/cultivares-protegidas, acessado em fevereiro de 2017. Página mantida pelo Ministério da Agricultura, Pecuária e Abastecimento.
Carbonnel SAM, Chiorato AF, Resende MDV, Dias LAS, et al., (2007). Estabilidade de cultivares e linhagens de feijoeiro em diferentes ambientes no estado de São Paulo. Bragantia. 66 (2): 193- 201. https://doi.org/10.1590/s0006-87052007000200003
Genetics and Molecular Research 17 (2): gmr16039914
Chiorato AF, Carbonell SAM, Dias LADS and Resende MDV (2008). Prediction of genotypic values and estimation of genetic parameters in common bean. Brazilian Archives of Biology and Technology. 51: 465-472.http://dx.doi.org/10.1590/S1516-89132008000300005
FAO (2014). http://www.fao.org/index_en.htm. Página mantida pela FAO.
Filgueira FAR (2013). Novo manual de olericultura: Agrotecnologia Moderna na produção e comercialização de hortaliças. Viçosa: Editora UFV, 412p.
Francelino FMA, Gravina GA, Manhães CMC, Cardoso PMR, et al., (2011). Evaluation of Promising of snap bean to the North and Northwest Fluminense. Revista Ciência Agronômica. 42: 554-562.http://dx.doi.org/10.1590/S1806-66902011000200039
Köppen W and Geiger R (1928). Klimate der Erde. Gotha: Verlag Justus Perthes. Wall-map 150cmx200cm.
Melo PC and Vilela NJ (2008). A importância da Cadeia Produtiva Brasileira de Hortaliças. Disponível em: http://www.abhorticultura.com.br/downloads/cadeia_produtiva.pdf> Acesso em: 29 janeiro de 2017.
Moreto AL (2008). Epistasia em cruzamento de feijão Andino × Mesoamericano. 67p. Tese (Doutorado em Agronomia) – Universidade Federal de Lavras, Lavras.
Resende MDV (2016). Software Selegen-REML/BLUP: a useful tool for plant breeding. Crop Breeding and Applied Biotechnology, Viçosa, 16 (4): 330 -339. https://doi.org/10.1590/1984-70332016v16n4a49
Resende MDV de (2007b). Software SELEGEN- REML/BLUP: sistema estatístico e seleção genética computadorizada via modelos lineares mistos. Colombo: Embrapa Florestas, 359p.
Torres FE, Teodoro PE, Sagrilo E, Correa AM, et al., (2015). Interação genótipo × ambiente em genótipos de feijão-caupi semiprostrado via modelos mistos. Bragantia. 74: 255-260.http://dx.doi.org/10.1590/1678-4499.0099
Vencovsky R, Herança quantitativa. In: Paterniani E; Viegas G.P. (Ed.). (1987). Melhoramento e produção de milho. Campinas: Fundação Cargill: 137-214.
Vieira JCB, Puiatti M, Cecon PR, Bhering AS, et al., (2014). Viabilidade agroeconômica da consorciação do taro com feijão-vagem indeterminado em razão da época de plantio. Rev. Ceres. 61(2) .http://dx.doi.org/10.1590/S0034-737X2014000200010
Vilela FO, Amaral Júnior AT do, Freitas Júnior SP, Viana AP, et al., (2009). Selection of snap bean recombined inbred lines by using EGT and SSD. Euphytica. 165 (1): 21-26. https://doi.org/10.1007/s10681-008-9733-2