Production, physical, chemical and sensory evaluation
of dried banana (Musa Cavendish)
Thales Henrique Barreto Ferreira*, Mírian Luisa Faria Freitas
Federal University of Grande Dourados (UFGD), School of Engineering (FAEN), Dourados-Itahum Road 7 Km 12, Cidade Universitária, Dourados, Mato Grosso do Sul, Postal code 79.804-970, Brazil
*Corresponding author:
Thales Henrique Barreto Ferreira, Federal University of Grande Dourados (UFGD), School of Engineering (FAEN), Dourados-Itahum Road 7 Km 12, Cidade Universitária, Dourados, Mato Grosso do Sul, Postal code 79.804-970, Brazil. E-mail: thales_barreto25@hotmail.com
Received: 21 December 2018 ; Accepted: 31 January 2019
INTRODUCTION
Banana is one of the most consumed fruit worldwide and it is highly nutritious. It has high carbohydrates, proteins, potassium and vitamins A and C contents; it may be consumed and used ripe or unripe, raw or processed (SEAB, 2018; Sena, 2011; Borges and Cordeiro, 2015). Among the fruits, according to the FAO data showed that banana is the main commercial product in the worldwide.
Brazil is the 4th largest banana producer in the world; its
production was estimated at 7,185 million tons in 2017, distributed on approximately 490 thousand hectares (FAO, 2018).
The best known variety in Brazil, banana nanica (Musa
Cavendish), is also known as banana-d’água, verde, anã, and
baba-da-china. It is the most widespread and one of the most important clones for global economy, thus the interest in studying it (Medina, 1978).
Despite its expressive production and distribution, banana consumption is still compromised, in part, due to the
constraints imposed by its low shelf life. It is a climacteric fruit and the period between an ideal ripening and the beginning of senescence is short, which means a very short shelf life (Prill et al., 2012). Therefore, industrialization presents itself as an alternative to use the production surplus and increase its shelf life, enabling its consumption for longer (Azoubel et al., 2010).
Among the conservation methods, drying is vastly used because it maintains the product’s characteristics, especially, its nutrients. Producing dehydrated banana, particularly dried banana, is a viable alternative to reduce the in natura fruit waste, due to moisture removal during industrialization; in addition, nutrients are concentrated and water activity is decreased in order to increase the product’s shelf life (Celestino, 2010).
However, most banana fruits darken fast during processing operations such as peeling, cutting and exposure to high temperatures. The dark coloration is due to its exposure to oxygen and/or enzyme activity, thus resulting in adverse changes to the fruit (Perreira et al., 2001). Enzyme
Brazil is one of the largest producer of banana in the world. However, its consumption is still compromised, because the fruit has a very short shelf life, which gives rise to the need for developing new ways to preserve it, such as drying or dehydration. The present study aims to produce dried banana by means of drying the fresh Musa Cavendish banana and to evaluate the influence of pre-treatments on the product’s quality and acceptability. Three samples were used: T1 was the control and had no pre-treatment; T2 received a pre-treatment composed of a sodium metabisulphite additive solution; and finally T3 was pre-treated with a citric and an ascorbic acid antioxidant solution.
The samples were characterized according to yield calculation, moisture, titratable acidity, soluble solids, pH, water activity (aw), color
parameters, instrumental texture, and sensory analyses for their overall acceptance and purchase intention. The yield was approximately 30% and there was low water activity and moisture in the product, even after drying for all treatments. There was also an influence of the pre-treatments on the physical, chemical and sensory characteristics of the dried banana. The overall acceptability results indicates
a possibility for marketing the product.
Keywords: Acceptability; Color parameters; Fruit drying; Instrumental texture
A B S T R A C T
http://www.ejfa.me/
inactivation or inhibition may be achieved through different methods, for example, removing oxygen or adding chemical additives, such as ascorbic acid, citric acid or sodium
metabisulphite, thus enhancing the final product’s quality
(Costa et al., 2011).
The sensory analysis is carried out to provoke, measure, evaluate and interpret the reactions caused by the characteristics of food products. They are perceived through the sensory organs: sight, smell, taste, touch and hearing and are important for evaluating the product acceptance by consumers (Ductkosky, 2013).
Thus, the present study aimed at producing dried banana
through the process drying “Musa Cavendish” and then
evaluating the influence pre-treatments with sodium metabisulphite, citric acid and ascorbic acid solutions had on it considering yield calculation, moisture, titratable acidity, soluble solids, pH, water activity (aw) analyses, color parameters, instrumental texture, and sensory analyses for acceptance and purchase intention.
MATERIALS AND METHODS
Materials
In order to carry out the experiments, we used banana nanica
(Musa Cavendish) that were manually picked from a rural property located in Dourados city, Mato Grosso do Sul state, Brazil (22° 12’ 10,4” S latitude and 54° 52’ 36,8” W longitude) in August 2018.
The sodium metabisulphite, citric and ascorbic acids used when preparing the solutions for the pre-treatments, as well as the necessary reagents for the characterization analyses, were all appropriate for the analyses (P.A.-Proanalysis).
Dried banana production
The experimental assays during this study were carried out in the Laboratório de Tecnologia de Alimentos at Faculdade de Engenharia (LATEC/FAEN) from Universidade Federal da Grande Dourados (UFGD).
The fruit items were transported to LATEC in coolers, where they were selected according to peel color; those that are visually damaged or in an early ripening stage were disposed of. They were then washed, sanitized through immersion in a sodium hypochlorite solution (100 ppm) for 15 minutes and rinsed with running water to eliminate
any excess chlorine. Subsequently, the bananas were peeled
and cut longitudinally and transversally, resulting in 4 pieces.
The samples were submitted to three treatments: T1 was the control in which the sample was not submitted to any pre-treatments with chemicals and/or antioxidants; T2
received a pre-treatment in which the sample was immersed in a food additive solution of sodium metabisulphite (0.5%)
for 10 minutes; finally, in T3, the sample was pre-treated in
an antioxidant solution with citric acid (4%) and ascorbic acid (1%) for 10 minutes. In order to dry the fruit, the
previously treated bananas were taken to a fixed-bed tray
dryer Cienlab CE-220/630 with hot air velocity at 0.5 m s-1,
measured through a digital anemometer at 65 °C during 24 hours.
Characterization of both in natura and dried banana
The in natura banana was characterized for moisture, titratable acidity, soluble solids, pH, water activity (aw) analyses and color parameters.
The dried banana was characterized for yield calculation, moisture, titratable acidity, soluble solids, pH, water activity (Aw) analyses, color parameters, instrumental texture and sensory analyses for its acceptance and purchase intention.
The production yield for dried banana was determined
through a correlation between the in natura and after
drying fruit mass (Equation 1), on a semi-analytical balance
(Bel Engineering, MARK205A), in triplicate with eight pieces each.
R F= .100P (1)
where R is yield (%), F is the in natura fruit mass (g) and P
is the fruit mass after drying (g).
Moisture was quantified through drying in oven (70 °C ±
5 °C) for 24 hours until reaching constant weight (AOAC, 1997). Total titratable acidity value (TTA) was obtained through titration with NaOH, at 0.01 N, after macerating samples in distilled water (AOAC, 1992). Total soluble solids contents (TSS) were determined by using a manual
refractometer (Quimis – Q-109B) and the results are
expressed in °Brix. The ratio was a result from total soluble solids and total titratable acidity (TSS/TTA).
Values for pH and water activity (Aw) were determined through a direct reading in a digital potentiometer
(Medidor Lab) and digital hygrometer (Aqualab, Decagon Devices Inc., EUA), previously calibrated with pH 4 and pH 7 standard solutions, and saturated solutions of NaCl
(Aw 0.755) and MgCl2 (Aw 0.331) salts, respectively.
The parameters for the bananas instrumental color were determined using a Konica Minolta colorimeter
(CR-400/Cr-410), with a CIE system L*a*b* (Comission
Internationale de L’Eclairage 1986). Readings were done at
on its axis in order to minimize variations in color and
equipment handling.
The evaluated parameters were luminosity (L*), which
varies from 0 (black) to 100 (white) and chromatic
coordinates a* (+a* = red; -a* = green) and b*
(+b* = yellow; -b* = blue). According to these, it was
possible to calculate Chroma (C) (Equation 2), the hue
angle (h) (Equation 3) and the color difference (∆E)
comparing the control treatment and the other treatments
(Equation 4) (Mc Guire, 1992).
C =
( )
a +( )
b* 2 * 2 (2)
h
b a
=
−
tan 1 ** (3)
∆ = ∆E ( L*) (2 + ∆a*) (2+ ∆b*)2 (4)
Where:
ΔE = color difference;
ΔL* = Lc (luminosity for the dried banana control) – Lt
(luminosity for the test);
Δa* = ac (a* value for dried banana control) – at (a* value
for the test);
Δb* = bc (b* value for dried banana control) – bt (b* value
for the test).
The texture profile was carried out with a texturometer Stable Micro Systems (TA-XT2i Goldaming, England) with a
flat-end cylindrical stainless steel probe (6 mm diameter), at
10 cm distance and pre-tests, test and post-tests velocities
of 1, 1 and 2 mm. s-1, respectively. The analysis was carried
out in ten repetitions and the evaluated parameters were cohesiveness, viscosity, elasticity, chewiness, resistance and adhesiveness.
Acceptability and purchase intention tests were conducted by 13 panelists from the Food Engineering Department at the Universidade Federal da Grande Dourados, who were
previously trained, and received the codified samples with
three digits in a monodic manner, as well as water, so that they could cleanse their palate before trying a new sample. The attributes for appearance, aroma, taste, texture, and general impression were evaluated through the samples acceptance test using a structured hedonic scale with 9 points, ranging from 1 (dislike very much) and 9 (like very much).
Samples that obtained scores higher than or equal to 6
(somewhat like) were considered accepted. Each panelist should also indicate their favorite sample and purchase
intention using the structured 5 point scale, varying between “would certainly buy it” and “certainly would not buy it” (Dutcosky, 2013).
RESULTS AND DISCUSSION
The production yield (%) of the dried banana was 30.45% for T1, 29.05 for T2 and 31.82% for T3, and there was no
significant difference (p > 0.05) among the samples. These
values were higher than those obtained by Jesus et al. (2005), which values that ranged between 15.5 and 26.2% yield for dried banana from different varieties were reported.
The physical, chemical characteristics and the color
parameters of the in natura bananas are shown in Table 1.
The moisture in the in natura banana nanica was 76.00
(g/100g), a similar value of 74 g/100g was obtained by Aurore et al. (2009). The presence of high levels of moisture in the banana before processing corroborates the high water activity of the fruit in natura (0.976).
The total soluble solids values obtained were close to those reported by other investigators in the literature, which are between 15.73% and 22.35% (Nascimento Júnior et al., 2008; Barroso et al., 2012; Leite et al., 2010; Francisco et al., 2014). The titratable acidity value (TTA), expressed in g malic acid/100 g banana, indicates the presence of some acidity, as a result of the pH (3.74) that was obtained for
in natura fruit.The ratio TSS/TTA is a representative index when measuring sugars or acidity in an isolated manner, because it expresses the sugar/acid proportion, which results in the fruit taste (Chitarra and Chitarra, 2005).
The color coordinates L* indicate a clear fruit (L* 57.39)
and predominantly yellow (b* 21.26), which is characteristic
of bananas at the optimal ripening stage.
Table 1: Physical and chemical characteristics and color parameters of in natura banana nanica (Musa Cavendish)
Analyses Mean value and
standard deviation (SD)
Moisture (g/100g) 76.00
pH 3.74±0.05
Total titratable acidity - TTA
(g malic acid/100g) 0.63±0.07
Total soluble solids - TSS (°Brix) 20.00±0.02
TSS/TTA 31.72±0.05
Water activity (Aw) 0.976±0.002
Color parameters
L* 57.39±5.90
a* 0.41±0.12
b* 21.26±2.99
C 21.43±3.01
The physical and chemical characteristics of the dried banana produced under the different conditions are shown
in Table 2. T3 sample showed a significant difference
(p ≤ 0.05) compared to the others for final moisture of the
product, thus corroborating the highest water activity value (Aw) among treatments (0.685). Also, when compared to the in natura fruit it is possible tocheck the efficiency of
drying through the decrease in moisture and Aw. T3 sample had the lowest pH value (3.18), which indicates higher acidity, since the antioxidants used in this study were citric
and ascorbic acid, responsible for giving the final product
this characteristic; it also showed the highest titratable acidity value (1.72 g malic acid/100g).
T1 sample had the highest values for the ratio TSS/TTA; the fruit with the highest TSS/TTA ratio tended to have a higher acceptance by consumers, given the presence of sugar (Bezerra and Dias, 2009).
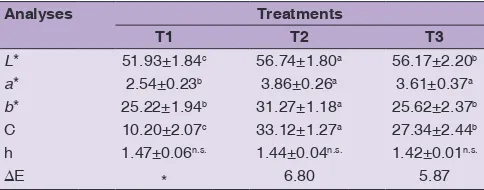
Regarding the color parameters after drying (Table 3), the
products showed means higher than 51.00 for L* (quite
clear samples), 2.00 for a* and 25.00 for b*, values close
to those observed by Santana et al. (2010) for in natura
banana Prata Anã.
T2 was the best treatment for color preservation, since it
obtained the closest value for luminosity parameter (L*)
when it was compared with in natura banana, and it could
influence the final acceptance of the product.According to Silva and Fernandes (2011), the dried banana should present a golden-brown (yellow brown) color.
The saturation indices (C) were higher than 27.00 for both T2 and T3 samples. However, T1 sample (control)
obtained a significant (p ≤ 0.05) lower value (10.20), thus indicating the efficiency of the pre-treatments in obtaining
more saturated and clear samples. Pre-treated samples with both sodium metabisulphite, and citric and ascorbic acids had values close to those reported by Santana and Silva
(2010) for in naturabanana Prata Anã with a saturation index
(C = 30.30). T3 treatment showed the lowest variation
in color (∆E) when compared to the control (T1), thus
suggesting that treatment with sodium metabisulphite solution (T2) generated a clearer dried banana than treatment with citric and ascorbic acid solutions (T3).
In Table 4, there are the instrumental texture values for
the parameters of adhesiveness (Kg m s-2), cohesiveness
(dimensionless), elasticity (dimensionless), viscosity
(Kg m s-2) and chewiness (kg) for dried banana produced
in tray dryers at a temperature of 65 °C.
Regarding the evaluated parameters, only viscosity and
chewiness had significant differences (p ≤ 0.05) among the
dried banana samples. The sugar concentration through drying may result in a variation of the food texture; this can be an important and desirable condition when incorporating and developing new products (Miranda et al., 2015).
Recent studies conducted by Missang et al. (2012), showed that the texture of a dehydrated fruit depends largely on the structure of the tissue and the cell wall composition. According to Bourles et al. (2009), the cohesiveness
shows the level of destruction of cell tissues after the first
compression cycle and the dried banana samples did not
show any significant difference (p > 0.05) among them
for this parameter.
The values for elasticity reported by Granados et al. (2014), when studying different varieties of banana cooked for different time periods, varied between 0.87 and 0.92; this data was very similar to that found in this present study (0.90 and 0.98), thus suggesting characteristic values for derivative products of banana. T2 sample had slightly higher values for chewiness (633.35 Kg), even though they
Table 2: Physical and chemical characteristics of the produced dried banana
Analyses Treatments
T1 T2 T3
Final moisture (%) 19.32b 17.39b 24.58a
pH 3.88±0.01a 3.67±0.02a 3.18±0.07b
Total titratable acidity - TTA (g malic acid/100g) 0.67±0.07b 1.23±0.06ab 1.72±0.10a
TSS 38±0.01b 57±0.05a 54±0.02a
TSS/TTA 56.69±0.17a 46.35±0.22a 31.40±0.09b
Water activity (Aw) 0.675±0.004n.s. 0.664±0.007n.s. 0.685±0.001n.s.
Means followed by letters showed a significant difference (p≤0.05) through Tukey’s mean test. n.s.: not significant
Table 3: Means of color parameters obtained for the dried banana produced under different treatments
Analyses Treatments
T1 T2 T3
L* 51.93±1.84c 56.74±1.80a 56.17±2.20b
a* 2.54±0.23b 3.86±0.26a 3.61±0.37a
b* 25.22±1.94b 31.27±1.18a 25.62±2.37b
C 10.20±2.07c 33.12±1.27a 27.34±2.44b
h 1.47±0.06n.s. 1.44±0.04n.s. 1.42±0.01n.s.
ΔE * 6.80 5.87
do not differ significantly (p > 0.05) from the rest of the
samples. This fact may be correlated to its low moisture contents (Igor and Velásco, 2010).
Table 5 shows the means of the evaluated attributes in the sensory analysis for acceptance of the different samples of dried banana: appearance, aroma, taste, texture, and general impression.
The dried banana samples produced under different
treatments differed significantly (p ≤ 0.05) only to what
the attribute appearance is concerned, thus indicating that T2 and T3 samples were best accepted by the panelists.
On the other hand, the T1 sample had the lowest scores for the attributes appearance and general impression; those scores may be due to the darker color obtained during
drying, shown by the coordinate L*. Even though the
pre-treatments are efficient in the dried banana production, there is also a slight compromise in its characteristic flavor. The attribute “flavor” had the lowest scores for T2 and T3,
(6.41 and 6.53, respectively); however, they did not show a
significant difference (p ≤ 0.05) from control (T1).
Corroborating the scores of the evaluated attributes, the acceptance indices presented in Table 6 were higher for
T2 and T3 samples, proving again the efficiency of the
pre-treatments. The attribute appearance of the T2 sample presented the highest mean value (7.25) in Table 5 and high score for the acceptance index (80.55%) in Table 6. In another way, the T1 sample obtained the lowest mean value for appearance (5.84) and lower acceptance index (64.88%).
Dutcosky (2013) suggested that for a sample to be accepted, it should have an acceptance index higher than 70%. Therefore, for most of the evaluated attributes, the samples were accepted, except for the appearance and texture attributes of the control sample (T1); to what texture
is concerned, the samples did not show any significant difference (p ≤ 0.05) among them.
Figure 1 shows panelists’ purchase intention if the products were marketed; T3 sample was best ranked by panelists, as 40% of them would buy it.
For the preference for the evaluated dried banana samples, T3 sample was the most preferred by the panelists, which
justifies its high acceptance, approximately 62% of the
judges, followed by T2 sample (23%) and T1 sample (15%). The product acceptance, especially with the pre-treatments application, indicates the possibility of marketing the product.
Other researchers also have studied the addition of pre-treatments to banana drying, such as the ascorbic acid addition (Abano and Sam-Amoah, 2011; Thuwapanichayanan et al., 2011) and other kinds of pre-treatments like honey dipper
Fig 1. Purchase intention for the different samples of dried banana.
Table 4: Texture profile analysis (TPA) for dried banana
Attributes T1 T2 T3
Adhesiveness (Kg m s-2) -0.13±0.01n.s. -0.14±0.02n.s. -0.13±0.02n.s.
Cohesiveness (dimensionless) 0.75±0.05n.s. 0.68±0.07n.s. 0.61±0.13n.s.
Elasticity (dimensionless) 0.90±0.03n.s. 0.98±0.08n.s. 0.93±0.06n.s.
Viscosity (Kg m s-2) 547.38±26.16b 600.57±63.25a 532.42±53.26b
Chewiness (Kg) 629.27±38.40a 633.35±64.82a 603.33±89.53b
Means followed by letters showed a significant difference (p≤0.05) through Tukey’s mean test. n.s.: not significant
Table 5: Means of the evaluated attributes for the different samples of dried banana
Attributes T1 T2 T3
Appearance 5.84±1.26b 7.25±1.18a 6.77±1.36a
Aroma 6.90±1.66n.s. 6.91±1.80n.s. 7.02±1.56n.s.
Flavor 7.00±1.12n.s. 6.41±1.38n.s. 6.53±2.06n.s.
Texture 6.25±1.73n.s. 6.75±1.69n.s. 6.83±1.08n.s.
General impression 6.50±1.08n.s. 6.53±1.47n.s. 6.80±1.70n.s.
Means followed by letters showed a significant difference (p≤0.05) through Tukey’s mean test. n.s.: not significant
Table 6: Acceptance index (%) of the evaluated attributes for dried banana
Attributes T1 T2 T3
Appearance 64.88b 80.55a 75.22a
Aroma 76.67n.s. 76.78n.s. 78.00n.s.
Flavor 77.78n.s. 71.22n.s. 72.55n.s.
Texture 69.45n.s. 75.00n.s. 75.89n.s.
General impression 72.23n.s. 72.55n.s. 75.56n.s.
and ultrasound (Abano and Sam-Amoah, 2011; Azoubel et al., 2010). The authors presented that pre-treatments in
fruit drying may increase the final product acceptability,
as seen in this study.
The product acceptance, especially with the pre-treatments application, indicates the possibility of marketing the product.
CONCLUSION
The drying process of bananas in order to produce dried banana is commercially viable. However, there is a need to apply pre-treatments which will help maintain the physical, chemical and sensory characteristics of the product after drying. Although the sample pre-treated with sodium
metabisulphite was very close to that in natura regarding
color, the sample pre-treated with antioxidants was better accepted. As a result, based on the acceptance results, we conclude that there is a possibility for marketing dried banana.
The use of different natural antioxidants sources, like jaboticada extract, as fruit drying pre-treatment can be pointed out as future works. It could appeal consumers interested in natural products. Another suggestion of future works could be about the study of fruit dried shelf life under different storage conditions.
Author’s contributions
The both authors worked together in all steps of the elaboration of the present manuscript, that is, the aims
definition, data collection and analyses, and written the
paper.
REFERENCES
Abano, E. E. and L. K. Sam-Amoah. 2011. Effects of different pretreatments on drying characteristics of banana slices. J. Eng. Appl. Sci. 3: 121-129.
AOAC. 1992. Association of Oficial Analytical Chemistral. Official Methods of Analysis of the Association of Official Analytical Chemistry. 11th ed. AOAC, Arlington.
AOAC. 1997. Association of Oficial Analytical Chemistral. Official Methods of Analysis of the Association of Official Analytical Chemistry. 16th ed. AOAC, Arlington.
Aurore, G., B. Parfait and L. Fahrasmane. 2009. Bananas, raw materials for making processed food products. Trends Food Sci. Technol. 20: 78-91.
Azoubel, P. M., M. A. M. Baima, M. R. Amorim and S. S. B. Oliveira. 2010. Effect of ultrasound on banana cv. Pacovan drying kinetics. J. Food Eng. 97: 194-198.
Barroso, A. A. F., T. V. A. Viana and A. B. Marinho. 2012. Qualidade pós-colheita dos frutos da bananeira sob diferentes lâminas de irrigação na chapada do Apodi, Ceará. Rev. Bras. Agric. Irrigada. 6: 81-88.
Bezerra, V. S. and J. S. A. Dias. 2009. Avaliação físico-química de frutos de bananeira. Acta Amazôn. 39: 423-428.
Borges, A. L. and Z. J. M. Cordeiro. 2015. Sistemas de Produção de Baixo Impacto Para Bananeira. Simpósio Brasileiro Sobre Banicultura. Available from: http://www.ainfo.cnptia.embrapa. br/digital/bitstream/item/126851/1/Sistemas-de-producao-de-baixoimpacto.pdf. [Last retrieved on 2018 Nov 20].
Bourles, E., E. Mehinagic, J. L. Courthaudon and F. Jourjon. 2009. Impact of vacuum cooking process on the texture degradation of selected apple cultivars. J Food Sci. 74: 512-518.
Celestino, S. M. C. 2010. Princípios de Secagem de Alimentos, Embrapa Cerrados, Planaltina.
Chitarra, M. I. F. and A. B. Chitarra. 2005. Pós-Colheita de Frutos e Hortaliças: Fisiologia e Manuseio. Revisões e Amplicações, UFLA, Lavras.
Costa, A. C., P. L. Antunes, C. V. Rombald and M. A. Gularte. 2011. Controle do escurecimento enzimático e da firmeza de polpa em pêssegos minimamente processados. Ciênc. Rural. 41: 1094-1101.
Dutcosky, S. D. 2013. Análise Sensorial de Alimentos. Champagnat, Curitiba.
FAO. 2018. Food and Agriculture Organization of the United Nations. FAOSTAT-Banco de Dados Estatísticos de Cultivos Agrícolas. Available from: http://www.fao.org/state-of-food-security-nutrition/en. [Last retrieved on 2018 Nov 29].
Francisco, M. S., R. C. Araújo and E. P. S. Santos. 2014. Efeito das condições de manejo nas características sensoriais de banana (Musa Spp.) cv. Pacovan. Rev. Bras. Fruticultura. 36: 313-317. Granados, C., D. Acevedo, A. Cabeza and A. Lozano. 2014. Análisis
de perfil de textura en plátanos pelipita, hartón y topocho. Inf. Tecnol. 25: 35-40.
Igor, J. and V. A. Velásco. 2010. Análisis de las propiedades de textura durante el almacenamiento de salchichas elaboradas a partir de tilapia roja (Oreochromis Sp.). Rev. Biotecnol. Sect. Agropecu. Agroind. 8: 46-56.
Jesus, S. C., F. C. A. Matsuura, M. I. S. Folegatti and R. L. Cardoso. 2005. Avaliação de banana-passa obtida de frutos de diferentes genótipos de bananeira. Pesqui. Agropecu. Bras. 40: 573-579. Leite, G. A., E. V. Medeiros and Ç. A. V. Mendon. 2010. Qualidade
pós-colheita da banana ‘pacovan’ comercializada em diferentes estabelecimentos no município de Mossoró, RN. Rev. Bras. Ciênc. Agrár. 5: 322-327.
McGuire, R. G. 1992. Reporting of objective color measurements. HortScience. 27: 1254-1555.
Medina, J. C. 1978. A cultura do abacaxi. In: Medina, J.C., et al. Frutas Tropicais 2, Canton, São Paulo, p. 6-68.
Missang, C. E., J. F. Maingonnat, C. M. Renard and J. M. Audergon. 2012. Apricot cell wall composition: Relation with the intra-fruit texture heterogeneity and impact of cooking. Food Chem. 133: 45-54.
Miranda, D. S. A., T. Pessoa, J. P. G. Gouveia, F. F. Gurjão, R. M. M. Pinheiro and A. G. L. Martins. 2015. Avaliação de textura e aceitação sensorial da passa de goiaba. Rev. Tecnol. Ciênc. Agropecu. 9: 7-11.
Nascimento B. B. Jr., L. P. Ozorio and C. M. Resende. 2008. Diferença entre bananas de cultivares prata e nanicão ao longo do amadurecimento: Características físico-químicas e compostos voláteis. Ciênc. Tecnol. Alimentos. 28: 649-658.
Santana, F. A. and A. S. S. Silva. 2010. Avaliação da cor dos Frutos de Diferentes Genótipos de Bananeiras por Colorímetro Digital. Sociedade Brasileira de Fruticultura. Available from: https:// www.ainfo.cnptia.embrapa.br/digital/itstream/item/37009/1/ SantanaID27240pdf2378.pdf. [Last retrieved on 2018 Nov 07]. Sena, J. V. C. 2011. Aspectos da Produção e Mercado da Banana
no Nordeste. Escritório Técnico de Estudos Econômicos do Nordeste-ETENE. Available from: http://www.edi.bnb.gov.br/ content/aplicacao/etene/etene/docs/ire_ano5_n10.pdf. [Last retrieved on 2018 Sep 27].
SEAB-Secretaria de Estado da Agricultura e do Abastecimento. 2018. DERAL-Departamento de Economia Rural. Available from: http:// www.agricultura.pr.gov.br/arquivos/File/deral/Prognosticos/ 14_15.pdf. [Last retrieved on 2018 Sep 09].
Silva, C. A. B. and A. R. Fernandes. 2011. Projeto de Empreendimentos Agroindustriais-Produtos de Origem Vegetal. UFV, Viçosa. Thuwapanichayanan, R., S. Prachayawarakorn, J. Kunwisawa and