In year 2008, regulation of Indonesian telecommunicationindustries changes due the tariff pricing war within Telecommunication opera-tor. This regulation tie up the telecommunication operator and affect operating revenue margin.The needs of financial flexibility within tele-communication firm is increased.Capex, operating revenue and re-investment needs to be flexible must be inline with competition and change of technology. This paper goals is measuring financial flexibility based on Capex, operating revenue and re-investment needs.Re-in-vestment needs by Telecommunication operator can be financed with or without financial flexibility. Data from year 2007 up to 2014 is selec-ted to accommodate before and after changes of telecommunication regulation. The regulation effect to financial flexibility of telecommu-nication firm is still relevantbecause telecommutelecommu-nication industries by nature needs larger capital to re-new the telecommunication techno-logy. Real options method will be used to measure financial flexibility.
© 2015 IRJBS, All rights reserved. Keywords:
Financial flexibility, Price war,
Telecommunication Regulation, Real Option
Corresponding author: [email protected]
A R T I C L E I N F O A B S T R A C T
Vol. 8 | No. 2 ISSN: 2089-6271
Financial Flexibility in Highly Regulated Market:
Indonesian Telecommunication Case during
Tariff Pricing War
Y. Arief Rijanto
Finance Department, Prasetiya Mulya Business School, Jl. RA Kartini, Cilandak Barat Jakarta Selatan 12430
INTRODUCTION
The current Indonesian telecommunications policy reflected inIndonesian Government’s “Blueprint of the Indonesian Government’s policy on Telecommunications,” by Ministry of Communications Decree No. KM 72 of 1999.There are three important changes are : (1) liberalize the sector with a competitive structure byremoving monopolistic controls, (2) increase transparency and predictability of the regulatory framework,
and (3) create opportunities for national telecommunications operators partners.
not harm the operators. And the operator can still makes investment in new technology without predatory pricing but also not harm consumers by higher price. The puzzle for regulators is how to create and manage dynamic conditions of competition between product, services and technologies that drive the telecommunications industry was growing up and stronger (Boyer, 2008).
The Indonesian Government prohibit operators from abusing a dominant position. Ministry of Communications issued Decree No. 33/2004 to preventing monopolies and unfair competition which sets forth measures to prohibit the abuse of their dominant position by network and ser-vice providers. The Decree prohibits a dominant provider from engaging in practices such as dum-ping, predatory pricing, cross- subsidies, compel-ling consumers to use such provider’s services (in purpose to the exclusion of competitors) and hampering mandatory interconnection (including discrimination against specific providers). Februa-ry 5, 2008, the Indonesian Government issued a regulation mandating tariff adjustments to the cost-based interconnection tariff regime.
There is a main changes of telecommunication regulation in 2004 and 2008 in Indonesia that triggering more competition within
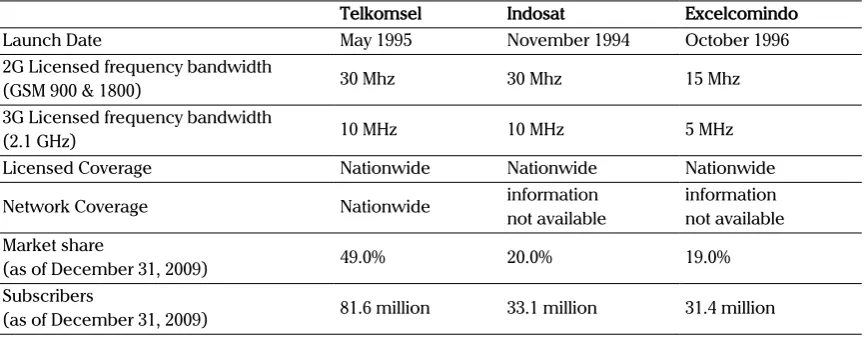
telecommunication operators. The competition started the tariff war. The existence of tariff packages offer low-cost carriers to make a number of large customers and the greater communication traffic. Telkomsel subscribers at the end of year 2008 rose 37% to 65.3 million compared to year 2007. Indosat rose 66% to 36.5 million, and XL rose 48% to 22.9 million. However, profit operators inevitably eroded. In 2008, Telkom’s revenues (which contributed the majority of Telkomsel), to reach Rp 60.7 trillion or an increase of 2.1%. However, Telkom’s net profit fell 17.4% to $ 10.6 tribune. Indosat’s revenue in 2008 also rose 13% to 16.5 billion, but net profits were down from Rp 2.04 trillion to Rp 1.88 trillion. Revenue XL 2008, and even grew 45%, but the operator XL loss of Rp 15 billion. On the other hand, competition between operators is beneficial to consumers. Regulators perform its function as a regulator of the level of healthy competition. Figure 1 is operator market share and subscribers in year 2009.
Performance of Indonesian telecommunications industry bounce back from its lowest point in the second quarter of 2010. According to Business Monitor International, the Subscriber will increase from 211 million in 2010 to 390 million in 2011. However, the majority of the increase came from low value prepaid subscriber driven by competi-tion and price wars between operators. The
subs-Telkomsel Indosat Excelcomindo
Launch Date May 1995 November 1994 October 1996
2G Licensed frequency bandwidth
(GSM 900 & 1800) 30 Mhz 30 Mhz 15 Mhz
3G Licensed frequency bandwidth
(2.1 GHz) 10 MHz 10 MHz 5 MHz
Licensed Coverage Nationwide Nationwide Nationwide
Network Coverage Nationwide informationnot available informationnot available Market share
(as of December 31, 2009) 49.0% 20.0% 19.0%
Subscribers
(as of December 31, 2009) 81.6 million 33.1 million 31.4 million
source: Telkom.co.id
criber increase is not necessarily will increase company revenue due to a decrease in average revenue per unit (ARPU - Average Revenue per Unit) and overall company revenue. Improved low-cost prepaid Subscriber is expected to conti-nue over the next 5 years, but otherwise the pany’s revenue tends to fall. If the trend of com-petition between operators resulting in revenue decline continues, it’s create a greater risk. How to measure financial flexibility under highly regulated market and the needs of re-investment with pro-per competition risk? Real options method based on Damodaran (2001) real option modelwill be used to measure financial flexibility and re-invest-ment activity because of new technologies in the telecommunications industry. Real Options is one of the alternative methods of investment, espe-cially investment opportunities that require large funds and non-refundable.
Theoritical Framework
Regulation and Competition in Telecommunication Industries
The regulatory intervention forimproving the economic efficiency should be at lower medium level while it is required to havehigh regulatory policies for the development of mobile telecommunications service (Leng, 2015). Future of competition in product and technology plays an important role in our actual or potential competition that determines the level of competition between telecommunication operators. The identity and potential competitor relatively difficult to guess due to the rapid development of technological innovations, products and customer service. In addition, telecommunications products and services should be viewed as a vector technology that produces entertainment and communication features that provides value to customers. Customer demand for products or expressing certain service that contribute to the overall connectivity, flexibility, security, dependability, accessibility, capacity and friendliness of telecommunications technologies. So, customers do not just use one product and
service but individual communications portfolio. There are interdependencies between products and telecommunications services on a single individual. The number of people owning a smartphone is growing rapidly. These individuals are able to make voice calls and browse the Internet with the same mobile device use substitutes or supplements or does not affect established mobile voicecalling gains economic relevance (Gerpott, 2015). Regulators must understand the communication problem is because the portfolio impact on the welfare of its customers.
According to Boyer (2008), the role of regulators in order to regulate the telecommunication industries should be based on three principles of economic efficiency:
1. Conduit of reliable information for consumers on the pricing structure and product characteristics that had connectivity,flexibility, security, reliability, accessibility, capacity and user-friendliness.
2. As a field manager who set the level of competitive conditions that support both static efficiency and dynamic efficiency, and implement policies to indirectly control the monopoly and predatory pricing, the division based on the full cost of products and services.
3. Promoter of efficient investment
program in the network construction and maintenance to ensure the integrity of global telecommunications networks, and designing pricing rules incorporate access all network access fees. Regulatory oversight of the telecommunications industry will be truly pro-competition and is an integral part of the implementation of competition policy.
to get a certain portion of market share. Only new entrant with the advantages of potential technologies, products, customer or services that can compete with the incumbent who get admission telecommunications industry. Inefficient competitors are not allowed to enter. Customers will benefit from the efficiency level of healthy competition.
Gentzoglanis (2004) suggest telecom managers need to make decisions strategies to amid the increased of volatility. Strategic decisions relating to investments in new technologies to be crucial for customer satisfaction growth and demand. A decisive factor in the decision making process of investment was able to be different in case of regulatory changes and competition between operators in the telecommunications industry.
Investment Decisions and Competition Risk
Indonesian telecommunications regulatory changes in year 2006 and 2008 to encouraged competition between telecommunications operators. Alesina et al., (2005) explain that competition lowers companymarkup and as a consequence, companies must invest more to improve the company’s competitive advantage. Conversely, Aghion et al., (2005) argues that in addition to lowering the value of mark-up, competition is shortening the availability of internal funds and will ultimately increase the cost of capital. The ability of any investment company will drop due to increased investment costs.
Increased competition tends to reduce investment in line with standard models of Industrial Organization. The relationship of competition and investment decisions are negative (Aghion& Griffith, 2005; Martin, 2002). That is, the higher the level of competition, the smaller the investment can be made by the company. Then, the impact of economic conditions and political stability to investment increasingly obvious. Good economic conditions to stimulate investment. Political stability is the precondition for all investment
activities (Drazen, 2000).
The source of fund for investment determine firm capital structure. And financial flexibility is the most important determinant of capital structure, flexibility can accordingly be obtained through a firm’s capital structure policy (Graham & Harvey, 2001). By preserving access to low-cost sources of external capital, firms are able to achieve aflexible capital structure, which in turn preserves financial flexibility (Byoun, 2008).
Investment opportunities analysis methods which is widely used in the telecommunications industry today is a engineering process models to estimate the forward-looking costs. According to Alleman (2002), methods of engineering economics and cost less than satisfactory because they do not accommodate uncertainty and the dynamics of the telecommunications business. While in the financial sector increasingly moves into a dynamic model that can connect the real business to the financial market.
flexibility of real options in minimizing the risk of investment and competition.
Regulatory, market, competition and other pressures in the telecommunications industry forcing companies to develop technologies faster than competitors. Gentzoglanis (2004) emphasize that the real options method can be a useful tool for risk management in making capital investment decisions in the midst of the volatility of the telecommunications business. The existence of models and computer-based method allows the application of real options in the future better in anticipating the risk of competition.
Benaroch (2001) define the relationship of investment decisions and risks of competition is divided into three:
1. Firm-specific risk is the risk that arises because of endogenous factors of the company. This risk could be due to the uncertainty of the company meet a long-term capital-intensive investment.
2. Competition is due to risk factors in the control of competitors.
3. Market risk is due to uncertain factors thataffect every firm considering the same investment.
The competition risk had a payoff for the company. Gentzoglanis (2004) define types of risks and their effects on cost and payoff. The higher level of competition creates more impact on the payoff received by the company. So variations in corporate earnings is strongly influenced by the presence of competition. The variability of revenue, volatility and the risk of competition related to company operating revenue. Benaroch (2001) and Gentzoglanis (2004) confirms that the trend in competition, technological changes, network effects, exigencies of capital markets and unpredictable changes in regulatory policies are some of the factors making the investment decision process more dynamic rather than static. Managers need to have an options and flexibility in
their decisions to invest. The uncertainties created by the lack of information. Capital investment is a risky activity and financial flexibility has a value added to manage the competition risk. Generally, lack of information, uncertainties, and irreversibility are the factors for the creation of an option as a value. So Real Option method can be used in the telecommunications industry to create values more than competitor.
Real option and Investment Opportunities
DCF method uses the assumption of the project will conform to expectations without management intervention in the process of project implementation. All the uncertainty is represented by the discount rate appropriate to the risks. DCF approach is static. It’s not a flexible approach. Real option method enables the flexibility to postpone, cancel, modify according to circumstances. Real options model can be combines a Discounted Cash Flow model with real options in order to take into account the different drivers of net asset value, future rentals income and capital expenditures policy (Dubreuillea et.al. 2015). Alleman (2002) emphasized the importance of management flexibility in anticipation of regulatory changes and competition in the telecommunications industry.
Busby and Pitts (1997) reported from 72 sample that firms recognize the flexibility is determining factor in investment decisions but only 23.4% who admitted to have procedures to conduct such flexi-bility. Graham and Harvey, 2001 conducted a sur-vey whose results showed DCF and NPV methods most widely used is (75% of the 392 respondents). And only 27% indicated is not in line with the real option in the evaluation of investment decisions.
(Lambrecht, 2004). Smit and Trigeorgis (2004) using a combination of real options and games to develop the company’s investment strategy .The dynamics of investment strategy can be measured from company financial flexibility respond to competitive environment.
Real option models based on the assumptions companies have choices and can do it (choosing option). Real option is a practical option deals with “real” activities. It’s based on option theory in finance. Option is a right (not obligation) to holders of options to carry out the transaction (buy or sell). Party option seller (writer) is obliged to buy or sell some shares to option holders. If the option is expressed in the form of contract between the seller and the holder of the option to transact a number of shares at a specified price at the time the contract matures. There are two types of option: Call and Put options.
Call Option is the right to buy shares. Right to buy is obtained by the holder of the call (call holder) that buy a call option on the call price (strike price) within a period and a certain stock price prior to maturity of option contracts. The call option hol-ders of contracts will have a return or a profit if at maturity of call option, the stock price ≥ call price + call strike price. If the opposite occurs, the price of the stock price ≤ call price + call strike price, so the call contract holders will experience a loss of call option contracts. Put Option is the right to sell shares. It acquired the rights to sell of the put option holder on the deal to put at the price, du-ration and price of shares at the certain maturing (the strike price). The holder of a put option will break even or benefit if at the time of maturity, the price of the stock price ≤ put strike price - the price of the put option contract. The benefit using call or put option by investor is the option payoff.
In general, both the call option and put option, if the strike price will create a loss, the option will not be executed by the option holder. If there is such a case, the option holder will choose to ignore the
option and did not execute the contents of the op-tion contract. This can be done because the opop-tion is a right and not an obligation for the option hol-der. By ignoring options, losses will be minimized only to the extent the price of option contract pur-chased from the option writer. The application of real option in investment decision-making is a call option look like because the investment is an act of spending, just like a call option.
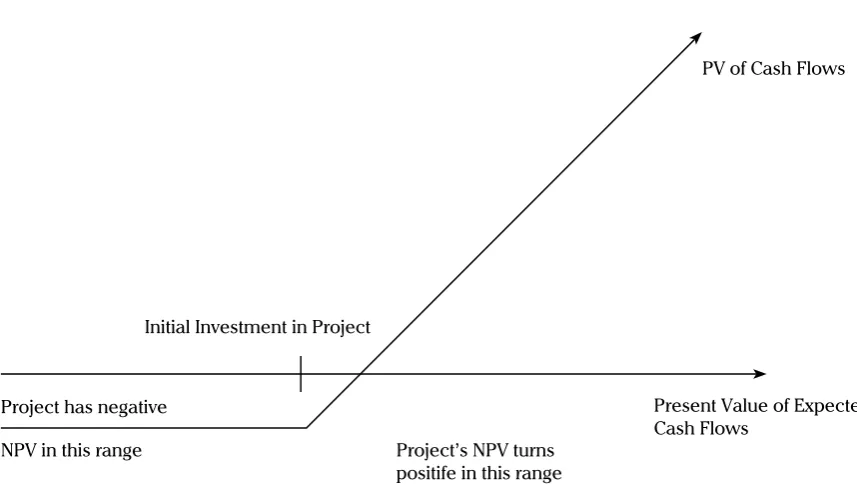
Damodaran (2001) argue that real option method can be used asCall option application to delay ini-tial investment in project. Real Option Payoff in Fi-gure 1 shows a call option with the underlying as-set is an investment in the project, the strike price of the option is the investment needed to take the project; and the life of the option is the period for which the firm has rights to the project. The pres-ent value of the cash flows on this project and the expected variance in this present value Represent the value and the variance of the underlying asset.
METHODS
Real Option Method
telecommunications industry in the capacity to be realized when the usage exceeds 50% of installed capacity.
The Black-Scholes option pricing model (Black-Scholes, 1975) is used to value financial flexibility as a real option (Damodaran, 2001; Mun, 2002; Gentzoglanis, 2004). Black-Scholes model is designed to follow Europen protected by the dividend option. Executed or the possibility of dividend payments does not affect the value of call option. The value of call option in the Black-Scholes model are:
S = Current value of the underlying asset K = Strike price of the option
t = Life to expiration of the option
r = Riskless interest rate corresponding to the life of the option
s2 = Variance in the ln(value) of the underlying
asset
Black-Scholes model modified by Damodaran (2001) for the real options application is:
Value of call = SN (d1) - Ke-rt N (d
2)
where the value of d1 and d2:
d2 = d1 - s√t d1 = ln (s/k) + (r + s2/2) t
s√t
The value of a put is can be derived from the value of a call with the same strike price and the same expiration date through an arbitrage relationship that specifies that:
C – P = S – K.e-rt
Where C is the value of the call and P is the value of the put (with the same life and exercise price). This relationship can be used to value puts. Substituting the Black-Scholes formulation for the value of an equivalent call:
Value of put = Se-yt (N (d
1) - 1) - Ke-rt (N (d2) - 1)
where
d1 = ln (s/k) + (r - y + s2/2) t s√t
PV of Cash Flows
Initial Investment in Project
Project has negative
Project’s NPV turns positife in this range
Present Value of Expected Cash Flows
NPV in this range
Damodaran (2001) summary the process of valuation of options using the Black-Scholes model involves the following:
Step 1 : The inputs to the Black-Scholes are used to estimate d1 and d2.
Step 2 : The cumulative normal distribution functions, N(d1) and N(d2), corresponding To these standardized normal variables are estimated.
Step 3 : The present value of the exercise price is estimated, using the continuous timeversion of the present value formulation: Present value of exercise price = K e-rt
Step 4 : The value of the call is estimated from the Black-Scholes model.
Value of financial flexibility as an option assume that companies must have expectations of how much to invest in future periods, based on historical data of companies and competitive conditions in the industry. On the other hand, companies also have expectations of how much and which can be collected through internal funding and how the cost of access to capital markets in the future. If one assumes there is volatility in expectations
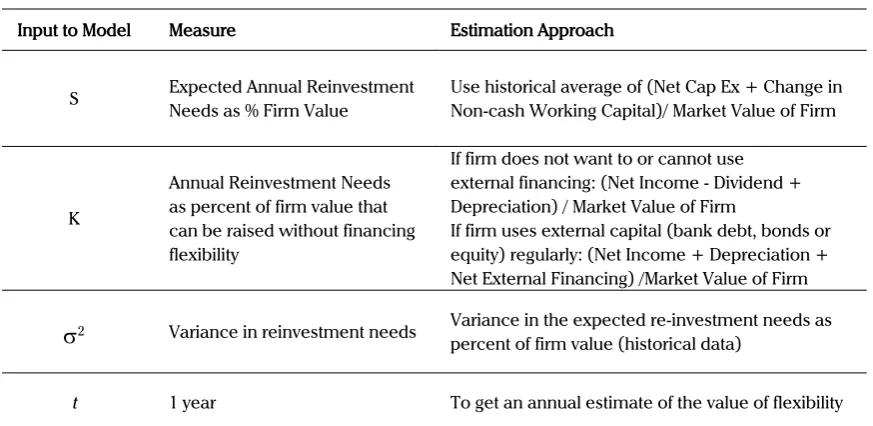
in the future regarding the re-investment needs, the capacity is assumed to generate funds by the company. Profits have excess debt capacity or large cash balances are the company’s ability to accommodate the needs of the investment using the company’s debt capacity. Payoff of this activity is expected to come from the excess returns. Damodaran (2001) assessed the annual financial flexibility, measured by real option as Tabel 2.
Gentzoglanis (2004) shows competition risk is against the payoff received by the company. The competition affects the company revenue. This study proposed modifications to estimate the real option approach Damodaran (2001) based on firm value with the competition risk based on changes in revenue due to competition between telecommunication operators. Therefore, this study proposed measurement methodology of real options by changing the basis of firm value in Damodaran real option model to Operating Revenue (Competition Risk Estimation Approach) as Table 3.
Financial Data and Research Samples
This real option study is to use quarterly financial data from Indonesia Stock Exchange and Business
Input to Model Measure Estimation Approach
S Expected Annual ReinvestmentNeeds as % Firm Value Use historical average of (Net Cap Ex + Change in Non-cash Working Capital)/ Market Value of Firm
K
Annual Reinvestment Needs as percent of firm value that can be raised without financing flexibility
If firm does not want to or cannot use external financing: (Net Income - Dividend + Depreciation) / Market Value of Firm
If firm uses external capital (bank debt, bonds or equity) regularly: (Net Income + Depreciation + Net External Financing) /Market Value of Firm
s
2 Variance in reinvestment needs Variance in the expected re-investment needs as percent of firm value (historical data)t 1 year To get an annual estimate of the value of flexibility
Monitor International reports in the period years 2007 to 2014. The research sample was chosen based on Telecommunications Company or a holding company listed on the Indonesia Stock Exchange during the years 2007-2014. There are four company; Telkomsel (TSEL), Indosat (ISAT), XL Axiata (EXCL) and Bakrie Telecom (BTEL). Company’s financial data in accordance with the Damodaran (2001) methodology of real options wich is needs data : Capital Expenditure (CAPEX), Operating Revenue (OperatingRev), Capital Expenditure as percentage of Operating Revenue (CapExasOpRev) and Net profit (NetProfit).
RESULTS AND DISCUSSION
The stasistic summary of variable used for real option model as show in Table 4. Capital expenditure of four telecommunication company during year 2007-2014 is vary from -12.58 to 20650.0 that show the different investment activity. Statistic mean of Operating Revenue is less than its standard deviation, indicate that some company better than the other. And standard deviation of Net Profit is bigger than its statistic mean. We can conclude that there are a un equal competition in Indonesian the telecommunication industries during year 2007-2014.
Input to Model Measure Competition Risk Estimation Approach
S
Expected Re-investment needs as % of Operating Revenue with competition risk
Use historical average of (Cap Ex + Change in Non-cash Working Capital)/ Operating Revenue
K
Reinvestment Needs as percent of Operting Revenue that can be raised without financing flexibility
If firm does not want to or cannot use external financing :
(Net Income - Dividend +Depreciation)/ Operating Revenue
s
2 Variance in reinvestment needswith competition risk
Variance in the expected reinvestment as percent of Operating Revenue (using historical data)
t
4 Month(1 Quarter or 0,25 year) To get an quarter estimate of thevalue of financial flexibility with competition risk Table 3. Real Option Measurement with Competition RiskVariable Mean Median Minimum Maximum
CAPEX 3105.49 1945.29 -12.5847 20650.0
OperatingRev 4604.12 1880.00 -556.189 38800.0
CapExasOpRev 1.39800 0.674120 -15.6692 56.1979
NetProfit 1395.96 537.965 -2150.68 13620.0
Variable Std. Dev. C.V. Skewness Ex. kurtosis
CAPEX 3413.46 1.09917 2.24559 6.22686
OperatingRev 6141.63 1.33394 2.58315 8.99846
CapExasOpRev 5.52311 3.95074 7.46492 74.8567
NetProfit 2417.57 1.73183 2.14312 6.22132
Damodaran (2001) real options model calculation is based on the Black Scoles model to demonstrate financial flexibility associated with the risk of competition. A proxy to capture the effects of competition based on Gentzoglanis (2004) argument that confirms the competition risk can be seen from the change in operating revenue. This study modified real option model on the estimation approach with an emphasis on Capex Operating Revenue compared intercompany to capture the effects of competition risk. Result of financial flexibility value of Telkomsel, Indosat, XL Axiata (EXCL) and Bakrie Telecom are shown in Table 5, 6 and 7.
Table 5 shows the re-investment needs that can be finance by operating revenue compared with the weighted average cost of capital (WACC) which is different at each company. Bakrie Telecom (BTEL) has the highest weighted average cost of capital. Indosat (ISAT) has the highest re-investment requirements up to 265.17% compared to operating revenue in the years 2007 to 2014. XL Axiata (EXCL) also requires a re-investment of about 195.62% of its operating revenue. Telkomsel (TSEL) has the lowest re-investment risk with standard deviation (std = 0.573) of investment activity is relatively low compared to other operators. Bakrie Telecom needs soaring in
Company Weighted Average Cost of Capital (2007-2014)
Re-investment needs as percent of Operating
Revenue
Standard Deviation in Re-investment needs
Telkomsel (TSEL) 16.26% 52.00% 0.573
Bakrie Telecom (BTEL) 25.21% 145.21% 1.749
Indosat (ISAT) 19.99% 265.17% 1.174
XL Axiata (EXCL) 22.86% 195.62% 0.832
Table 5. Re-Investment needs as percent of Operating Revenue
Company Re-investment needs that can be financed without flexibility
Maximum Re-investment needs that can be financed
with flexibility
Value of the Call Option for Financial
Flexibility
Telkomsel (TSEL) 15.65% 159.40% 0.100
Bakrie Telecom (BTEL) 0.26% 5619.79% -0.260
Indosat (ISAT) 9.70% 1566.92% 0.089
XL Axiata (EXCL) 33.42% 854.89% -0.155
Table 6. Re-Investment with-without flexibility and value of call option for investment flexibility with Competition Risk
Company S K
s
2(Variance)
Telkomsel (TSEL) 52.00% 15.65% 0.329
Bakrie Telecom (BTEL) 145.21% 0.26% 3.060
Indosat (ISAT) 265.17% 9.70% 1.379
XL Axiata (EXCL) 195.62% 33.42% 0.692
quartal to 4 in 2014, because has the lowest call option value (-0.260) for financial flexibility. Indosat requires re-investment (265.17%) and riskier with quite high standard deviation (80.25%). Telkomsel has the lowest re-investment needs (52.00%) and the highest call option value (0.100).
Above all of the operators, the need for re-invest-ment and risk by Telkomsel is relatively small. It is show that Telkomsel has a stable performance of in conducting investment activities in the middle of the telecommunication operator competition during years 2007-2014. Bakrie Telecom has the highest standard deviation (std=1.749) and needs substantial investment (5619.79%) needed with financial flexibility. This suggests the risk is higher if the company re-investment does not meet the needs of the re-investment target. Similarly, Indo-sat (ISAT) that require a large investment funds (1566.92%) but Indosat had second best call op-tion value (0.089) for financial flexibility.
Table 6 shows the company’s financial flexibility in the years 2007-2014. Overall, the highest call option value financial flexibility is Telkomsel (TSEL) and the lowest re-investment needed (159.40%) with financial flexibility or can be financing by company internal financing. Bakrie Telecom (BTEL) has the lowest financial flexibility, it’s means that the company financing can not come from its operating revenue or internal fund but from external fund such as debt. Then, Bakrie Telecom (BTEL) and XL Axiata (EXCL) demonstrate negative call option value of financial flexibility based on operating revenue. Its shows that the financial flexibility derived from external funding, not internal.The best use of internal funds and external balance (very good) is indicated by Telkomsel.
In Table 7, the value of K indicates the amount of ‘‘strike price’’ based on operating revenue for each carrier or telecommunication company. Telkomselas the smallest K value of the variance (
s
2) = 0.329. This variance describes the variationof the value of the investment needs and financial flexibility with the risk of competition. Bakrie Telecom has the highest risk with variance (3.060). This can be a measure of risk to be faced with the need for investment in the future.
CONCLUSION
Indonesia Telecommunication regulation affect telecommunication operator operating revenue margin. With different financial flexibility within telecommunication firm, the tension of competition is increased. Re-investment needed to be survive. Some company has lower financial flexibility based on capex, operating revenue and re-investment needs will have some difficulty to compete. The regulator is expected to managing an efficient level of competition that the Telcooperator can still makes investment in new technology without predatory pricing but also not harm consumers by higher price.
R E F E R E N C E S
Alleman, J, 2002, New View of Telecommunications Economics Telecommunications Policy 26 (2002) 87–92.
Boyer, M., M. Benitah and S. Weihao, 2008. Real options, network development and network access. WIK NETCONOMICA 2008 Conference on Current Issues in Network Economics: Regulatory Risk, Cost of Capital and Investment Incentives. September, Königswinter, Germany.
Byoun, S., 2008. How and when do firms adjust their capital structures toward targets?, Journal of Finance, 63, p. 3069 - 3096. Benaroch, M., Option-Based Management of Technology Investment Risk1, IEEE Transactions on Engineering Management,
Vol. 48, No. 4, pp. 428-444, November 2001.
Damodaran, Aswath, 2001, “Corporate Finance,” John Wiley & Sons, Inc.: Hoboken.
Damodaran, Aswath, 2001,The promise and peril of real options, NYU Working Paper No. S-DRP-05-02, 2005.
Gentzoglanis, 2004. Managing Investment Risk in the Telecommunications Industry: Theory and Practice, International Telecommunication Union, Telecommunication Development Bureau, Market, Economics & Finance Unit.
Oteroa, J., Waddams, C, 2001. Incumbent and entrant response to regulated competition: signaling with accounting costs and market prices, Journal of Economics and Business 53 (2001) 209–223.
Leng, Phirak,2015, A Cost Benefit assessment of the regulatory policy in Cambodia mobile telecommunication market, Asian Development Policy Review, (2015), (4), (1): 1-25
Graham, J. R., Harvey, C. R., 2001. The theory and practice of corporate finance: evidence from the field, Journal of Financial Economics, 61, p.187–243.
Gerpott,Meinert, 2015,The impact of mobile Internet usage on mobile voice calling behavior: A two-level analysis of residential mobile communications customers in Germany, Telecommunications Policy,Volume 40, Issue 1, February 2015, Pages 62–76
Thamarapani, D., (2015). The Impact of Telecommunication Growth on the Service Sector: a co integration analysis. Journal of Management. 9(1), pp.58–69. DOI:
Appendix
Exibit 1. Real Option Model