Intelligent Anomaly Detection Techniques for Denial of
Service Attacks
Vehbi C. Gungor
1,
Zafer Aydın
1, Ramazan Karademir
2*1 Abdullah Gul University Dep. of Computer Engineering Kayseri, Turkey 2DIGITURK Yıldız Cad. No. 34 Polat Tower Beşiktaş, İstanbul,Turkey
* Corresponding author. Tel.: +90 0532 555 8988; email: ramazan.karademir@digiturk.com.tr Manuscript submitted January 29, 2018; accepted February 25, 2018.
doi: 10.17706/ijcce.2018.7.2.20-31
Abstract: To construct and evaluate intrusion detection, system researchers are limited to only a few available public datasets unless they prepare their own. Although the most prevalent KDDCUP’99 dataset provides a comparative analysis among researchers, the community needs a new dataset which reflects new
attack types in current high-speed networks. The aim of this study is to prepare a new alternative dataset
for the community for detection of denial of service attacks and to conduct performance analysis of different data mining methods on this dataset. To develop the dataset, distributed DoS attacks have been
generated that target a commercial website in a real network environment, which has a million of users from all over the world. In addition to this, a richer attack dataset has been produced in a laboratory
environment with the help of Labris Networks. After capturing data, significant network features have been identified and processed and labeled with related attack types. Furthermore, the performances of different
data mining techniques have been evaluated, including binary classification, multi-class classification,
outlier detection, feature selection methods and hybrid approaches with our dataset by using the following
algorithms: K-Means clustering, Naïve Bayes, Decision Tree, Multilayer Perceptron, LibSVM, Random Forest
and Random Tree.
Key words: Denial of service attacks, anomaly detection, data mining, feature selection.
1. Introduction
Today Internet is an indispensable part of modern society. However, billions of devices connected to the
internet can also be used by adversaries to attack a target on the internet. One popular category of attacks that can be used by malicious users is denial of service (DoS) attacks. A denial of service attack can be defined as an attempt that aims to bring down the availability of the services so that legitimate users of
these services are blocked or temporarily disrupted. In a typical scenario, DoS attacks are done by flooding
the target network with high volume of traffic thereby depleting the critical resources such as bandwidth, memory, and CPU time of the server. If these attacks are generated by many different resources on the
Internet then, they are called distributed denial of service (DDoS) attacks.
In computer security realm, intrusion detection systems (IDS) are considered an important defense
system for network intrusions including DDoS attacks. These systems monitor network traffic and detect intrusions or anomalies which may belong to a malicious user. IDS’s are from an analysis perspective
generally divided into two categories: misuse detection systems and anomaly detection systems. Misuse
order to identify attack traffic. Therefore, misuse detection systems cannot detect zero-day attacks. On the
other hand, anomaly detection systems construct normal usage profiles of network traffic data and then try
to discover deviations from the normal patterns. As a result, anomaly detection systems can detect zero-day attacks, but also may produce too many false alarms as an adverse effect.
The success of any intrusion detection system that is based on data mining techniques largely depends on the dataset used in system training [1]. Currently researchers are limited to only a few public available datasets. Preparing a dataset for intrusion detection system evaluation requires data preprocessing steps, which convert network traffic data into a collection of records. This constitutes 50 percent of whole effort in
knowledge discovery process [2]. For that reason, preparing a new alternative dataset will facilitate future works in the field for the research community. In the literature, there are a lot of research efforts [3]-[5]
focusing on network security against cyber-attacks utilizing the KDDCUP’99 benchmarking dataset [6]-[19].
Although the most prevalent KDDCUP’99 dataset provides a comparative analysis among researchers, the community needs a new dataset which reflects new attack types in current high-speed networks [20].
In this study, we have prepared a new dataset for the research community by collecting real network traffic data from Ligtv.com.tr website. Ligtv.com.tr website is a football news related platform mainly about Turkish Super League, which has millions of customers all around the world. After collecting normal data from Ligtv.com.tr site, various DDoS attacks were generated for this website and this attack traffic is captured for further processing. Additionally, we have setup a laboratory environment to produce pure and
richer DDoS attack data with the help of Labris Networks, an R&D company which specializes in network security solutions. After raw data collection, significant network features were identified and processed into
connection records. Finally, several different data mining approaches, including binary classification, multi-class classification, clustering based outlier detection, feature selection methods, data normalization
and hybrid approaches were experimented on our dataset in order to detect attacks with maximum detection rate and minimum false alarm rate. Namely, the following algorithms from Weka data mining tool
[21] were applied to our datasets: Naïve Bayes, Decision Tree, Multilayer Perceptron, LibSVM, Random
Forest and Random Tree. As a hybrid solution K-Means clustering and Naïve Bayes classification methods were implemented. The performances of these experiments were measured in terms of training time,
accuracy, detection rate, and false alarm rate.
The rest of this paper is organized as follows. Section 2 describes the dataset used for performance evaluations. Section 3presents the performance metrics. In Section 4, performance evaluation results are
explained. Finally, the paper is concluded in Section 5.
2. Data Collection and Preprocessing
Wehave collected normal traffic data that areattack free from Ligtv.com.tr website. By saying attack free, we believe that there were no DDoS attacks while collecting normal traffic data because this site was under
protection for DDoS. For normal data collection,we set up a data collection machine on the network and used TCPDump program to capture network traffic. In two days, 13 million packets of 13 GB and 17 million packets of 16 GB of network data captured and named NormalSet1 and NormalSet2 respectively. The
captured files are further processed into connection records with 41 features. The extracted features are grouped into three categories namely basic, time based, and connection based features. Basic features
contain features that can be easily extracted from packet headers by counting some properties of packets for the connection. There are 23 basic features. Time based features are calculated by using a 2 second time window parameter that is current connection and connections that are started within 2 seconds are
considered. There are 9 time based features. Connection based features are calculated by using a 200
based features.
To generate various DDoS attacks hping utility is used. With this tool, SYN flood, IP fragmentation, FIN
flood, RST flood, and SYN-RST flood attacks are generated against ligtv.com.tr site by using random IP
source generation option in order to generate distributed attacks. While performing attacks the DDoS
protection is turned off temporarily. Under attack 3 GB of network traffic data was captured. This includes both DDoS attacks and normal data. This set of data also processed into connection records with 41
features and named AttackSet1.
In addition to Ligtv.com.tr site attack data, a pure and richer attack data sethas been provided in terms of attack diversity by Labris Networks. They set up a lab environment to produce various DDoS attacks and
generated the following DDoS attacks: syn_ack_ddos, icmp_ddos, rst_ack_ddos, rst_ddos, fin_ddos, ack_ddos, http_get, and syn_ddos. 16 GB of attack data that includes only attacks were processed into connection
records with 41 features AttackSet2. Table 1 shows the record counts of each dataset after data
preprocessing.
Table 1. Data Preprocessing Results for Datasets Dataset Name Data Source Record Count Distinct Record Count NormalSet1 Ligtv.com.tr 131,210 129,453 NormalSet2 Ligtv.com.tr 222,135 219,241
AttackSet1 Ligtv.com.tr 2,006,094 179,319
AttackSet2 Labris Network 7,484,564 13,029
Table 1 also shows that distinct record count for normal datasets are very close to total record count whereas for attack datasets it is much less, which means most records are identical for attack datasets. This
indicates that a high number of identical records, thus much lower number of distinct records compared to
total number of records point to an anomaly. Another sign of anomaly can be seen by analyzingsource IP
country distributions of datasets. It can be seen from the Fig.1 that, NormalSet1 and NormalSet2 shows nearly the same statistical values whereas attack traffic from AttackSet1 shows very different distributions.
Fig. 1. Source IP country distributions.
For normal datasets, there are 96 different countries, but for attack dataset there are 226 different
countries. Turkey and Germany, where Turkish population is high, together are responsible for about 80
percent of normal traffic, but under attack traffic they are responsible only for about 3 percent of the traffic.
0 10 20 30 40 50 60 70 80
I
P
D
i
s
t
r
ib
u
ti
o
n %
Under attack, we see an enormous traffic increase from different countries which is a sign of an anomaly also.
After data preprocessing, labeling and attack type specification was done for all records by writing several queries and searching attack characteristics for datasets. An attribute for specifying the attack type is also added to records to be able to measure success of multi class classification approaches. Table 2 and 3 shows the attack types for attack datasets.
Table 2. Distributions of AttackSet1 Records
AttackSet1 Labels Record Count
Normal 31,912
FIN_attack 12,146
FragmantedSet 32,836
RST_attack 1,184
SYN_attack 66,515
SYN_RST 34,726
Total Records 179,319
Table 3. Distributions of AttackSet2 Records
AttackSet2 Labels Record Count
syn_ack_ddos 1,208
icmp_ddos 38
rst_ack_ddos 2,848
rst_ddos 1,809
fin_ddos 21
ack_ddos 844
http_get 3,073
syn_ddos 3,188
Total Records 13,029
As it was stated before, only AttackSet1 dataset have normal and attack traffic together. AttackSet2 dataset records that contain only attack traffic were labeled as attack records. NormalSet1 and NormalSet2 dataset records were labeled as normal.
Lastly, two new datasets were created in order to use in anomaly detection techniques evaluation as shown in Table 4 and 5.
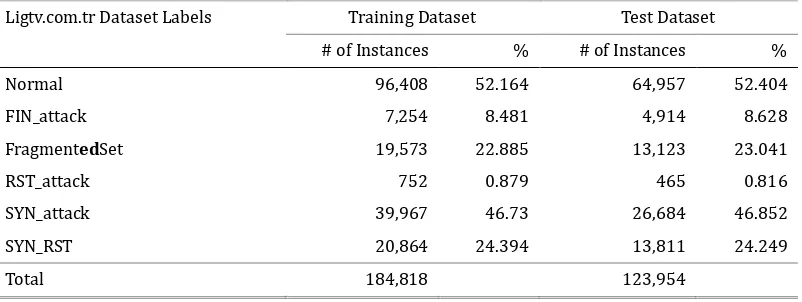
Table 4. Distributions of Ligtv.com.tr Dataset Records
Ligtv.com.tr Dataset Labels Training Dataset Test Dataset
# of Instances % # of Instances % Normal 96,408 52.164 64,957 52.404 FIN_attack 7,254 8.481 4,914 8.628
FragmentedSet 19,573 22.885 13,123 23.041
RST_attack 752 0.879 465 0.816
SYN_attack 39,967 46.73 26,684 46.852 SYN_RST 20,864 24.394 13,811 24.249
Table 5. Distributions of Labris NetworkDataset Records
Labris Network Dataset Labels Training Dataset Test Dataset
# of Instances % # of Instances %
Normal 77,693 90.839 51,760 90.880
syn_ack_ddos 706 0.825 488 0.857
icmp_ddos 20 0.023 18 0.032
rst_ack_ddos 1,731 2.024 1,126 1.977
rst_ddos 1,135 1.327 755 1.326
fin_ddos 11 0.013 6 0.011
ack_ddos 498 0.582 327 0.574
http_get 1,857 2.171 1,192 2.093
syn_ddos 1,877 2.195 1,282 2.251
Total 85,528 56,954
NormalSet1 and AttackSet1 dataset were merged to represent Ligtv.com.tr environment and, NormalSet1 and AttackSet2 dataset were merged to represent Labris Network environment. Each of these two new dataset then randomly divided into two files holding 60 percent for training dataset and 40 percent for test dataset.
3.
Performance Metrics
High accuracy, high detection rate and low false alarm rates are key performance indicators of any intrusion detection systems. In addition to these metrics we also measured clustering qualities and other classification measures, such as F1 measure and runtime performances of the algorithms.
For outlier detection approach k-means clustering algorithms were evaluated with different value of
parameter k, which is the number of clusters, ranging from 2 up to 100 and looked for minimizing the sum
of squared error (SSE) marginally, since after some point, increasing the 𝑘 will not provide a meaningful
decrease in SSE. The SSE can be calculated by the following formula:
𝑆𝑆𝑆= � � 𝑑𝑑𝑑𝑑2(𝑚 𝑖 𝑥∈𝐶𝑖
,𝑥)
𝐾
𝑖=1
In SSE formula, 𝑥 is a data point in cluster 𝐶𝑖 and 𝑚𝑖 is the cluster centroid. Although clustering
quality is not the primary concern for the attack detection problem, we think that a good quality clustering yields better attack detection results. To evaluate classification algorithms accuracy, detection rate, false alarm rate and F1 measures are calculated. These measures depend on the following key measures as described in Table 6 below. In addition, the formulas for the performance metrics for classifiers that are based on key measures can be seen on Table 7.
Table 6. Key Measures for Performance Evaluation
Key Measures Description
Table 7. Key Measures for Performance Evaluation
Measure Formula
Accuracy (𝑇𝑇+𝑇𝑇) / (𝑇𝑇 +𝑇𝑇+𝐹𝑇+𝐹𝑇)
Detection Rate 𝑇𝑇 / (𝑇𝑇+𝐹𝑇)
False Alarm Rate 𝐹𝑇 / (𝐹𝑇+𝑇𝑇)
True Positive Rate 𝑇𝑇 / (𝑇𝑇+𝐹𝑇)
F1 Measure 2∗ 𝑇𝑇 / (2∗ 𝑇𝑇+𝐹𝑇+𝐹𝑇)
4.
Performance Evaluations
Outlier Detection Evaluation Results
4.1.
The K-Means outlier detection model trained with NormalSet1 dataset and experimented eleven times
with different value of kparameter (number of clusters) ranging from 2 to 100 in order to see the effects of
different clustering levels to attack detection. As it can be seen from the Fig. 2, while number of clusters K
increases, the sum of squared error (SSE) decreases.
Fig. 2. The SSE graph for NormalSet1 dataset.
In the testing phase, K-Means outlier detection algorithm tested with AttackSet1 dataset to detect attacks and the following performance results were obtained as shown on Table 8
Table 8. BinaryOutlier Detection Results for AttackSet1
K SSE Accuracy Rate Detect Rate False Alarm Rate F1 Measure 2 83,365.57 90.84 90.609 47.456 94.679 10 51,162.14 90.77 90.572 47.64 94.638
20 39,231.96 90.768 90.571 47.65 94.637
30 33,577.7 90.759 90.53 47.9 94.634 40 33,084.56 90.775 90.571 47.653 94.641
50 31,155.8 90.769 90.524 47.941 94.641
60 30,483.24 90.823 90.603 47.487 94.668 70 29,755.86 90.769 90.524 47.941 94.641 80 29,428.46 90.772 90.524 47.941 94.642
90 28,585.59 90.772 90.524 47.941 94.642
100 28,508.22 90.769 90.524 47.941 94.641
0.0000 20000.0000 40000.0000 60000.0000 80000.0000 100000.0000
0 20 40 60 80 100 120
Surprisingly the attack detection performanceis not changing in any direction as SSE decreases. We were expecting an increase in detection rate as K increases and a decrease after some value of K.
Naïve Bayes Classification Evaluations Results
4.2.
In Naïve Bayes classification evaluation, the model is trained and tested with using both Ligtv.com.tr dataset and Labris Network dataset separately. Attack detection is performed with two different approaches.
First binary classification is used then multi-class classification performed with each dataset. Binary
classification and multi-class classification performance results can be seen on the following Table 9 and
Table 10 respectively.
Table 9. Binary Classification Results of Naïve Bayes
Data # of Test Instances Accuracy Detect Rate False Alarm Rate F1 Measure Labris Network 56,954 99.93 99.502 0.05 99.655 Ligtv.com.tr 123,954 98.56 97.501 2.337 98.514
Table 10. Multi Class Classification Results of Naïve Bayes Implementation
Data # of Test Instances Accuracy Detect Rate False Alarm Rate F1 Measure Labris Network 56,954 94.36 38.518 5.8 55.437 Ligtv.com.tr 123,954 97.20 94.731 4.839 97.078
Binary classification approaches achieved better detection rate and false alarm rates compared to multi-class classification results for both datasets. This result indicates that we should introduce more discriminative features for different attack types because the system cannot discriminate for example syn_ddos and syn_ack_ddos attack especially found in Labris Network dataset.
Hybrid Method Evaluation Results
4.3.
Additionally, K-means clustering and Naïve Bayes classification methods were used together as a hybrid solution in order to detect attacks. First, the Labris Network training dataset were clustered into two clusters and then each cluster was trained with Naïve Bayes algorithm separately. Similar to training approach, in evaluation step, Labris Network test data first assigned to a cluster. After then, test data is
evaluated with this cluster’s classification model. The following Table 11 shows the results of hybrid
approach multi class classification.
Table 11. Multi Class Classification Evaluation Results of Hybrid Approach
Hybrid Method # of Test Instances Accuracy Detect Rate False Alarm Rate F1 Measure K-Means & Naïve
Bayes 56,954 98.642 97,511 2,331 98,596
The hybrid approach for multi class classification achieved better detection rate and false alarm rate than
Naïve Bayes.
Weka Data Mining Tool Evaluations Results
4.4.
With Weka data mining tool six classification algorithms namely J48, Naïve Bayes, LibSVM, Multilayer Perceptron, Random Forest, and Random Tree were evaluated in terms of attack detection rate, false alarm
rate and training time performances with Labris Network dataset. As Fig. 3 and 4 shows respectively, Random Forest algorithm achieved the best attack detection rate and false alarm rate whereas Naïve Bayes
Fig. 3. Binary classification attack detection rates.
Fig.4.Binary classification false alarm rates.
In two phase attack detection approach, first phase uses binary classification, and if it finds an attack, then second phase classifies the attack type. As Fig.5 shows, only Naïve Bayes algorithm performed better
attack detection results compared to one phase approach. Other algorithms performed nearly the same as in one phase.
Fig. 5. Correct multi-classclassification rates of two phase classification approach.
In terms of training time, Multilayer perceptron and LibSVM took much more time compared to other algorithms. However, after data normalization, LibSVM performed much better as it can be seen in the Fig. 6.
95 96 97 98 99 100
Detection Rate
0 1 2 3
False Alarm Rate
92 94 96 98 100
Correct Classification Rate
One Phase Two Phase
Fig. 6. Training time performances of algorithms.
Feature Selection Evaluations
4.5.
0 200 400 600
Seconds
Training Time
The following combinations of attribute evaluation and search methods used for feature selections from Weka with using multi-class Labris Network training dataset:
• BestFirst and CFS Subset Evaluator • GeneticSearch and CFS Subset Evaluator • Greedy Stepwise and CFS Subset Evaluator • Attribute ranking and Chi-squared
• Attribute ranking and Gain Ratio • Attribute ranking and Info Gain
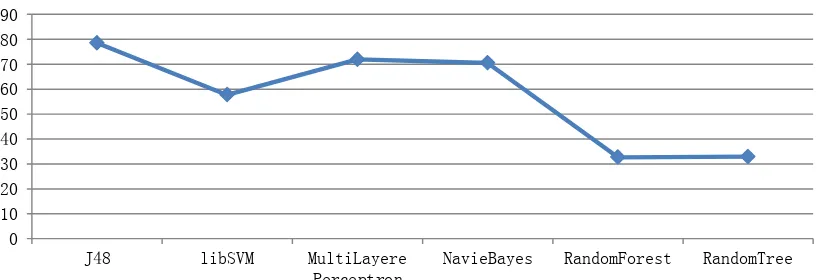
After the feature selection every feature subset evaluated with six classification algorithms in terms of
training time and correct classification rate. As the Fig. 7 shows, training times of algorithms decreased in the range of 32 to 78 percent.
Fig. 7. Training time decrease rate after feature selection.
After feature selection only Naïve Bayes algorithm performed differently for each feature subset. Others performed nearly the same in terms of correct attack classification as shown in Fig.8.
0 10 20 30 40 50 60 70 80 90
J48 libSVM MultiLayere
Perceptron
NavieBayes RandomForest RandomTree
Training Time Decrease Rate
Fig.8. Correct multi-class classification rate after feature selection.
5. Conclusions
In this paper, we have presented two new dataset for DDoS attack detection. First dataset is constructed by generating several DDoS attacks which target a real network based on Ligtv.com.tr website and second
92 93 94 95 96 97 98 99 100
Correct Classification Rate
J48 LibSVM
MultiLayer Perceptron Navie Bayes
one is constructed by mixing Labris Network laboratory attack data with real network data based on Ligtv.com.tr website. Upon request, the complete experimental dataset will be made available. It is expected that this dataset will help the research community for evaluating their intrusion detection models.
In addition to this, the presented dataset were used in evaluating attack detection performances of
different data mining techniques, including binary classification, multi-class classification, outlier detection, feature selection methods and hybrid approaches. As a hybrid solution for detecting attacks K-Means
outlier detection approach and Naïve Bayes classification approach were utilized.
K-Means clustering-based outlier detection approach achieved 90 percent attack detection rate which seems comparable with other results from literature, whereas false alarm rates as high as 47 percent that is not good. Naïve Bayes based classification approach achieved 99 percent attack detection rate and 0.05 false
alarm rate in binary classification which is very good. For multi-class classification, the algorithms
performed higher false alarm rates due to close similarities between attack types. Hybrid solution that uses
K-means clustering and Naïve Bayes classification achieved a better result than using them separately.
The performances of the Naïve Bayes, Decision Tree, Multilayer Perceptron, LibSVM, Random Forest and Random Tree classifications were evaluated with Weka data mining tool. Random Forest algorithm achieved
the best attack detection rate and false alarm rate whereas Naïve Bayes algorithm performed worst among
others. Furthermore, the feature selection results showed that with fewer features and less training time, at
least the same detection rates and false alarm rates are achievable.
Acknowledgment
The work of Vehbi .C.Gungor was supported by the Turkish National Academy of Sciences Distinguished Young Scientist Award Program (TUBA-GEBIP) under Grand no. V.G./TBA-GEBP/2013-14.
References
[1] Davis, J. J.,&Clark, A. J. (2011).Data preprocessing for anomaly based network intrusion detection: A
review. Computers & Security, 30(6–7), 353-375.
[2] Lee, W., Stolfo, S. J., & Mok., K.W. (1999). Mining in a data-flow environment: Experience in network
intrusion detection. Proceedings of the Fifth ACM SIGKDD International Conference on Knowledge
Discovery and Data Mining:(pp. 114-124).
[3] Mirkovic, J., & Reiher, P. (2004). A taxonomy of DDoS attack and DDoS defense mechanisms.SIGCOMM
Comput. Commun., 34(2), 39-53.
[4] Onut, I. V., & Ghorbani, A. A.(2007). A feature classification scheme for network intrusion detection. International Journal of Network Security, 5(1), 1-15.
[5] Sperotto, A., Schaffrath, G., Sadre, R., Morariu, C., Pras, A., & Stiller, B. (2010). An overview of IP flow-based intrusion detection.Communications Surveys & Tutorials, IEEE, 12(3), 343-356.
[6] Portnoy, L., Eskin, E., &Stolfo, S. (2001).Intrusion detection with unlabeled data using clustering. In
Proceedings of ACM CSS Workshop on Data Mining Applied to Security (DMSA-2001):(pp. 5-8).
[7] Kayacik, H. G., Zincir-Heywood, A. N., & Heywood, M. I. (2005). Selecting features for intrusion detection: A feature relevance analysis on KDD 99 intrusion detection datasets. Proceedings of the Third Annual Conference on Privacy, Security and Trust.
[8] Zhong, S., Khoshgoftaar, T. M., &Seliya,N.(2007). Clustering based network intrusion detection.Int. J.
Rel. Qual. Saf. Eng., 14,169.
[9] Bellaiche, M., & Gregoire, J. C. (2009). SYN flooding attack detection based on entropy computing. In Proceedings of IEEE Conference on Global Telecommunications, GLOBECOM 2009: (pp. 1-6).
clustering and Naïve Bayes classification. Proceedings of International Conference on Information
Technology in Asia (CITA 11): Vol. 1, No. 6.(pp. 12-13).
[11]Liu, Z. (2011). A method of SVM with normalization in intrusion detection. Procedia Environmental
Sciences, 11,256-262.
[12] Ashok, R., Lakshmi, A. J., Rani, G. D. V., & Kumar, M. N. (2011). Optimized feature selection with K-Means clustered triangle SVM for Intrusion Detection. Proceedings of International Conference on Advanced Computing (ICoAC): (pp. 23-27).
[13]Horng, S. J., Su, M. Y., Chen, Y. H., Kao, T. W., Chen, R. J., Lai, J. L., & Perkasa, C. D.(2011). A novel intrusion detection system based on hierarchical clustering and support vector machines. Expert Systems with
Applications, 38(1), 306-313.
[14]Om, H., & Kundu, A. (2012). A hybrid system for reducing the false alarm rate of anomaly intrusion detection system. Proceedings of International Conference on Recent Advances in Information Technology
(RAIT)(pp. 131-136).
[15]Altwaijry, H. (2013). Bayesian based intrusion detection system. IAENG Transactions on Engineering
Technologies, 29-44.
[16] Mukherjee, S., & Sharma, N. (2012). Intrusion detection using naive Bayes classifier with feature
reduction.Procedia Technology, 4, 119-128.
[17] Chen, Z. G., & Kim, S. R. (2013). Combining principal component analysis, decision tree and naïve Bayesian algorithm for adaptive intrusion detection.Proceedings of the 2013 Research in Adaptive and
Convergent Systems(pp. 312-316).
[18]Kim, G., Lee, S., & Kim, S. (2014). A novel hybrid intrusion detection method integrating anomaly
detection with misuse detection.Expert Systems with Applications, 41(4),1690-1700.
[19] Kuang, F., Xu, W., & Zhang, S. (2014). A novel hybrid KPCA and SVM with GA model for intrusion
detection.Applied Soft Computing, 18, 178-184.
[20] Tavallaee, M.,Bagheri, E.,Wei L., &Ghorbani, A. A. (2009). A detailed analysis of the KDD CUP 99 data
set. IEEE International Conference on Computational Intelligence for Security & Defense Applications,
CISDA 2009: Vol.1, No.6(pp.8-10).
[21]Hall, M., Frank, E., Holmes, G., Pfahringer, B., Reutemann, P., & Witten, I.H. (2009). The WEKA data
mining software: An update.Acm Sigkdd Explorations Newslette, 11(1), 10-18.
Vehbi Cagri Gungor received his B.S. and M.S. degrees in electrical and electronics engineering from Middle East Technical University, Ankara, Turkey, in 2001 and 2003, respectively. He received his Ph.D. degree in electrical and computer engineering from the Broadband and Wireless Networking Laboratory, Georgia Institute of Technology, Atlanta,
GA, USA, in 2007. Currently, he is an associate professor and chair of Computer Engineering Department, Abdullah Gul University (AGU), Kayseri, Turkey. His current research interests are in smart grid communications, machine-to-machine communications,
next-generation wireless networks, wireless ad hoc and sensor networks, cognitive radio networks. Dr.
Gungor has authored several papers in refereed journals and international conference proceedings, and has
Grant Awards in 2010 and 2012, and the San-Tez Project Awards supported by Alcatel-Lucent, and the
Turkish Ministry of Science, Industry and Technology in 2010.
Zafer Aydınreceived his bachelor of science (B.Sc.) and master of science (M.Sc.) degrees
with high honor from the Electrical and Electronics Engineering Department of Bilkent University in 1999 and 2001, respectively. Starting from 2002, he worked as a graduate research assistant in School of Electrical and Computer Engineering at Georgia Institute of
Technology, Atlanta GA USA and received the PhD degree under the supervision of Prof. Yucel Altunbasak in 2008. As a result of maintaining an interest in bioinformatics
research, he worked as a post-doctoral fellow for three years in Noble Research Lab, which is part of the Genome Sciences Department at University of Washington, Seattle, WA USA. Currently, he is an Assistant Professor in Computer Engineering Department of Abdullah Gul University, Kayseri, Turkey. His current research interests are in bioinformatics, machine learning, data mining, artificial intelligence, and Internet security.
Ramazan Karademirreceived the master of science degree in computer engineering at
Bahçeşehir University, İstanbul, Turkey under the supervision of Dr. Vehbi Cagri Gungor.