VARIATIONS IN PEDALLING TECHNIQUE
OF
COMPETITIVE CYCLISTS:
THE EFFECT ON
BIOLOGICAL EFFICIENCY
ALFRED ZOMMERS
Dip.Tch.Tchg. (Hawthorn Institute of Ed.) 1983 Grad.Dip.Sports Sci. (Victoria College) 1988
B.Ed. (Hawthorn Institute of Ed.) 1990
Dissertation submitted for the degree of Doctor of Philosophy
Department of Human Movement, Recreation and Performance
y^s-sx3(.
FTS THESIS 796.6 ZOM
30001006983201 Zommers, Alfred
DECLARATION
I hereby certify that I am responsible for the work submitted in this
thesis, that the original work is my own except as specified in the
acknowledgements on page iii, and that neither the thesis or the original
work contained therein has been submitted to this or any other institution
for a higher degree.
Alfred Zommers
Victoria University of
Technology
October 2000
ACKNOWLEDGEMENTS
•
•
Mark Gibbs for the many hours assisting in the development and construction of the ergometry system. His knowledge of
microcomputer electronics together with his interest in software programming led to the development of an accurate and reliable bicycle ergometry system.
Steve Selig for the many hours assisting in the lab with data collection, refinement of the ideas and the many hours editing the thesis.
John Carlson for assistance in writing a paper which was presented at the Australian Conference of Science and Medicine in Sport, Hobart, Australia (1995).
Justin Rivette, Kade Paterson, and Shane Lawson, undergraduate students who assisted in data collection.
Neil Diamond for advice in the statistical analysis of the calibration data.
Ian Fairweather and his technical staff for the work involved in modifying the calibration system that had been donated by REPCO (Australia) and in ensuring that I had serviceable equipment at all times.
Bob Sloane for the construction of the frame to support the cyclists' bicycles.
Tim Wrigley for his advice and assistance with the video data collection and digitising.
Russell Best for his assistance at the start of the project and his encouragement during the early development phase.
Robert Bosch (Australasia) for the donation of an altemator.
Bob Tait of Bosch (Australasia) for technical advice.
Minas Garas of Bosch (Australasia) for technical advice.
• REPCO (Australia) for the donation of the calibration-system and racing bicycle.
• The 45 volunteers who gave their valuable time for this research project.
• My wife Margaret who gave me encouragement during the many tough times.
• Finally I dedicate this thesis to my Father, whom unfortunately I have never met, and my Mother, who gave me the inspiration to keep working and never give up, both of whom will unfortunately never get to see the results of nine years of my endeavours.
ABSTRACT
The efficiency of pedalling technique has been a source of controversy
amongst exercise scientists, coaches and cyclists for over 100 years.
Biomechanically, it has been shown that orienting the pedal tangentially
to the direction of motion of the crank provides the greatest force
effectiveness. This is commonly referred to as "ankling". Ankling may
enable greater mechanical efficiency but this, in itself, does not guarantee
improved performance, because the greater mechanical efficiency may be
at a cost of reduced biological efficiency. The effect of ankling on
biological efficiency has not previously been investigated and is the
primary focus of this thesis. Forty-one competitive cyclists were tested on
their own bicycles using an electronically-braked ergometry system
designed and developed for this thesis. The system was calibrated, and
when compared to existing air- and mechanically-braked ergometers, was
shown to be more accurate and reliable. The study prospectively
randomised athletes to three months of ankling practice or to continue
with their normal technique. Biological efficiency, for both ankling and
normal technique, was assessed in all volunteers at the commencement of
the study and at monthly intervals during the three-month training
intervention. These tests were conducted at workloads approximating
threshold). Biological efficiency was calculated as power output -^ power
input the latter estimated from the energy equivalent to O"^ consumption.
During the efficiency tests, kinematic data of one lower limb was
recorded. Analysis of the data showed that all of the athletes were able to
increase the range of motion of the ankle joint and pedal using the
ankling technique. Biological net efficiency for ankling was
22.2%±2.3%. This is in accord with existing data for normal technique.
Instantaneous cadence varied sinusoidally within one crank revolution.
This finding was only possible because the ergometry equipment could
measure mechanical power output and cadence every degree of crank
rotation. The crank angle where maximum power was measured differed
by just one degree between techniques but this trivial difference was
statistically significant. In conclusion, a) ankling is anatomically possible,
and b) biological efficiency for ankling was not significantly different to
normal pedalling after accounting for differences in the set-up of
individual bicycles.
PUBLICATIONS
AND
CONFERENCE PRESENTATIONS
The following publications are related to this thesis:
Zommers, A., Gibbs, M., & Setig, S. (1996). A Computerised
Electrically-Braked Bicycle Ergometry System using the Cyclists'
Bicycles. Medicine and Science in Sports and Exercise Supplement to Vol
2<§:S181.
Zommers, A., Gibbs, M., & Setig, S. (1997). Pedatiing Technique of
Competitive Cyclists: An attempt to resolve a 100 year old controversy.
Medicine and Science in Sports and Exercise Supplement to Vol 2P:S284.
The following conference presentations are related to this thesis:
Zommers, A., Best, R., Selig, S., & Gibbs, M. (1993). Kinematic and
kinetic analysis of the pedalling action of competitive cyclists. Victoria
University Faculty Conference, Victoria University, Australia.
Zommers, A., Gibbs, M., Best, R., & Setig, S. (1994). Computerised
measurement of the power output and cadence of cyclists at each degree
of crank revolution using the cyclist's own bicycle. Sports Science
Technical Workshop, Adelaide, Australia.
Zommers, A., Gibbs, M., Best, R., & Selig, S. (1994). Computerised
measurement of the power output and cadence of competitive cyctists. 5'^
Australasian Human Development Conference, Melbourne, Australia.
Zommers, A., Gibbs, M., Best, R., & Setig, S. (1994). Measurement of
the power output and cadence of cyclists at each degree of crank
revolution using the cyclist's own bicycle. International Conference of
Science and Medicine in Sport, Brisbane, Australia.
Zommers, A., & Gibbs, M. (1994). Measurement of the power output and
cadence of cyclists at each degree of crank revolution using the cyclist's
own bicycles. 6''^ Annual Student Conference on Student Research,
Ballarat, Australia.
Zommers, A., Gibbs, M., Best, R., & Setig, S. (1994). Computerised
bicycle ergometry using the cyclist's own bicycle. Victoria University
Faculty Conference, Victoria University, Australia.
Zommers, A., Gibbs, M., Setig, S., & Best, R. (1995). Design and
calibration of bicycle ergometers used in the physiological and
biomechanical testing of athletes. XVISB Congress, Jyvaskyla, Finland.
Naughton, G. A., Carlson, J. S., Snow, R. J., Zommers, A., Stear, K. J., &
Stathis, C. (1995). Indices of exercise intensity in male and female
adolescents during prolonged exercise. Paediatric Work Physiology
Symposium XVIII, Odense, Denmark.
Carlson, J. S., Naughton, G. A., Snow, R. J., Stathis, C , Stear, K., &
Zommers, A. (1995). Metabolic responses to a simulated duathlon in
a&olQSCQnts. Paediatric Work Physiology Symposium XVlll, Odense,
Denmark.
Zommers, A., Gibbs, M., & Selig, S. (1995). Calibration and comparison
of bicycle ergometers used in physiological testing. Australian
Conference of Science and Medicine in Sport, Hobart, Australia.
Zommers, A., Naughton, G. A., Carison, J. S., & Gibbs, M. (1995).
Physiological efficiency of adolescents measured during the cycling leg
of a simulated duathlon. Australian Conference of Science and Medicine
in Sport, Hobart, Australia.
Carison, J. S., Naughton, G. A., Zommers, A., Snow, R. J., Stathis, C , &
Stear, K. (1995). Physiological and metabolic responses of adolescent
male and females (sic) during a simulated duathlon event. Australian
Conference of Science and Medicine in Sport, Hobart, Australia.
Zommers, A., Gibbs, M., & Selig, S. (1996) A computerised
electrically-braked bicycle ergometry system using the cyclists' bicycles. Medicine
and Science in Sports and Exercise Supplement to Vol 25:S181.
Zommers, A., Gibbs, M., & Setig, S. (1997) Pedalling Technique of
Competitive Cyclists: An attempt to resolve a 100 year old controversy.
Medicine and Science in Sports and Exercise Supplement to Vol 2P:S284.
TABLE OF CONTENTS
Title i
Declaration ij
Acknowledgements iii
Abstract v
Publications and Conference Presentations vii
Table Of Contents xi
List Of Tables xix
List Of Figures xxiii
List Of Appendices xxviii
Glossary Of Terms xxxiv
1. INTRODUCTION 1
1.1 Purpose of the Study 2
1.2 Hypothesis 5 1.2.1 Central Hypotheses 5
1.2.2 Supporting Hypotheses 6 1.3 Organisation of the Thesis 7
2. LITERATURE REVIEW 9
2.1 Pedalling Technique 9 2.1.1 Mechanical Efficiency 12
2.1.1.1 Mechanical Force Application 15 2.1.2 Elliptical Versus Round Chainrings 30
2.2 Biological Efficiency 33
3. METHODS 39
3.1 Rationale 39 3.2 Ergometer Design and Development 40
3.2.1 Evolution 40 3.2.1.1 Hardware 40
3.2.1.2 Software 59 3.2.2 Final Prototype 62 3.2.3 Development of Data Management Software 63
3.2.4 Ergometer Validation 64 3.3 Ergometer Calibration 65
3.3.1 Calibration-Device 66 3.3.2 Calibration of the Prototype (Electronically-Braked
Ergometer) 67
3.3.3 Calibration of Mechanically-Braked Ergometer 69
3.3.4 Calibration of Air-Braked Ergometers 70
3.4 Participants for the main study 70
3.5 Experimental Design 72
3.6V02max 75 3.7 Venous catheterisation 79
3.8 Anaerobic threshold testing 80 3.8.1 Lactate Threshold (Lactate turnpoint as defined by
Davis etal., 1983) 80 3.8.2 Ventilatory Threshold (second breakpoint as defined
by Skinner and McLellan, 1980; and McLellan, 1987) 81
3.9 Pedalling Efficiency testing 82 3.9.1 Ergometer Set-up and Calibration 83
3.9.2 Video Set-up 86 3.9.3 VO2 Measurement ..87
3.9.4 Power output and Cadence Data Analyses 88
3.10 Biochemical analyses 88 3.10.1 Development of the Lactate Analysis Procedure...89
3.10.2 Lactate Concentration 91
3.11 Data Analysis 92 3.11.1 Video Analysis and Macro Development for
Spreadsheets 92 3.11.2 Biological Efficiency Calculations 95
3.12 Statistical Method 96
4. DEVELOPMENT AND CALIBRATION OF THE
ELECTRONICALLY-BRAKED BICYCLE ERGOMETRY
SYSTEM 97
4.1 Development 97 4.1.1 Alternator Modifications 97
4.1.2 Regression of Mechanical Power Versus Electrical
Power 98 4.1.3 Alternator Efficiency 101
4.1.4 Load Cell and Tachometer (tacho) Pulse Count
Stability Tests 102 4.1.5 Load Cell Calibration 104
4.2 Alternator drive roller errors 105
4.3 Calibration 106 4.3.1 First Calibration 107
4.3.2 Second Calibration I l l 4.3.3 Third and Final Calibration 116
4.4 Concluding Remarks 119
5. CALIBRATION AND COMPARISON OF AIR- AND
MECHANICALLY-BRAKED BICYCLE ERGOMETERS USED
IN THE LABORATORY TESTING OF ATHLETES 120
5.1 Introduction 120 5.2 Methods 121
5.2.1 Calibration of a Mechanically-Braked Ergometer ..121
5.2.2 Calibration of Air-Braked Ergometers 123 5.2.2.1 REPCO Air-Braked Ergometer 124 5.2.2.2 Victorian Institute of Sport Prototype Ergometer
125
5.3 Results and Discussion 125 5.3.1 Accuracy and Reliability of the Mechanically- and
Air-Braked Bicycle Ergometers 125 5.3.2 Comparison of Air- and Mechanically-Braked Bicycle
Ergometers With the Author's Electronically-Braked
Ergometry System 128
6. PILOT STUDY TO TEST THE OPERATION OF THE
ELECTRONICALLY-BRAKED ERGOMETRY SYSTEM 130
6.1 Introduction 130 6.2 Methods 132 6.3 Results and discussion 134
7. EFFICIENCY OF ANKLING AND NORMAL PEDALLING 137
7.1 Introduction 137 7.2 Methods 137
7.2.1 Participants 137 7.2.2 Methods 139
7.3 Results 141 7.3.1 VO2 max 141
7.3.2 Anaerobic Threshold Tests 143
7.3.3 Efficiency Tests 143 7.3.3.1 Mean VO2 for the Efficiency Tests Relative to
V02max 143 7.3.3.2 Power output, During the Efficiency Tests,
Relative to the Anaerobic Threshold 145 7.3.3.3 Respiratory Exchange Ratio (RER) 148
7.3.3.4 Cycling Efficiency 149 7.3.3.5 Quantifying the Ankling Technique and a
Comparison With Normal Pedalling 154 7.3.4 Data additional to the central hypothesis 156
7.3.4.1 Angle of Crank Where Maximum Power
Exhibited 156
7.3.4.2 Range of Motion (ROM) of the Ankle and Knee
Joints 157 7.3.4.3 Cadence Variations 162
7.3.4.4 Knee to Pedal Distance 164 7.3.4.5 Horizontal Distance Between the Bicycle Seat
and the Centre of the Crank 166 7.3.4.6 Seat Height/Inside leg Length Ratio 168
7.4 Discussion 169 7.4.1 Biological Efficiency of Experimental and Control
Groups for the two Pedalling Techniques 169 7.4.2 Strengths of the Experimental Design 174
7.4.2.1 Competitive Athletes and a Large Sample Size 174 7.4.2.2 Exercise Intensity at Which Efficiency was
Measured 175 7.4.2.3 Accurate Measurement of the Mechanical
Power output at Each Degree of Crank
Revolution Using the Cyclists' own Bicycles. 176
7.4.3 Physiological Variables 178
7.4.3.1 VO2 max 178 7.4.3.2 Anaerobic Threshold 180
7.4.4 Data Additional to the Central Hypothesis 182
7.4.4.1 Crank Angle Where Maximum Mechanical
Power output Exhibited 182 7.4.4.2 Cadence Variations During one Crank Cycle184
7.4.4.3 Relationship Between the Horizontal Position of the Knee and the Bicycle Pedal With the Crank
at 90° 185 7.4.4.4 Seat Height- Inside leg Length Ratio 187
7.4.4.5 Efficiency Percentage 188
8 SUMMARY OF RESULTS AND CONCLUSIONS 191
8.1 Overview 191
8.2 Central Hypotheses 192 8.3 Supporting Hypotheses 193 8.4 Accuracy and reliability of the electronically-braked bicycle
ergometry system used in this study and a comparison with existing air- and mechanically-braked bicycle ergometers.
194
8.5 Biological efficiency 194 8.6 Limitations of the study 195
9 RECOMMENDATIONS FOR FURTHER RESEARCH 198
REFERENCES 201
APPENDICES 220
LIST OF TABLES
Table Title Page
Table 2.1 Studies on biological efficiency of cycling 37 Table 3.1 Physical Characteristics of the cyclists 71
Table 3.2 Research Design 73 Table 4.1 Threshold of mechanical power input to the alternator 98
Table 4.2 Alternator efficiency for three load resistances 101
Table 4.3 Tacho pulse count varies with RPM 103 Table 4.4 Alternator drive roller wear - comparison of diameter with
alternator frequency output and variations in alternator
efficiency 106 Table 5.1 Mechanically-braked ergometer calibration data 127
Table 5.2 VIS air-braked ergometer calibration data 127 Table 5.3 Modified REPCO air-braked ergometer calibration data
127 Table 6.1 Maximal effort and cycling performance VO2 data. 134
Table 6.2 Biological efficiency(%). 135 Table 7.1 Methods used in obtaining biological efficiency and
pedalling effectiveness data 139
Table 7.3 VO2 as a percentage of VO2 max during the efficiency
tests 144 Table 7.4 Comparison of mechanical power output during the
efficiency tests and the mechanical power output at 95% of the anaerobic threshold and the anaerobic threshold
145 Table 7.5 Comparison of mechanical power output during the
efficiency tests and the mechanical power output at the anaerobic threshold subdivided according to groups
(experimental and control) 146 Table 7.6 Mechanical power output during the efficiency tests
expressed as a percentage of the power output
measured at the anaerobic threshold 147 Table 7.7 Respiratory exchange ratio (RER) descriptive statistics
148 Table 7.8 Comparison of the RER between the two pedalling
technique groups 148 Table 7.9a The mean angle between the foot and the crank for 0°
to 180° (TDC to BDC) for all cyclists for ankling and
normal pedalling techniques 148 Table 7.9b The mean angle between the foot and the crank for 0°
to 180° (TDC to BDC) for the experimental and control
groups for both pedalling techniques 155 Table 7.10 Angle of crank where maximum power exhibited 156
Table 7.11a Maximum angle of plantarflexion for the two pedalling
techniques 158 Table 7.11b Maximum angle of dorsiflexion for the two pedalling
techniques 158 Table 7.11c Range of Motion (ROM) of the ankle for the two
pedalling techniques 159 Table 7.11 d Range of Motion (ROM) of the knee for the two
pedalling techniques 159 Table 7.12a Maximum angle of plantarflexion for the two groups
and the two pedalling techniques 160 Table 7.12b Maximum angle of dorsiflexion for the two groups and
the two pedalling techniques 160 Table 7.12c ROM of the knee joint for the two groups and the two
pedalling techniques 161 Table 7.12d ROM of the ankle joint for the two groups and the two
pedalling techniques 161 Table 7.13 Horizontal distance between a plumb line dropped from
the front of the knee to the centre of the pedal with the crank at 90° for the experimental and control groups
164 Table 7.14 Horizontal distance measured using a plumb line
between the front of the bicycle seat and the centre of
the crank 166
Table 7.15 Studies of cyclists from various backgrounds together
with the sample size used 174 Table 7.16 Studies on biological efficiency of cycling 189
LIST OF FIGURES
Figure Title Page
Figure 2.1 Crank effort as defined by Sharp (1896). Applied force may not necessarily be vertical, depending on the
angle between pedal and crank. 12 Figure 2.2 Actual forces applied to the pedals 13 Figure 2.3 Ankling versus normal pedalling 14 Figure 2.4 Gravitational force on the upstroke opposes propulsion
on the downstroke. 14 Figure 2.5 Levers. First class lever (gastrocnemius and soleus)
enables plantarflexion while third class lever (tibialis
anterior) enables dorsiflexion. 23 Figure 2.6 Angle of pull and resultant forces during 360 degrees of
the crank cycle. 24 Figure 2.7 Effect of cadence on biological work is significant while
freewheeling (0 watts) but diminishes at higher
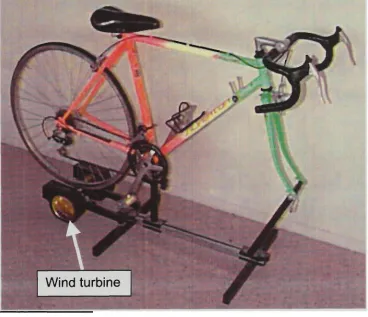
workloads (from Banister and Jackson, 1967). 35 Figure 3.1 Windtrainer used during the early development of
ergometry system 41 Figure 3.2(a) Aliasing effects - 360 samples 45
Figure 3.2(b) Aliasing effects - 10 samples 45
Figure 3.2(c) Aliasing effects - 7 samples 45 Figure 3.3 Microcomputer and associated circuitry. 47
Figure 3.4 Frame constructed to support the bicycle, alternator,
tacho and TDC optical sensor. 48 Figure 3.5 Bracket used to fix the position of the alternator. 52
Figure 3.6 Load Cell measuring the contact force between the
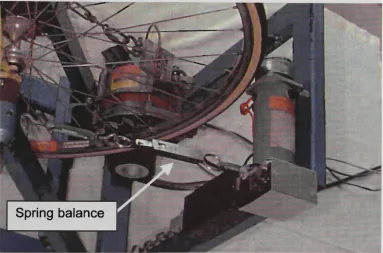
alternator and the rear wheel. 53 Figure 3.7 Spring balance used to set a constant contact force
between the tacho and rear wheel. 54 Figure 3.8 Load resistance, cooling fans and associated circuitry.
55
Figure 3.9 Alternator drive roller wear. 56 Figure 3.10 Phase shift between electrical and mechanical power
is less than 1 degree. 61 Figure 3.11 Alternator and tacho driven by the rear wheel. 62
Figure 3.12 Repco calibration-device attached to the ergometry
system 66 Figure 3.13 Arterialised blood sampling. 79
Figure 3.14 Measurement of horizontal distance between kneecap
and pedal axle 82 Figure 3.15 Metabolic, power and video data collection. 85
Figure 3.16 Analysis of Lactate samples using the Cobas Bio
Spectrophotometer. 90 Figure 3.17 Measurement of the angle between the foot (pedal)
and the bicycle crank (0) 94 Figure 3.18 Caloric values for Nonprotein R 95
Figure 4.1 Mechanical power versus electrical power with cadence
varying between 60 and 115 RPM. 100 Figure 4.2 Mechanical power versus electrical power for three load
resistances. 100 Figure 4.3 Calibration system 108
Figure 4.4 Graph of predicted value of mechanical power output
versus measured mechanical power output. 110 Figure 4.5 Effect of spring in line with the load cell used to
measure force 111 Figure 4.6 Graph of predicted value of mechanical power output
versus measured mechanical power output. The line of best fit is a cubic function indicating curvilinearity. 113 Figure 4.7 Graph of predicted value of mechanical power output
versus measured mechanical power output with
alternator RPM included as a variable. The line of best
fit is a cubic function indicating curvilinearity. 114
Figure 4.8 Graph of predicted value of mechanical power output versus measured mechanical power output. The line of best fit is linear indicating that the quadratic model is a
good fit. 117 Figure 4.9 Graph of the residuals versus the predicted values of
mechanical power output of the final calibration. 118
Figure 5.1 Monark ergometer (Model 864) 121 Figure 5.2 A locally manufactured air-braked ergometer used by
the Victorian Institute of Sport 123 Figure 6.1 Adolescent cyclist being tested on the author's
ergometry system 132 Figure 7.1a Biological efficiency of the experimental group for the
four tests comparing efficiency of normal pedalling and
ankling (mean, +SD) 151 Figure 7.1b Biological efficiency of the control group for the four
tests comparing efficiency of normal pedalling and
ankling (mean, ±SD) 152 Figure 7.2 Delta efficiency (ankling efficiency - normal efficiency) of
the experimental group for the four tests showing the trend in the difference between normal pedalling and
ankling 153 Figure 7.3 Cadence variations were sinusoidal with two complete
cycles of a sinewave for each crank revolution (data
from one test for cyclist no: 4 shown) 163
Figure 7.4 Horizontal distance measured between the plumb line dropped from the front of the knee to the centre of the
pedal with the crank at 90° 165 Figure 7.5 Horizontal distance (R) measured between the plumb
line dropped from the front of the seat to the centre of
the crank 167 Figure 7.6 Seat height measurement (Hs) measured from the top
surface of the centre of the seat to the centre of the
crank axle 168
LIST OF APPENDICES
Title
PageAPPENDICES 220
Figure A.I 24 Volt 55 Amp alternator (part no BXU2455) initial performance curve. Robert Bosch (Australasia).220
APPENDIX B 221
Figure B.I XTRAN Load Cell. Applied Measurement,
Melbourne Australia 221 Table B.I XTRAN SI Load Cell specifications. Applied
Measurement, Melbourne Australia 222
APPENDIX C 223
C.I Strain gauge amplifier (RS stock no. 846-171 and printed circuit board (RS stock no. 435-692) RS Components Ltd.
Corby, Northants, UK 223 C.1.1 Description and operation 223
Table C.I Specifications (At 25°C ambient and ±12V supply unless otherwise stated) RS Components Ltd.
Corby, Northants, UK 225
APPENDIX D 226
D.I General technical description of the electronically-braked ergometry system not included in the body of the thesis
226
D.1.1 Microcontroller 80C552 - General overview 228 Figure D.I Block diagram of electronically-braked ergometry
system 232
APPENDIX E 233
Table E.I Sample WINLOG lookup table (winlog.ini file) used by the software to look up variables that were entered into the computer during the setup
procedure 233
APPENDIX F 235
APPENDIX G 240
Figure G.I Reliability of lactate threshold protocol. Test 1 & Test 2 were detections of the lactate threshold on five cyclists on two occasions, each one week
apart 240 Figure G.2 Lactate threshold detections for subject #1 who
underwent duplicate testing ( • represents Test 1,
• represents Test 2, one week later) 241
APPENDIX H 242
Figure H.I Sample Ventilatory threshold graph 243
APPENDIX I 244
APPENDIX J 249
APPENDIX K 254
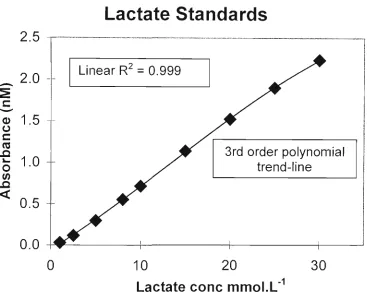
Figure K.I Test - retest reliability of the lactate assay 254 Figure K.2 Standard graph for lactate assay - standards 255 Figure K.3 Standard graphs for lactate assay - samples with
linear regression line (cyclist # 28) 256
APPENDIX L 257
Table L.I First calibration of electronically-braked ergometry
system - Model summary 258 Table L.2 First calibration of electronically-braked ergometry
system - Anova table 258 Table L.3 First calibration of electronically-braked ergometry
system - Beta Coefficients 259 Table L.4 First calibration of electronically-braked ergometry
system - Collinearity Diagnostics 260
APPENDIX M 261
Table M.I Second calibration of electronically-braked
ergometry system - Model summary 262 Table M.2 Second calibration of electronically-braked
ergometry system - ANOVA table 262 Table M.3 Second calibration of electronically-braked
ergometry system - Beta Coefficients 263
Table M.4 Second calibration of electronically-braked
ergometry system - Collinearity Diagnostics 264
APPENDIX N 265
Table N.I Second calibration of electronically-braked ergometry system (alternator RPM added as an
independent variable) - Model Summary 266 Table N.2 Second calibration of electronically-braked
ergometry system (alternator RPM added as an
independent variable) - ANOVA table 266 Table N.3 Second calibration of electronically-braked
ergometry system (alternator RPM added as an
independent variable) - Beta Coefficients 267 Table N.4 Second calibration of electronically-braked
ergometry system (alternator RPM added as an independent variable) - Collinearity Diagnostics..268
APPENDIX O 269
Table 0.1 Second calibration of electronically-braked ergometry system (cubic polynomial - stepwise
method) - Model Summary 270 Table 0.2 Second calibration of electronically-braked
ergometry system (cubic polynomial - stepwise
method) - ANOVA table 270 Table 0.3 Second calibration of electronically-braked
ergometry system (cubic polynomial - stepwise
method) - Beta Coefficients 271
APPENDIX P 272
Table P.1 Second calibration of electronically-braked ergometry system (quadratic polynomial - enter
method) - Model Summary 273 Table P.2 Second calibration of electronically-braked
ergometry system (quadratic polynomial - enter
method) - ANOVA table 273 Table P.3 Second calibration of electronically-braked
ergometry system (quadratic polynomial - enter
method) - Beta Coefficients 274
APPENDIX Q 275
Table Q.I Third calibration electronically-braked ergometry system (quadratic polynomial enter method)
-Model Summary 276 Table Q.2 Third calibration electronically-braked ergometry
system (quadratic polynomial enter method)
-ANOVA Table 276 Table Q.3 Third calibration electronically-braked ergometry
system (quadratic polynomial - enter method) - Beta
Coefficients 277
APPENDIX R 278
R.I Newspaper article relating to one of the elite cyclists who
volunteered for the study 278
APPENDIX S 280
Table S.I Comparison of mechanical power output during the efficiency tests and the mechanical power output at the anaerobic threshold subdivided according to gender, age, and type of anaerobic threshold test
281
APPENDIX T 282
Table T.I Mechanical power output during the efficiency tests expressed as a percentage of the power output
measured at the anaerobic threshold 282
APPENDIX U 283
Table U.I Comparison of the RER between the males and females, the two age groups, and the two types of
anaerobic threshold tests 283
APPENDIX V 284
Table V.I Horizontal distance between a plumb line dropped from the front of the knee to the centre of the pedal with the crank at 90° for the males and females and the two age groups. A negative value indicates that
the front of the knee was behind the pedal 284
APPENDIX W 285
Table W.I Horizontal distance measured using a plumb line between the front of the bicycle seat and the centre
of the crank 285
GLOSSARY OF TERMS
Terms
AC voltage
Aliasing errors
Alternator efficiency
Analogue data
Anatomically neutral
Angular displacement
Ankling
Armature (winding)
Angular velocity
Description
Voltage where the polarity changes sinusoidally.
Errors caused by a low
data-sampling rate. Data peaks are often missed.
Electrical power output for a mechanical power input normally expressed as a percentage.
Continuous values of data
Term used to describe a joint that is in neither flexion nor extension.
Displacement of an object that is moving in a circular path measured in radians. Can also be measured in degrees.
Cycling technique prescribed as dorsiflexion of the foot at top dead centre (TDC), and plantarflexion at bottom dead centre (BDC), of the crank cycle
The coil of wire inside a generator in which a voltage is induced by a magnetic field.
Velocity of continuous movement in a circular path measured in radians per second. Can also be measured in revolutions per minute (RPM) or degrees per second.
Terms
Binary (language)
Biofeedback
Biological efficiency
Bottom dead centre (BDC)
Brushes (generator or altemator)
Cadence
Chainrings
Collinearity
Description
Mathematical language to the base 2 as opposed to decimal (base 10).
Technique of using feedback of a normally automatic bodily response to a stimulus, in order to acquire voluntary control of the response.
Power output for a given energy input. Normally expressed as a percentage.
Pedal crank arm vertical and below the centre of the crank
Carbon compound connections between the electrical wiring on the rotating shaft and the outside of the housing.
Term used to describe angular velocity of the bicycle crank, measure in revolutions per minute (RPM)
Circular rings attached to the crank axle. Evenly spaced teeth on the outer circumference allow the power generated by the cyclist to drive the rear bicycle wheel.
A condition in a regression analysis where two or more independent variables are closely related. This results in the parameter estimate not being very solid.
Terms
Commutator
Crank arm
Crank axle
Current (electric)
Cyclograph
Delta (A or 6)
Digital
Dorsiflexed
Dorsiflexion
DOS
Description
Copper strips, insulated from each other, mounted on the generator shaft. As the shaft rotates, the alternating contact by the brushes with the commutator segments produces a constant-polarity voltage output.
Metal arm connected between the crank axle and the pedal axle.
Short axle supported by bearings. The axle is attached to the crank arm and chainrings.
The flow of electrons in a conductor caused by the
application of a potential difference (a voltage)
Pressure measurement device
Greek letter used as a mathematical abbreviation for a change in a numerical value.
Discrete data that is represented by a binary number (0 or 1) that can be "read" by a computer.
The ankle joint is flexed so that the angle between the foot and the lower leg is less than 90 degrees.
The act of dorsiflexing.
Computer abbreviation for Disc Operating System. This is software that allows the user to
communicate with the computer hardware.
Terms
Echelon
Electro-magnet
Electromyography (EMG)
Elliptical
Extension
EPROM
Flexion
Force
Force effectiveness
Freewheeling
Description
Term used in cycling to describe cyclists riding one behind the other.
A non-permanent magnet that requires electricity to provide a magnetic field.
Study of the action of muscles by measuring the electrical signals produced by muscular action.
Oval in shape (i.e. not perfectly circular).
Increasing the angle between two bones.
Computer abbreviation for Erasable Programmable Read Only
Memory. The stored contents of this memory can not be readily changed manipulated by the equipment end user. It is normally programmed in the factory during manufacture.
Decreasing the angle between two bones.
A push or pull that alters, or tends to alter, the state of motion of a body.
Instantaneous proportion of the force applied to the pedal that contributes to propulsion.
A wheel continues to rotate with no further external input of energy.
Terms
Generator (electrical)
Homogeneity (of variance)
Index of effectiveness
Inertia
Kinematics
LED (light emitting diode)
Load cell
Magnetic flux (alternator)
Mechanical efficiency
Metabolic
Metabolism
Moment of Inertia
Description
A device that converts mechanical energy into electrical energy.
The groups should come from populations with equal variances.
Synonym for "force effectiveness"
Property of matter by which it continues in its existing state of rest or uniform motion in a straight line, unless that state is changed by an external force.
The science of mechanics that describes the nature of motion. For example, distance, velocity, and acceleration.
Light emitting device, used in various electronic equipment.
A device that measures the forces exerted on an object. Also called a strain gauge.
Lines of force in a magnetic field.
Mechanical energy output -H
mechanical energy input. Normally expressed as a percentage.
Pertaining to metabolism.
Nutritive substances being converted into energy.
The quantity that characterises a body's resistance to changes in its angular motion.
Terms
Momentum Normality Ohm(s) Pedal Pedalling Phase shift Plantarflexed Plantarflexion Plumb-line Power DescriptionThe quantity of motion of a body and is equal to the product of the body's mass and velocity.
The scores within each variable should be normally distributed.
Unit of measure of electrical resistance to the flow of electrons.
Platform that is attached to the cyclist's foot when riding a bicycle.
Action of rotating the crank arm about its axis in order to deliver power to the rear wheel of the bicycle.
In a sinusoidal wave the difference in time of two parts of that wave are referred to as a phase
difference. This phase difference is measured in degrees with 360 degrees being one complete cycle of the wave.
The ankle joint is flexed so that the angle between the foot and the lower leg is greater than 90 degrees.
The act of plantarflexing.
When a horizontal distance is required to be measured between two objects that are not on the same vertical plane, a weighted-string line is suspended from the higher object.
Power is the measurement of the rate of doing work and is measured in watts.
Terms
Radial force
Range of Motion (ROM)
Relay
Resistance (electrical)
Resistive
RAM
Rolling resistance
ROM
Rotor (alternator)
Serial Port
Description
A force in the direction of the radius of angular motion.
Maximum angular displacement occurring in the movement of a joint in the body.
Electro-magnetic operated switch.
Opposition to movement of electrons.
see Resistance
Computer abbreviation for Random Access memory. This memory stores data that can later be read. The memory is volatile in that data stored is lost when power is
removed from the memory.
Frictional resistance when one object tends to rotate or roll along another object.
Computer abbreviation for Read Only Memory. This memory has a program permanently stored within it and cannot be altered.
An electromagnet consisting of a coil of wire mounted on the shaft of the altemator.
A data connection in a computer that allows the data to be
transferred between devices sequentially. Data transfer via this type of connection is relatively slow.
Terms
Sinusoidal
Spatial model
Sphericity
Strain gauge
Synchronise
Tacho
Tachometer
Tangent
Toe clips
Top dead centre (TDC)
Description
Oscillatory wavelike motion within a variable. The magnitude of the variable varies cyclically above and below the mean value over time.
Terminology used to define the relative positions of the various parts of the human body. This is necessary in the study of human movement.
The variance of the population difference scores for any two conditions should be the same as the variance of the population difference scores for any two other conditions.
A device that measures the forces exerted on an object. Also called a load cell.
To occur at the same time.
Abbreviation for tachometer.
A device which can measure angular velocity (revolutions per minute)
A line drawn at the circumference of a circle at a right angle to the radius.
Strap used on a bicycle pedal to ensure constant contact with the pedal.
Pedal crank arm vertical and above the centre of the crank
Terms
Torque
Tour de France
Universal joint
Ventilometer
Vernier calliper
Voltage
Wide band (radio frequency noise)
WINDOWS
Zero crossing detector
Description
Torque is the turning effect about a point and is equal to the product of the force and the perpendicular distance from the point to its line of action.
Cycling race for world class cyclists.
A joint on a rotating shaft that allows a certain degree of misalignment.
A device that measures airflow against a fixed resistance. Also called a pneumotachograph, pmeumotachometer or anemometer.
Precision measurement tool.
Electrical term to describe the potential difference between two points when work is done in moving a charge of electricity between them.
Noise generated over a wide range of frequencies.
Computer operating system that interfaces between the user and most applications software.
Electronic circuit which is capable of detecting when an alternating voltage changes polarity.
CHAPTER 1
INTRODUCTION
Although cycling is one of the most effective means of transportation
(Wilson, 1973), humans are forever trying to improve on its efficiency.
Much development has gone into making bicycles lighter, stronger, and
more aerodynamic, with less rolling resistance and with a more efficient
drive system.
As well as looking at improving upon the technology of the bicycle,
research has continued to find ways to improve the effectiveness of the
human body as a means of bicycle propulsion. Although human
cardiovascular fitness, muscular strength and muscular endurance are
among the most important aspects of the bicycle "engine", effective
technique is a common linking factor. The technique directly involved in
the propulsion of the bicycle is pedalling. Pedalling technique has been
manipulated and investigated regularly over the past century but remains
a controversial topic as researchers, coaches and athletes have been
unable to agree as to what technique(s) is/are ideal.
The pedalling technique that was investigated in this thesis is commonly
known as the "ankling" technique. The objective of this technique is to
orient the pedal so that it is at right angles to the direction of motion of
the pedal. When the crank approaches top dead centre (TDC) the cyclist
dorsi-flexes the ankle in order to push through this region and then
progressively plantar-flexes the foot, maintaining the pedal orientation at
right angles to the direction of travel of the pedal until the pedal passes
bottom dead centre (BDC). The cyclist then progressively dorsi-flexes the
ankle until the crank passes TDC.
1.1 PURPOSE OF THE STUDY
This thesis investigated the biological efficiency of volunteer competitive
cyclists, comparing their normal pedalling technique with the ankling
technique. Oxygen consumption and mechanical power output were
measured while the athletes were exercising at or close to the anaerobic
threshold. In order to be able to accurately measure the mechanical power
output of a cyclist, suitable equipment was required. An ergometer was
designed and constructed by the author, and an electronics engineer, that
would be more accurate than the commonly used air- and
mechanically-braked ergometers. In order to provide the participants with a familiar
environment, the ergometry system was also designed to accommodate
the athlete's own bicycle. Consideration in this design was given to a
system that could accommodate a wide range of bicycles. In order to be
was not possible with traditional air- and mechanically-braked
ergometers, this feature was included in the design to enable testing of
the supporting hypotheses.
Consequently, four studies were conducted:
1. Design, construction and calibration of an electronically-braked
ergometry system that would be accurate, reliable and
accommodate the athletes own bicycles.
2. Calibration of air- and mechanically-braked ergometers to
determine if the electronically-braked system was superior in
accuracy and reliability.
3. Pilot study of adolescent triathletes to test the operation of the
electronically-braked ergometry system and examine the
biological efficiency of the adolescents.
4. Investigation of 41 competitive cyclists to determine if:
a) ankling was anatomically feasible,
b) pedalling using the ankling technique resulted in the
cyclists being biologically more efficient,
c) the crank angle at which peak power occurred during
d) cadence varied within one crank revolution.
This study required several phases:
1. Maximum oxygen uptake test (VO2 max) - the resutis from
this test were used to provide a starting workload for the
anaerobic threshold test (50% VO2
max)-2. Anaerobic threshold test - the results from this test were
used to determine the workload for the subsequent tests
(95% of the anaerobic threshold).
3. Four efficiency tests conducted approximately one month
apart with the experimental group practising the ankling
technique throughout the periods intervening the four
efficiency tests. The control group underwent a sham
intervention. During this phase, video analysis allowed
1.2 HYPOTHESES AND RATIONALE
1.2.1 Central Hypotheses
1. Ankling is an anatomically feasible technique.
Rationale
Although it has been reported that ankling is possible, it was important to
prove this and establish that ankling did occur in the intervention by
measuring the change in the range of motion of the ankle joint. This
hypothesis leads into the major hypothesis that was that the use of
ankling would lead to an increased metabolic efficiency.
2. Anlcling technique is significantly more efficient than normal
pedalling while pedalling at a workload that approximates endurance
racing intensity.
Rationale
Although several studies have shown that there is a relationship between
pedal orientation and effective force production, there have been no
studies that have attempted to discover whether pedal orientation was
related to metabolic efficiency. This is the major hypothesis in this thesis
1.2.2 Supporting Hypotheses
1. The crank angle at which peak power occurs during ankling is
different to that for normal pedalling.
Rationale
If the angle is different then ankling does have an effect and this may
affect the average power for the "power" cycle and therefore metabolic
efficiency.
2. Cadence varies within one crank revolution.
Rationale
Bicycle ergometers employ a flywheel that stores kinetic energy and
therefore any variation in angular velocity may be minimal. They also do
not have a freewheel capability. This would lead to incorrect assumptions
about angular velocity of the bicycle cranks while cycling on the road.
The inertia of the rider and the bicycle only affects the peaks of the
cadence variations and not the troughs as the cyclist has the capacity to
ease up on the pedalling as desired due to the freewheel capability on a
road-racing bicycle.
3. The bicycle ergometer that will be developed for this thesis is more
Rationale
Although there is much evidence to show that various types of air- and
mechanically-braked ergometers were not accurate measurement tools,
the use of an electronically-braked ergometer would not be valid if it was
shown to be less accurate, despite its advantage of being able to use the
cyclists own bicycles.
1.3 ORGANISATION OF THE THESIS
The current chapter (Chapter 1) provides the rationale for the current
research and a statement of the problem. Chapter 2 provides a
background to the current problem. The relevant literature is reviewed in
four main areas. First, the concept of mechanical efficiency, with respect
to force applied to the pedals, is reviewed followed by a review of
mechanical force application. This second section also includes a review
of studies on biofeedback used to modify the pedalling technique. The
third area includes a review of the shape of the chainrings in relation to
their influence on the pedalling efficiency. Following this is a review of
the various definitions of biological efficiency.
Chapter 3 describes the design, development and calibration of the
electronically-braked ergometry system and the calibration of air- and
mechanically-braked ergometers in order to compare the accuracy and
reliability of existing ergometry systems with the present one. This
chapter also includes the general methods used in the biomechanical and
physiological data collection. Chapters 4, 5, 6 and 7 describe the results
of the four major studies.
• Chapter 4 - Development and calibration of the electronically-braked
ergometry system.
• Chapter 5 - Calibration and comparison of existing air- and
mechanically-braked ergometers with the ergometry system
developed for this thesis.
• Chapter 6 - Pilot study to test the operation of the
electronically-braked ergometry system.
• Chapter 7 - Comparison of the biological efficiency of ankling and
normal pedalling. This chapter also includes the biomechanical
analysis of the angle where peak force is applied, for both techniques,
and the cadence variations within one crank cycle.
Chapter 8 provides the summary of the results and the conclusions and
Chapter 9 outlines the contributions of this research including
CHAPTER 2
LITERATURE REVIEW
2.1 HUMAN POWER AND BICYCLE ERGOMETRY
Muscles transform chemical energy into mechanical energy (Wilkie
1960). The chemical energy comes ultimately from the oxidation of food.
Long duration energy production relies on an adequate supply of oxygen.
Cycling is one form of exercise where the muscle mass of the legs is
more than adequate to utilise all of the oxygen than can be absorbed.
As the human being is a limited power source, small changes can make a
significant difference (Kyle & Edelman, 1974). If human power is used
to propel a bicycle, not only can changes in the design of the bicycle
improve the performance of the human powered vehicle but also changes
in the technique that the cyclists employ. Many studies have utilised an
ergometer of one form or another and those that examined their accuracy
found many ergometers, especially the Monark, to be an inaccurate
measurement tool (Maxwell et al, 1998; Harman, 1989; Telford et al,
1980; Wilmore et al, 1982 and Zommers et al, 1995a). There are only a
few studies that have compared different ergometers. Three studies
compared the Kingcycle (Palmer et al, 1996), the Velodyne (Attaway et
Monark ergometer. All studies found a high degree of correlation in
physiological response between their ergometer and the Monark.
Considering the many studies that have found the Monark not to be an
accurate ergometer, especially the recent study by Maxwell et al (1998),
this casts doubt on the accuracy of the Kingcycle, Velodyne and Schwinn
Air-Dyne ergometers.
2.2 PEDALLING TECHNIQUE
Pedalling technique has been studied from a biomechanical and to a
lesser extent from a physiological perspective for about 100 years.
Efficient force application has been one of the most controversial topics
with researchers, coaches and elite cyclists being unable to agree as to
what pedalling technique should be adopted. This section focuses on
pedalling technique from a mechanical efficiency perspective. The next
section addresses the critical question of biological efficiency (power
output for a given energy input) in relation to technique. Biological
efficiency, rather than mechanical efficiency, is the focus of this thesis
and in particular, the thesis addresses the question of whether biological
efficiency can be improved using the "ankling" technique. As will be
seen from the research cited below, this technique has some support from
a biomechanical viewpoint. For the remainder of this section only, the
term efficiency is taken to mean mechanical efficiency except where
indicated otherwise. It is recognised that physiological attributes such as
endurance and power are critical to cycling performance while
mechanical and biological efficiency may potentially facilitate
performance.
2.2.1 Mechanical Efficiency
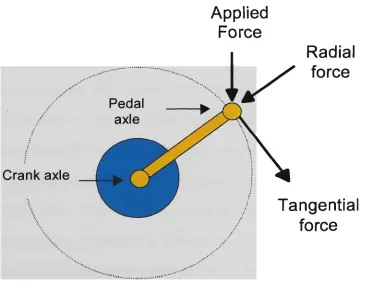
As early as 1896, Sharp cited research, by a Mr R.P. Scott, that purported
to investigate the pressure applied to the pedals of a bicycle by means of
a "cyclograph". Despite being a crude form of pressure measurement by
today's standards, it determined that the pressure applied was a sinusoidal
function repeated for each crank revolution. Sharp acknowledged that
these results gave no indication of the tangential effort on the crank. By
resolvmg the force applied to the pedal into two components, radial and
tangential (Figure 2.1), the tangential forces during the crank cycle could
be calculated.
Applied
Force
Radial
force
Tangential
force
Figure 2.1 Crank effort as defined by Sharp (1896). Applied force
may not necessarily be vertical, depending on the angle between pedal and crank.
By measuring only the force applied m a perpendicular dhection to the
pedals (Figure 2.2), and not measuring the forces in the other two axes,
the true applied force could not be calculated.
Vertical force
I Pedal
Fore/aft force
Lateral force
Figure 2.2 Actual forces applied to the pedals
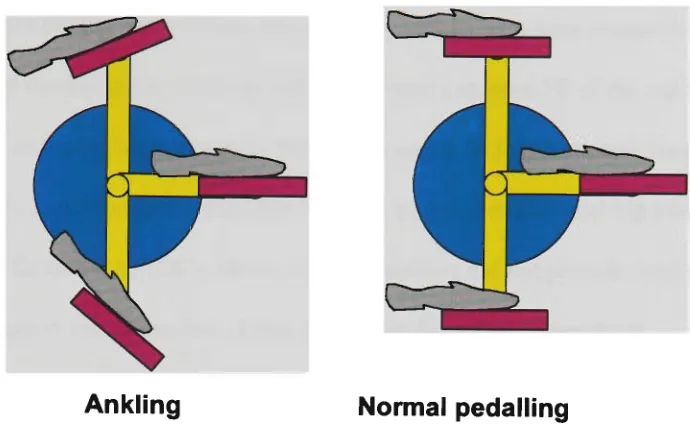
He went on to advocate a pedalling technique to overcome the low torque
production at top dead centre (TDC) and bottom dead centre (BDC).
This involved "clawing backwards" at BDC, which required a
plantarflexed (PF) foot and a horizontal push at TDC that requhed a
dorsiflexed foot (DF; Figure 2.3). This technique today is referred to as
ankling. Sharp (1986) also advocated liftmg of the leg during the
recovery phase of pedalling or upstroke. He suggested that toe clips
would be an advantage by reducing the forces that opposed propulsion
(Figure 2,4).
Ankling Normal pedalling
Figure 2.3 Ankling versus normal pedalling
Tangential
force
Gravity
i
Direction
t of rotation
Figure 2.4 Gravitational force on the upstroke opposes propulsion
on the downstroke.
2.2.1.1 Mechanical Force Application
Motion picture data of three experienced cyclists, who were instructed
not to modify their pedalling technique, clearly showed PF of the ankle
joint as the pedal approached BDC of the crank cycle (Houtz and Fischer,
1959). Dorsiflexion of the ankle was also reported at maximal hip and
knee flexion (i.e. TDC). However, these authors did not provide evidence
to support this contention. Force pedal data from five competitive
cyclists, with a mean VO2 max of 64 ml.kg"'.min"', showed that they were
in DF at an angle approximating TDC and were in PF at an angle
approximating BDC (Gregor, 1976). Hull and Davis (1981) hypothesised
that optimal tangential force could only be attained by orienting the
pedals at or near perpendicular to the tangential axis. Their calculations
showed that efficiency could be increased by applying PF between 90°
and BDC. Toe clips on the pedals can theoretically increase efficiency by
permitting greater DF movement. Hull and Davis (1981) also
hypothesised that injury and fatigue may be reduced by modifying the
pedalling technique.
The "index of effectiveness", often called "force effectiveness", has been
used frequently to define effective force production relative to the applied
force (Ericson and Nisell, 1988; Lafortune and Cavanagh, 1980 & 1983;
Lafortune et al., 1983; and Lafortune, 1986). In a study investigating
biomechanical factors associated with elite performance, 15 competitive
cyclists were divided into two groups based on their performance in a 40
km time trial (Group 1 <56 minutes. Group 2 >56 minutes) (Coyle et a l ,
1991). Group 2 cyclists were more effective in their force production
(effective force relative to applied force) than the elite cyclists (Group 1),
although the latter were simply able to generate more force throughout
the crank cycle. From this study, it could be implied that effective force
production was not practised as much by elite cyclists, compared to other
trained cyclists, and does not appear to be the essential component in
determining performance.
Increased electromyographic (EMG) amplitude in the tibialis anterior
muscle between 300 and 360 degrees suggests that this muscle was
actively engaged in DF towards TDC during recovery (Hull and Jorge,
1985; and Jorge and Hull, 1984). This DF reoriented the foot and
therefore the pedal so that the force could be applied more effectively
during the early part of the down stroke. They presented a graph of pedal
load versus crank angle; showing that the tangential force was increased
between 300 and 360 degrees and therefore the cyclist was pulling the
pedal through this range. This provides evidence that this DF was active
in force production, rather than a passive reorientation following PF
during the down stroke and the first half of the up stroke.
Analysis of EMG data in eight leg muscles, of six experienced cyclists of
whom two were racers and two former racers, showed that gastrocnemius
was active between 30 and 270 degrees (Jorge and Hull, 1986). In the
region between 180 and 270 degrees, it is not clear if gastrocnemius acted
synergistically to the hamstrings in producing knee flexion. The increased
amplitude of EMG in the range of 180° to 270° does suggest that
gastrocnemius was active in flexion of the knee although active PF
cannot be ruled out.
Francis (1986) also hypothesised that force had to be directed tangentially
to the crank in order to produce more efficient propulsion. He also
proposed that extensive practice would enable the cyclist to leam more
efficient pedalling patterns. Film analysis of the leg movement pattem of
one Olympic champion sprinter showed DF occurring in the TDC region
(300 to 360 degrees) and PF progressively between TDC and BDC. The
EMG data indicates that gastrocnemius activity may have been largely
responsible for the PF from 90° to 180°. The above description may be
incomplete due to the lack of EMG data of other leg muscles (e.g. soleus)
that also contribute to PF.
Despite there being some research supporting the concept of ankling, or
documenting its usage by athletes, there is a body of evidence to show
that many elite cyclists do not use ankling (Cavanagh and Nordeen, 1976;
Faria and Cavanagh, 1978; Lafortune and McLean, 1989). DF, rather
than PF, was used during the downstroke by some athletes (Cavanagh
and Nordeen, 1976; and Soden and Adeyefa, 1979). When power on a
cycle ergometer was increased, the extent of DF at BDC increased (Black
et a l , 1993; and Kautz et al., 1991). Similarly, some racing cyclists used
PF at TDC, in contrast to the ankling concept (Kolin and de la Rosa,
1979). Kolin and de la Rosa (1979) hypothesised that PF of the foot at
BDC, as in ankling, was not a conscious effort but occurred as a passive
consequence of centrifugal force which did not allow the heel to drop,
especially at high RPM. However against this proposal is the EMG data
showing that gastrocnemius activity increased between 90 and 180 (Jorge
and Hull, 1986). Kolin and de la Rosa (1979) also hypothesised that
ankling was an exaggeration of the motions used in walking, that it was
passive rather than active, and thus was not applied to optimise force
application.
Despite the research that showed that an ankling technique where DF
takes place at TDC and PF at BDC was not going to lead to a more
effective force production (Black et al., 1993; Cavanagh and Nordeen,
1976; Cavanagh and Sanderson, 1986; Faria and Cavanagh, 1978; Kautz
et a l , 1991; Kolin and De la Rosa, 1979; Lafortune and McLean, 1989;
and Soden and Adeyefa, 1979) the Australian Cycling Federation
coaching manual (Waiters, 1987) advocates that a form of ankling should
be adopted. The Australian Cycling Federation (Walters, 1987)
recommend that ankling be used for high RPM pedalling but avoided in
hill climbing.
To further confound the issue, Bernard Hinault, a multiple winner of the
Tour de France had a pedalling style that was very different to other
athletes at the time by dorsiflexing the ankle joint at TDC (Lieb, 1980).
Anquetil, another world-class cyclist exhibited a lot of PF as the crank
approached BDC (Hinauh and Genzling, 1988a). Thus, both these
champion cyclists exhibited some components of ankling in their
techniques. However the variation in technique that has been described
by many researchers (Davis and Hull, 1981; Hinauh and Genzling,
1987a,b & 1988a; Jorge and Hull, 1984; Kautz et al., 1991; and Lafortune
and McLean, 1989) provides empirical evidence against the universal
adoption of a technique such as ankling.
From film analysis of seven elite 4000 metre pursuit cyclists Cavanagh
and Sanderson (1986) hypothesised that ankling was anatomically
impossible while the rider remained seated. However when the seat was
raised, the ROM of the ankle joint increased (Ericson et al., 1988). This
raises the possibility that more PF may have occurred in earlier studies,
had the seat been raised.
DF of the ankle joint varied between 13° (Boone and Azen, 1979) and
40O (Glanville and Kreezer, 1937) from the anatomically neutral
position, while PF varied from 23© (Sammarco et al., 1973) to 56^
(Boone and Azen, 1979) from neutral. This data indicates that it is
theoretically possible to move the ankle through the ROM required to
perform ankling. The ROM of a recreational cyclist, who was instructed
to display the ankling technique, was 20° DF to 45° PF (Zommers,
unpublished, 1987). This indicates that it is also possible to pedal using
the ankling technique but whether athletes can improve their effective
force output by learning the technique, such that it becomes natural, has
not been satisfactorily established.
In a study to investigate the pedal loading in cycling (Davis and Hull,
1981), one volunteer was instmcted to use ankling with a special
emphasis on pulling up during the upstroke (i.e. BDC to TDC). The
results showed that the athlete was able to increase the upward pull and
shear forces on the pedals during the upstroke, however the use of
ankling also resulted in a decrease in the applied forces to the pedals
during the downstroke from TDC to BDC. However this study was
anecdotal (n=l). Although variations in pedalling technique have been
observed by many, the kinematic data alone does not reflect the changes
in force applied by the limbs (Davis and Hull, 1981).
Several factors have either been overlooked or ignored in this pedalling
technique controversy. As the foot moves in a circular pattem, there will
be a large inertial component at the pedal, which is not measured and
therefore may alter the requirements for optimising the torque production
(Broker and Gregor, 1996; Kautz and Hull, 1993; and Papadopoulos,
1987). The second factor, gravity, will assist during the downstroke but
from BDC to TDC will oppose the work done by the opposite leg (Broker
and Gregor, 1996). Ignoring the gravity and inertial components could
provide a misleading measure of the tme pedalling efficiency. Removal
of these components (gravity and inertia) may provide a better
representation of effective and ineffective pedalling (Broker and Gregor,
1996).
The physical laws of levers are another important factor (Figure 2.5).
With first and third class levers such as gastrocnemius/soleus and tibialis
anterior, respectively, force production is relatively low (Thompson,
1985). This indicates that a fully PF ankle would not be able to provide
much assistance to the quadriceps at BDC (Gravel et al., 1990). Against
this, gastrocnemius nevertheless produces some force, which is useful.
Both of these types of levers are also able to produce speed of movement
and large range of motion (Thompson, 1985). Large range of motion of
the ankle joint is necessary for the ankling technique and in DF the high
speed of movement allows the athlete to quickly reorient the foot to a DF
position prior to TDC to optimise the effective force production (Gravel
etal., 1990).
Gastrocnemius
f^ and Soleus Tibialis
anterior
Power Weight
Fulcrum Fulcrum Power Weight
First class lever Third class lever
Figure 2.5 Levers. First class lever (gastrocnemius and soleus)
enables plantarflexion while third class lever (tibialis anterior) enables dorsiflexion.
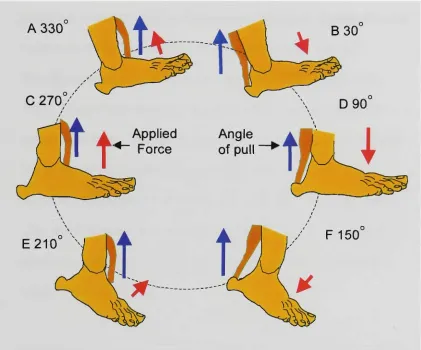
Another factor, but possibly the most important, is the angle of pull of the
muscles associated with DF and PF. The most advantageous angle of pull
is when the limb segment (in this case the foot) moves in parallel to the
contraction of the active muscle fibres. Usually this occurs near the mid
point of the ROM of the joint (Figure 2.6 C & D). When the joint is in
plantarflexion the angle of pull generates less applied force (Figure 2.6 B
& F). The angle of pull for the dorsiflexors is similar to that described for
the plantarflexors above (Figure 2.6 A & E)
A 330
C 2 7 0 /
Figure 2.6 Angle of pull and resultant forces during 360 degrees of
the crank cycle.
Finally, the relaxed length of a muscle that is attached to a bone is at or
near its optimal length. At this length, the muscle will develop its
maximum tension. As the muscle lengthens the amount of overlap
between the thick and thin filaments decreases thereby decreasing the
amount of tension that can be developed. As the muscle shortens the total
number of active cross bridges decrease and eventually the thick
filaments become compressed against the two Z lines. (Vander et al.,
1985) Tension development is therefore reduced. As the length of a
muscle attached to a bone rarely exceeds a 30%) change from its optimal
length, the ability to develop tension rarely falls below 50% of its
maximum. This applies to plantarflexion during the downstroke between
TDC and BDC and dorsiflexion between 300° and TDC. In each case,
tension developed is not thought to be severely compromised by the
length of the muscle fibres.
Muscular work depends on the length - tension, force - velocity - power
relationships and the effectiveness of force production. This is affected by
joint angle, muscle length and muscle movement arm length (de Groot et
al, 1994). These variables are affected by pedalling rate, position and
orientation of the body and changes in seat to pedal distance. When the
angle of the seat tube was changed, resulting in a different horizontal seat
to pedal distance, there was a change in the crank angle where maximum
force was obtained. Examination of graphs of muscular force versus