Paper on ‘Analysis of Deposits in The Mahendragarh Central Co-operative Bank Ltd. in Haryana’
Dr. N. P. Yadav1
Associate Professor of Commerce
Ahir (P.G.) College, Rewari
(Affiliated to M. D. University, Rohtak )
Dr. J. S. Yadav2
Assistant Professor of Commerce
Govt. College, Bawal District – Rewari (Haryana)
(Affiliated to M. D. University, Rohtak )
ABSTRACT
Thispaper examines the analysis of deposits in The Mahendragarh Central Co-operative Bank Ltd. The study is based on secondary data collected from the annual reports of the Bank from 2009-10 to 2015-16. For this purpose Chi- Square test has been applied in this study. The results reveal that the pattern of growth in various deposits under study does not experience the same growth. The proportion of current deposits noticed to be 2.33 percent, saving deposits 46.88 percent and fixed deposits 50.79 percent in total deposits. The study proves that significant growth has been recorded in all types of deposits during the period of study. The findings of the paper also offer some meaningful suggestions to improve the deposits of Bank.
Keywords: Current deposits, Saving Deposits, Fixed Deposits and Total Deposits.
Introduction
favour of objectives like serving the backward regions and the weaker section of the society and rendering assistance to small and cottage sector for employment generation. The Banks have contributed to an all-round growth of economy. Thus, the importance of banking sector in the economic development of our country cannot be overlooked. Both Co-operative and commercial banks have played a positive role in the growth of economy.
Deposits constitute the major source of funds for Central Co-operative Bank Ltd. The growth of deposits depends on savings. The savings are mobilized and channelized for capital formation which increases the speed for economic growth. The basic objective of any bank is facilitating the intermediation process. The first and foremost asset creating source is mobilizing deposits from public. The term capital deposits resource has been defined as per RBI (Amendment) Act 1977 to include any receipt of money by way of demands/Current deposits, term/fixed deposits etc. Deposits may be categorized into three forms i.e. demand deposits, time deposits and fixed deposits. Demand deposit is a deposit which can be withdrawn without notice and they can be repaid on demand current accounts and saving accounts are classified as demand deposits. Time deposits are repayable after a fixed date or after a period of notice. Fixed deposits include recurring deposits and miscellaneous deposits etc. Thus, a deposit of the bank shows the strength of the bank.
Objectives of the Study
1. To examine the growth of various deposits. 2. To assess the composition of various deposits.
3. To test whether the various deposits i.e. current deposits, saving deposits, fixed deposits and total deposits are increasing or not.
Hypothesis of the Study
H01 – The amount of current deposits is not increasing over the period of the study.
H02 - The amount of saving deposits is not increasing over the period of the study.
H03 - The amount of fixed deposits is not increasing over the period of the study.
H04- The amount of total deposits is not increasing over the period of the study.
Period of the Study
Index, trend values, percentage and Chi- Square test (χ2) have been applied to fulfill the objectives of the study.
Analysis and Discussion
The data analyzed have been presented in different tables (seven in numbers), reflecting upon the various objectives of the study.
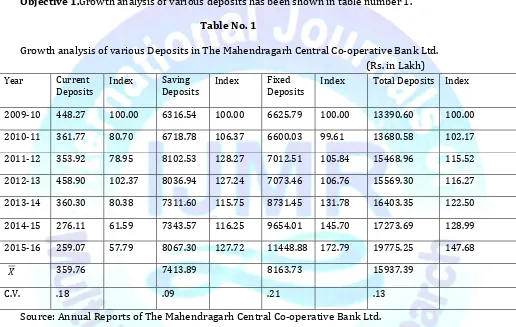
Objective 1.Growth analysis of various deposits has been shown in table number 1.
Table No. 1
Growth analysis of various Deposits in The Mahendragarh Central Co-operative Bank Ltd. (Rs. in Lakh)
Year Current
Deposits Index Saving Deposits Index Fixed Deposits Index Total Deposits Index
2009-10 448.27 100.00 6316.54 100.00 6625.79 100.00 13390.60 100.00
2010-11 361.77 80.70 6718.78 106.37 6600.03 99.61 13680.58 102.17
2011-12 353.92 78.95 8102.53 128.27 7012.51 105.84 15468.96 115.52
2012-13 458.90 102.37 8036.94 127.24 7073.46 106.76 15569.30 116.27
2013-14 360.30 80.38 7311.60 115.75 8731.45 131.78 16403.35 122.50
2014-15 276.11 61.59 7343.57 116.25 9654.01 145.70 17273.69 128.99
2015-16 259.07 57.79 8067.30 127.72 11448.88 172.79 19775.25 147.68
𝑋 359.76 7413.89 8163.73 15937.39
C.V. .18 .09 .21 .13
Source: Annual Reports of The Mahendragarh Central Co-operative Bank Ltd.
Table No. 1 reveals that current deposit has grown .58 times with C.V. value .18. This proves a very low growth in current deposits over the period of the study. The saving deposits have risen 1.28 times with C.V. value .09. This witnesses a slow growth in saving deposits for the same period of the study. The rise in fixed deposits is about 1.73 times with C.V. value .21.The value of C.V. .21 is just reasonable. The growth in total deposits is about 1.48 times with C.V. value .13. This witnesses that growth in total deposits is nominal. It appears that all the deposits under study do not experience the same growth.
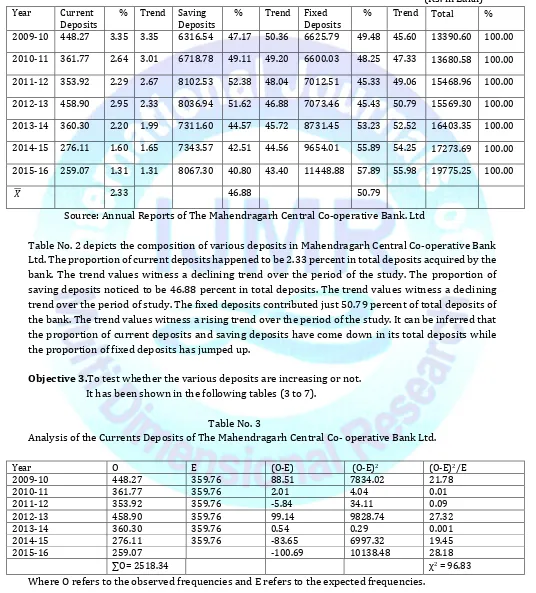
Table No. 2
Composition analysis of various Deposits in The Mahendragarh Central Co-operative Bank. Ltd.
(Rs. in Lakh)
Year Current
Deposits % Trend Saving Deposits % Trend Fixed Deposits % Trend Total %
2009-10 448.27 3.35 3.35 6316.54 47.17 50.36 6625.79 49.48 45.60 13390.60 100.00
2010-11 361.77 2.64 3.01 6718.78 49.11 49.20 6600.03 48.25 47.33 13680.58 100.00
2011-12 353.92 2.29 2.67 8102.53 52.38 48.04 7012.51 45.33 49.06 15468.96 100.00
2012-13 458.90 2.95 2.33 8036.94 51.62 46.88 7073.46 45.43 50.79 15569.30 100.00
2013-14 360.30 2.20 1.99 7311.60 44.57 45.72 8731.45 53.23 52.52 16403.35 100.00
2014-15 276.11 1.60 1.65 7343.57 42.51 44.56 9654.01 55.89 54.25 17273.69 100.00
2015-16 259.07 1.31 1.31 8067.30 40.80 43.40 11448.88 57.89 55.98 19775.25 100.00
𝑋 2.33 46.88 50.79
Source: Annual Reports of The Mahendragarh Central Co-operative Bank. Ltd
Table No. 2 depicts the composition of various deposits in Mahendragarh Central Co-operative Bank Ltd. The proportion of current deposits happened to be 2.33 percent in total deposits acquired by the bank. The trend values witness a declining trend over the period of the study. The proportion of saving deposits noticed to be 46.88 percent in total deposits. The trend values witness a declining trend over the period of study. The fixed deposits contributed just 50.79 percent of total deposits of the bank. The trend values witness a rising trend over the period of the study. It can be inferred that the proportion of current deposits and saving deposits have come down in its total deposits while the proportion of fixed deposits has jumped up.
Objective 3.To test whether the various deposits are increasing or not.
It has been shown in the following tables (3 to 7).
Table No. 3
Analysis of the Currents Deposits of The Mahendragarh Central Co- operative Bank Ltd.
Year O E (O-E) (O-E)2 (O-E)2/E
2009-10 448.27 359.76 88.51 7834.02 21.78
Table No.3 shows the analysis of current deposits for the period of seven years study. The tabulated value of χ2 test at 1% and at 5% of level of significance is 16.81 and 12.59 respectively. The calculated value of χ2 test is more than the tabulated value. The null hypothesis (H01) is rejected. It can be said that the amount of current deposits is increasing during the period of the study.
Table No. 4
Analysis of the Saving Deposits of The Mahendragarh Central Co- operative Bank. Ltd
Year O E (O-E) (O-E)2 (O-E)2/E
2009-10 6316.54 7413.89 -1097.35 1204177.02 162.42
2010-11 6718.78 7413.89 -695.11 483177.91 65.17
2011-12 8102.53 7413.89 688.64 474225.05 63.96
2012-13 8036.94 7413.89 623.05 388191.30 52.36
2013-14 7311.60 7413.89 -102.29 10463.24 1.41
2014-15 7343.57 7413.89 -70.32 4944.90 0.67
2015-16 8067.30 7413.89 653.41 426944.63 57.59
∑O= 51897.26 χ2 = 403.58
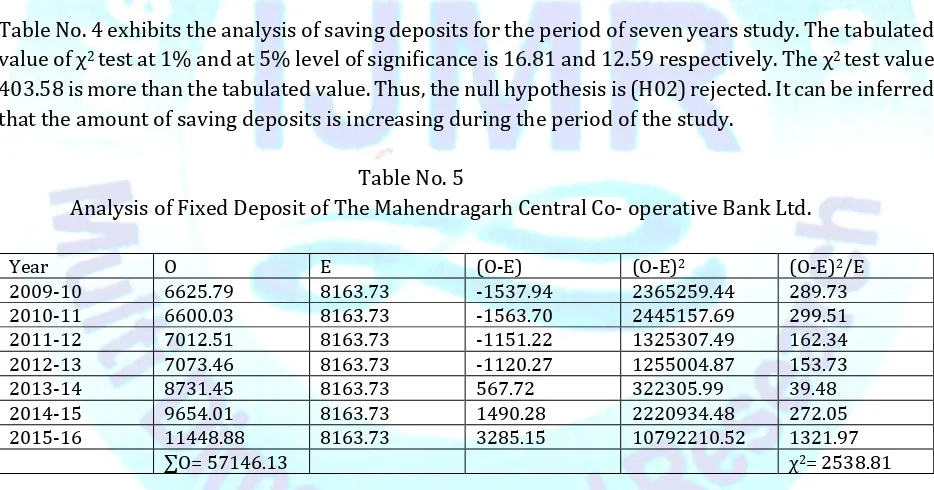
Table No. 4 exhibits the analysis of saving deposits for the period of seven years study. The tabulated value of χ2 test at 1% and at 5% level of significance is 16.81 and 12.59 respectively. The χ2 test value 403.58 is more than the tabulated value. Thus, the null hypothesis is (H02) rejected. It can be inferred that the amount of saving deposits is increasing during the period of the study.
Table No. 5
Analysis of Fixed Deposit of The Mahendragarh Central Co- operative Bank Ltd.
Year O E (O-E) (O-E)2 (O-E)2/E
2009-10 6625.79 8163.73 -1537.94 2365259.44 289.73
2010-11 6600.03 8163.73 -1563.70 2445157.69 299.51
2011-12 7012.51 8163.73 -1151.22 1325307.49 162.34
2012-13 7073.46 8163.73 -1120.27 1255004.87 153.73
2013-14 8731.45 8163.73 567.72 322305.99 39.48
2014-15 9654.01 8163.73 1490.28 2220934.48 272.05
2015-16 11448.88 8163.73 3285.15 10792210.52 1321.97
∑O= 57146.13 χ2= 2538.81
Table No. 6
Analysis of Total Deposits of The Mahendragarh Central Co- operative Bank Ltd.
Year O E (O-E) (O-E)2 (O-E)2/E
2009-10 13390.60 15937.39 -2546.79 6486139.30 406.97
2010-11 13680.58 15937.39 -2256.81 5093191.38 319.97
2011-12 15468.96 15937.39 -468.43 219426.66 13.77
2012-13 15569.30 15937.39 -368.09 135490.25 8.50
2013-14 16403.35 15937.39 465.96 217118.72 13.62
2014-15 17273.69 15937.39 1336.30 1785697.69 112.04
2015-16 19775.25 15937.39 3837.86 14729169.38 924.19
∑O= 111561.73 χ2 1798.66
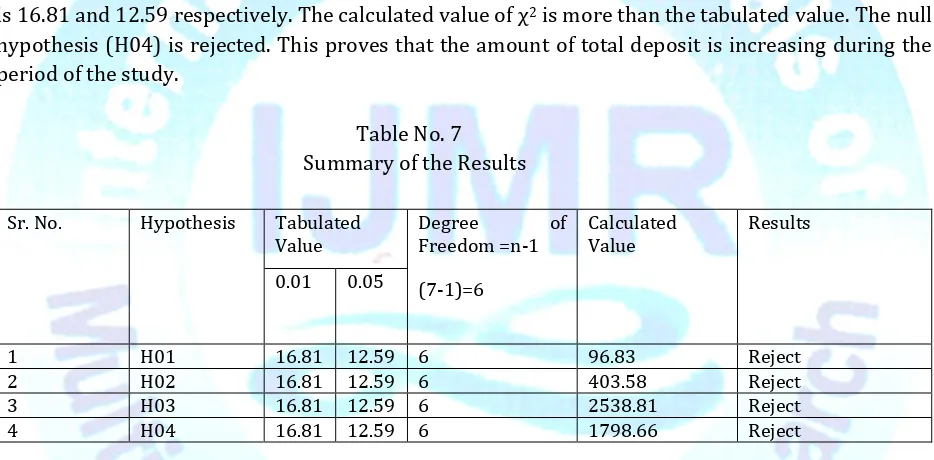
Table No.6 shows that the analysis of total deposits for the periods of seven years study. The calculated value of χ2 test is 1798.66. The tabulated value of χ2 at 1% and at 5% level of significance is 16.81 and 12.59 respectively. The calculated value of χ2 is more than the tabulated value. The null hypothesis (H04) is rejected. This proves that the amount of total deposit is increasing during the period of the study.
Table No. 7
Summary of the Results
Sr. No. Hypothesis Tabulated
Value Degree Freedom =n-1 of
(7-1)=6
Calculated
Value Results
0.01 0.05
1 H01 16.81 12.59 6 96.83 Reject
2 H02 16.81 12.59 6 403.58 Reject
3 H03 16.81 12.59 6 2538.81 Reject
4 H04 16.81 12.59 6 1798.66 Reject
Table No. 7 portrays that the hypothesis i.e. H01, H02, H03 and H04 rejected. It can be inferred that the amount of current deposits, saving deposits, fixed deposits and total deposits have increased during the period of the study in The Mahendragarh Central Co- operative Bank Ltd. in Haryana.
Findings and Suggestions
percent of level of significance of various deposits i.e. current deposits, saving deposits, fixed deposits and total deposits. It proves that significant growth has been observed in all types of deposits of the Mahendragarh District Central Co-operative Bank Ltd. in Haryana.
The findings of this paper may be useful to the government, society, public, depositors, savers, users and fund managers to judge the amount of various deposits mobilized and channelized for capital formation which, in turn accelerates economic growth. The Central Co-operative Bank should go for the use of information technology and other electronic methods in this changing scenario of the banking sector that help to improve the amount of various deposits, to improve the deposits mobilization and to create banking habits among the people. The bank should conduct awareness programs from time to time in circle and at villages. It is expected that with proper Co-operation and Co-ordination of the public as well as government, the bank will do much better in future.
Scope for Further Research
Further researchers can examine lending, recovery and management of non-performing assets in Central Co-operative banks in Haryana.
References
1. Banerjee, A and Singh, S.K. Banking and Financial Sector Reforms in India, Deep & Deep Publications New Delhi, 2002.
2. Gupta, S.P., Statistical Methods, Sulthan Chand & Sons, New Delhi, 2008.
3. Machi Raju, H.R., Indian Financial System, Vikas Publishing House Pvt. Ltd., New Delhi, 1998, P.7.
4. Ramesh, T., Structural Reforms in Co-Operative Banking, The Management Accountant, Feb. 2007 P. 146-149.
5. Singh, Anand, Kumar, Vikas, Kumar, Shelindar, Deposits Mobilization By Baroda District Central Co-operative Bank Ltd. , Indian Journal of finance, March 2011, Vol. 5, No.3, P. 10-17. 6. Verma, H.L, Malhotra, A.K: Funds Management in commercial banks, Deep & Deep
Publications New Delhi, 1993. P. 24.