Pressure and Stress Transients in Autoinjector Devices
Thesis by
Jean-Christophe Veilleux
In Partial Fulfillment of the Requirements for the Degree of
Doctor of Philosophy
CALIFORNIA INSTITUTE OF TECHNOLOGY Pasadena, California
2019
© 2019
Jean-Christophe Veilleux ORCID: 0000-0002-5420-9411
iii
ACKNOWLEDGEMENTS
First and foremost, I would like to express my gratitude to Professor Joseph E. Shepherd, my advisor and mentor. Despite having an important commitment as Vice President of Student Affairs, Prof. Shepherd has always been available to discuss and help with my research. With his tremendous experience, he was always able to offer guidance throughout the course of my Ph.D, whether it was about research or my future endeavors. I am extremely thankful for all the help, support, and encouragement I received from Prof. Shepherd, and I will remain indebted to him for all he has done to make sure I become a successful researcher and engineer.
I would also like to extend my gratitude to the members of my thesis committee, Professors Morteza Gharib, Ravi Ravichandran, and Tim Colonius. I would also like to thank Prof. Tim Colonius for allowing me to use his computational resources and his numerical code, and for offering guidance and advising with regards to some of the numerical simulations I performed during my Ph.D. A special thank you to former and present members of his group, Drs. Kazuki Maeda and Kevin Schmidmayer, for their help with some of the numerical simulations.
I would like to thank Amgen for their financial support. Over the past few years, Amgen has offered Prof. Shepherd and myself the opportunity to work on a very exciting research project which combines a number of practical engineering issues, as well as a number of more fundamental challenges. In particular, I would like to thank Dr. Bruce Eu and Julian Jazayeri, with whom I had the opportunity to interact on a regular basis regarding my research project. Both have shown great interest in my research and progress. Bruce and Julian also provided me with invaluable technical information regarding autoinjector devices.
I am grateful and indebted to the Natural Sciences and Engineering Research Council of Canada for partial financial support of my graduate studies.
I am grateful to my parents, Sylvie and Marcel, for their loving support. It would not have been possible to accomplish my graduate studies abroad without their unconditional love and encouragement.
v
ABSTRACT
The viscosity of drug solutions delivered parenterally has been increasing over the years. Injecting viscous drug solutions using spring-actuated autoinjector devices is challenging due to a number of technical and human factor constraints. Some of the related challenges are investigated in this thesis.
Actuation of autoinjector devices powered using stiff springs can create deleterious pressure and stress transients which are not needed to achieve the normal functions of the device. Experimental measurements have shown that peak pressures and stresses substantially larger than what is needed to achieve the normal device function can occur during the actuation phase, creating unnecessary potential for device failure.
The acceleration of the syringe during actuation can be very large, often creating transient cavitation in the cone region. The occurrence or absence of cavitation is determined by the relative timing of syringe pressurization and syringe acceleration, which is affected by several factors such as the presence, location, and size of an air gap inside the syringe, and the friction between the plunger-stopper and the syringe.
Experiments and numerical simulations have shown that sharp pressure waves trav-eling inside the syringe can be amplified within the cone terminating the syringe. Despite the potential for shock focusing, the impulsive pressurization and the rapid deceleration of pre-filled syringes create a potential for failure which is localized in the syringe shoulder and at the junction between the flange and the barrel, not inside the cone. The cavitation events, on the other hand, create a potential for failure which is limited to a region in close proximity of the bubble upon collapse. The collapse of cavitation bubbles located within the syringe cone can be enhanced due to geometrical effects, and the resulting stresses can be large enough to cause syringe failure.
PUBLISHED CONTENT AND CONTRIBUTIONS
Veilleux, J.-C. and Shepherd, J. E. (2019). “Impulsive Motion in a Cylindrical Fluid-Filled Tube Terminated by a Converging Section”. In:ASME Journal of Pressure Vessel Technology. Accepted Manuscript. doi:10.1115/1.4042799.
Veilleux, J.C., Maeda, K., et al. (2018). “Transient Cavitation in Pre-Filled Sy-ringes During Autoinjector Actuation”. In:Proceedings of the 10th International Symposium on Cavitation. (Baltimore, MD). doi:10.1115/1.861851_ch203.
Veilleux, J.-C. and Shepherd, J.E. (2018). “Pressure and Stress Transients in Au-toinjector Devices”. In:Journal of Drug Delivery and Translational Research8 (5), pp. 1238–1253. doi:10.1007/s13346-018-0568-7.
Veilleux, J.-C. and Shepherd, J.E. (2017a). “Dampers and Methods for Performing Measurements in an Autoinjector”. Patent application 20180015224 (US). url: https://www.lens.org/lens/patent/123-673-900-361-650.
vii
TABLE OF CONTENTS
Acknowledgements . . . iii
Abstract . . . v
Published Content and Contributions . . . vi
Table of Contents . . . vii
List of Illustrations . . . x
List of Tables . . . xx
Nomenclature . . . xxi
Chapter I: Introduction . . . 1
1.1 Motivation . . . 1
1.2 Objectives and Structure . . . 6
Chapter II: Dynamic Events in Autoinjector Devices . . . 9
2.1 Actuation Sequence of a Typical Spring-Actuated Autoinjector . . . . 9
2.2 Transient Events During Autoinjector Actuation . . . 13
2.2.1 Acoustics and Wave Dynamics . . . 14
2.2.2 Event 1: Syringe Acceleration . . . 16
2.2.3 Event 2: Syringe Deceleration . . . 25
2.2.4 Event 3: Impact of the Driving Rod on the Plunger-Stopper . 37 2.3 SureClick Autoinjector . . . 41
Chapter III: In Situ Measurements . . . 45
3.1 Methodology and Material . . . 45
3.1.1 Step 1: Modifying the Shell . . . 46
3.1.2 Step 2: Modifying the Syringe Carrier . . . 47
3.1.3 Step 3: Removing the Needle . . . 47
3.1.4 Step 4: Mounting the Pressure Transducer . . . 48
3.1.5 Step 5: Filling the Syringe . . . 50
3.1.6 Step 6: Preparing the Syringe Surface . . . 51
3.1.7 Step 7: Installing the Strain Gauges . . . 51
3.1.8 Step 8: Assembling the Autoinjector . . . 53
3.1.9 Step 9: Mounting the Autoinjector on a Support . . . 53
3.1.10 Step 10: Final Preparation . . . 55
3.1.11 Limitations . . . 56
3.2 Results and Discussion . . . 57
3.2.1 Configuration 1: Glass Syringe Without an Air Gap . . . 59
3.2.2 Configuration 2: Glass Syringe With an Air Gap . . . 68
3.2.3 Configuration 3: Plastic Syringe Without an Air Gap . . . . 74
3.2.4 Configuration 4: Plastic Syringe With an Air Gap . . . 79
3.2.5 Friction Estimates . . . 84
Chapter IV: Large Scale Model Autoinjector . . . 87
4.1.1 Experimental Setup . . . 88
4.1.2 LS-DYNA Numerical Model . . . 92
4.1.3 Results . . . 94
4.1.3.1 Case 1 . . . 94
4.1.3.2 Case 2 . . . 100
4.1.3.3 Case 3 . . . 103
4.1.3.4 Case 4 . . . 106
4.1.3.5 Case 5 . . . 109
4.1.4 Conclusion on Cases 1 to 5 . . . 111
4.2 Dynamic Large-Scale Model Autoinjector . . . 113
4.2.1 Experimental Setup . . . 113
4.2.2 LS-DYNA Numerical Model . . . 118
4.2.3 Results: Syringe Acceleration and Pressurization . . . 119
4.2.3.1 Case 6 . . . 120
4.2.3.2 Case 7 . . . 131
4.2.3.3 Case 8 . . . 133
4.2.3.4 Case 9 . . . 135
4.2.3.5 Case 10 . . . 137
4.2.3.6 Case 11 . . . 147
4.2.3.7 Case 12 . . . 149
4.2.3.8 Summary of Cases 6 to 12 . . . 153
4.2.4 Results and Discussion: Syringe Deceleration . . . 156
4.2.4.1 Case 13 . . . 156
4.2.4.2 Case 14 . . . 163
4.2.4.3 Case 15 . . . 166
4.2.4.4 Summary of Cases 13 to 15 . . . 168
Chapter V: Numerical Simulations of Shock Focusing and Syringe Stresses . 170 5.1 Shock Focusing . . . 170
5.1.1 Numerical Model . . . 171
5.1.2 Shock Focusing in a Straight Cone . . . 172
5.1.3 Effect of the Half-Angle . . . 177
5.1.4 Effect of the Rise Time . . . 179
5.1.5 Effect of the Acoustic Impedance . . . 181
5.1.6 Focusing in the Cone of a Syringe . . . 184
5.1.7 Summary of Shock Wave Focusing . . . 185
5.2 Wall Stresses . . . 187
5.2.1 Numerical Model . . . 187
5.2.2 Static Internal Loading . . . 189
5.2.2.1 Simply Supported Flange . . . 189
5.2.2.2 Simply Supported Shoulder . . . 192
5.2.2.3 Summary of Static Stresses . . . 196
5.2.3 Dynamic Internal Loading . . . 198
5.2.3.1 Simply Supported Flange . . . 199
5.2.3.2 Simply Supported Shoulder . . . 202
ix
5.2.4 Syringe Deceleration . . . 205
5.2.4.1 Simply Supported Flange . . . 206
5.2.4.2 Simply Supported Shoulder . . . 207
5.2.4.3 Summary of Stresses Created by Syringe Decel-eration . . . 211
5.2.5 Weibull Curves . . . 211
5.2.6 Bubble Collapse . . . 214
Chapter VI: Bubble Dynamics in a Cone . . . 219
6.1 Collapse of a Cavitation Bubble . . . 219
6.2 Numerical Setup . . . 221
6.3 Bubble Collapse Time . . . 225
6.4 Pressure in the Tip . . . 231
6.5 Pressure in a Syringe Geometry . . . 236
6.6 Summary . . . 241
Chapter VII: Mitigation of the Pressure and Stress Transients . . . 243
7.1 Dampers for Autoinjector Devices . . . 245
7.2 Maximum Allowable Syringe Acceleration . . . 249
Chapter VIII: Summary & Future Work . . . 254
8.1 Summary . . . 254
8.2 Future Work . . . 258
Bibliography . . . 261
Appendix A: Acoustics and Method-of-Characteristics . . . 269
A.1 Introduction . . . 269
A.2 Acoustics and Fluid Mechanics . . . 270
A.3 Characteristics . . . 272
A.4 The Wave Equation . . . 274
A.5 The Acoustic Limit of the Method-of-Characteristics . . . 276
A.5.1 Boundary Conditions . . . 278
A.5.2 Initial Conditions . . . 279
A.6 Cavitation Model for the Method-of-Characteristics . . . 280
A.6.1 Qualitative Description of DVCM . . . 280
A.6.2 Mathematical Formulation of DVCM . . . 281
A.6.3 Numerical Implementation of DVCM . . . 282
A.7 Impact Between Solid Parts . . . 284
LIST OF ILLUSTRATIONS
Number Page
1.1 Concentration of FDA approved monoclonal antibodies over the years. 3 1.2 Flow in the barrel and the needle of a syringe resulting from a force
F applied on the plunger-stopper. . . 4 1.3 Example of a broken glass syringe. . . 6 2.1 Simplified schematic of the actuation sequence of a typical
spring-actuated autoinjector device. . . 10 2.2 Examples of pre-filled, glass syringes. . . 11 2.3 Schematic of a pre-filled syringe in a vertical, tip-down configuration
with and without an air gap. . . 12 2.4 Reflection and transmission of pressure/stress waves at the interface
between two media. . . 15 2.5 Schematic of the growth and collapse of a cavity shortly after the
abrupt acceleration of a liquid-filled syringe. . . 18 2.6 Pressure at the bottom wall of a liquid-filled syringe which is
impul-sively accelerated. . . 18 2.7 Space-time diagram of the pressure transient created by the impulsive
acceleration of the syringe. The syringe contains an ideal fluid which can sustain tension. . . 20 2.8 Space-time diagram of the pressure transient created by the
impul-sive acceleration of the syringe. The syringe contains an ideal fluid which can sustain tension. Results obtained with the method-of-characteristics. . . 21 2.9 Space-time diagram of the pressure transient created by the impulsive
acceleration of the syringe. The syringe contains a real fluid which does not sustain tension. . . 23 2.10 Space-time diagram of the pressure transient generated upon the
xi
2.12 Space-time diagram of the pressure transient in the liquid created by the impulsive deceleration of the syringe. The syringe contains an ideal fluid, and cavitation does not occur. . . 29 2.13 Space-time diagram of the stress transient in the syringe wall created
by the impulsive deceleration of the syringe. The syringe contains an ideal fluid, and cavitation does not occur. . . 29 2.14 Space-time diagram of the pressure transient (without cavitation)
or the stress transient created by the impulsive deceleration of the syringe. Results obtained using the method-of-characteristics. . . 31 2.15 Space-time diagram of the pressure transient (with cavitation) created
by the impulsive deceleration of the syringe. Results obtained using the method-of-characteristics. . . 31 2.16 Deformation of the syringe wall resulting from its interaction with a
pressure wave propagating in the liquid. . . 32 2.17 Velocity of the syringe during a deceleration of constant magnitude
over a time∆t. . . 33 2.18 Peak magnitude of the pressure or stress created by a constant
decel-eration of the syringe over a time∆t. . . 37 2.19 Pressure history at a fixed location along the barrel of the syringe
upon application of a forceF on the plunger-stopper. . . 40 2.20 SureClick autoinjector device. . . 42 2.21 Schematic of the key features of a SureClick autoinjector device. . . . 43
3.1 Schematic of a syringe carrier with an oblong slit for the leadwires of the strain gauges to be mounted on the syringe. . . 47 3.2 PCB 138M186 tourmaline underwater blast pressure sensor. . . 48 3.3 Schematic of a PCB 138M186 tourmaline underwater blast pressure
sensor mounted inside a syringe. . . 50 3.4 Schematic of a syringe instrumented with C2A-06-015LW-120 strain
gauges and a PCB 138M186 pressure transducer. . . 53 3.5 Schematic of an instrumented syringe mounted into a syringe carrier. 53 3.6 Schematic of a spring-actuated autoinjector device instrumented with
strain gauges and a pressure transducer. . . 54 3.7 Schematic of an instrumented autoinjector device mounted in
alu-minum blocks on a T-slot extrusion. . . 54 3.8 Schematic of an autoinjector device instrumented with strain gauges,
3.9 Position and velocity of the moving components in a SureClick au-toinjector – glass syringe without an air gap (test SC-033). . . 60 3.10 Liquid pressure in a SureClick autoinjector – glass syringe without
an air gap (test SC-033). . . 61 3.11 Hoop and axial strains on the barrel of the syringe in a SureClick
autoinjector – glass syringe without an air gap (test SC-033). . . 61 3.12 Position and velocity of the moving components in a SureClick
au-toinjector – glass syringe with an air gap (test SC-178). . . 69 3.13 Liquid pressure in a SureClick autoinjector – glass syringe with an
air gap (test SC-178). . . 70 3.14 Hoop and axial strains on the barrel of the syringe in a SureClick
autoinjector – glass syringe with an air gap (test SC-178). . . 70 3.15 Growth and collapse of a bubble in the cone area of a glass syringe
when an air gap is present (test SC-0137). . . 73 3.16 Growth and collapse of bubbles along the barrel of a glass syringe
when an air gap is present (test SC-0137). . . 74 3.17 Position and velocity of the moving components in a SureClick
au-toinjector – plastic syringe without an air gap (test SC-200). . . 76 3.18 Liquid pressure in a SureClick autoinjector – plastic syringe without
an air gap (test SC-200). . . 77 3.19 Hoop and axial strains on the barrel of the syringe in a SureClick
autoinjector – plastic syringe without an air gap (test SC-200). . . 77 3.20 Position and velocity of the moving components in a SureClick
au-toinjector – plastic syringe with an air gap (test SC-201). . . 80 3.21 Liquid pressure in a SureClick autoinjector – plastic syringe with an
air gap (test SC-201). . . 81 3.22 Hoop and axial strains on the barrel of the syringe in a SureClick
autoinjector – plastic syringe with an air gap (test SC-201). . . 81 3.23 Motion of the driving rod, the plunger-stopper and the syringe (plastic
vs glass syringe). . . 83 3.24 Position and velocity of the moving components in a SureClick
au-toinjector with an empty syringe. . . 85 4.1 Schematic of the static, large-scale model autoinjector experimental
setup. . . 88 4.2 Schematic of the base fixtures used with the static, large-scale model
xiii
4.3 LS-DYNA model of the static, large-scale model autoinjector. . . 92 4.4 Pressure at the bottom end for case 1 of the static, large-scale model
autoinjector experiments (test GG-0030). . . 96 4.5 Wave dynamics in the static, large-scale model autoinjector test setup
(adapted fromInaba and Shepherd (2010)with permission). . . 96 4.6 Hoop and axial strains for case 1 of the static, large-scale model
autoinjector experiments (test GG-0030). . . 98 4.7 Motion of the buffer and the projectile with a space-time pressure plot
(LS-DYNA) for case 1 of the static, large-scale model autoinjector experiments (test GG-0030). . . 99 4.8 Pressure at the bottom end for case 2 of the static, large-scale model
autoinjector experiments (test GG-0240). . . 101 4.9 Sequence of images showing distributed cavitation for case 2b of the
static, large-scale model autoinjector experiments (test GG-0215). . . 102 4.10 Pressure at the bottom end for case 3 of the static, large-scale model
autoinjector experiments (test GG-0033). . . 104 4.11 Motion of the buffer and the projectile with a space-time pressure plot
(LS-DYNA) for case 3 of the static, large-scale model autoinjector experiments (test GG-0033). . . 105 4.12 Pressure at the bottom end for case 4 of the static, large-scale model
autoinjector experiments (test GG-0034). . . 106 4.13 Hoop strains for case 4 of the static, large-scale model autoinjector
experiments (test GG-0034). . . 107 4.14 Motion of the buffer and the projectile with a space-time pressure plot
(LS-DYNA) for case 4 of the static, large-scale model autoinjector experiments (test GG-0034). . . 107 4.15 Pressure at the bottom end for case 5 of the static, large-scale model
autoinjector experiments (test GG-0099). . . 109 4.16 Sequence of images showing cavitation at the tip of the cone for tests
performed with a large air gap (test GG-0235). . . 111 4.17 Schematic of the dynamic, large-scale model autoinjector
experimen-tal setup. . . 114 4.18 Schematic of the decelerators used to stop the syringe in the dynamic,
4.19 LS-DYNA model used to simulate the transient events created by the impact of the reversed outer projectile on the buffer of the syringe in the dynamic, large-scale model autoinjector. . . 118 4.20 LS-DYNA model used to simulate the transient events created by
the deceleration of the syringe in the dynamic, large-scale model autoinjector. . . 119 4.21 Velocity of the syringe and the buffer for case 6 of the dynamic,
large-scale model autoinjector experiments (test LS-0353). . . 121 4.22 Pressure at the bottom wall for case 6 of the dynamic, large-scale
model autoinjector experiments (test LS-0353). . . 122 4.23 Reflection of a pressure pulse on an accelerated, rigid wall. . . 123 4.24 Hoop and axial strains for case 6 of the dynamic, large-scale model
autoinjector experiments (test LS-0353). . . 126 4.25 Peak pressure in the syringe tip as a function of initial air gap size. The
outer projectile impacts on the buffer of the syringe in the dynamic, large-scale model autoinjector. . . 128 4.26 Schematic of the simplified model of the isentropic compression of
an air gap. . . 128 4.27 Peak air gap pressure and air gap compression time obtained with the
simplified model. . . 129 4.28 Velocity of the syringe and the buffer for case 7 of the dynamic,
large-scale model autoinjector experiments (test LS-0345). . . 131 4.29 Pressure at the bottom wall for case 7 of the dynamic, large-scale
model autoinjector experiments (test LS-0345). . . 132 4.30 Hoop and axial strains for case 7 of the dynamic, large-scale model
autoinjector experiments (test LS-0345). . . 134 4.31 Pressure at the bottom wall for case 8 of the dynamic, large-scale
model autoinjector experiments (test LS-0208). . . 135 4.32 Velocity of the syringe and the buffer for case 9 of the dynamic,
large-scale model autoinjector experiments (test LS-0329). . . 136 4.33 Pressure at the bottom wall for case 9 of the dynamic, large-scale
model autoinjector experiments (test LS-0329). . . 136 4.34 Velocity of the syringe for case 10 of the dynamic, large-scale model
autoinjector experiments (test LS-0322). . . 138 4.35 Pressure at the bottom wall for case 10 of the dynamic, large-scale
xv
4.36 Hoop and axial strains for case 10 of the dynamic, large-scale model autoinjector experiments (test LS-0322). . . 142 4.37 Pressure at the bottom wall for case 10b of the dynamic, large-scale
model autoinjector experiments. . . 144 4.38 Sequence of images showing the cavitation event at the bottom of the
syringe for test 10b of the dynamic, large-scale model autoinjector experiments (test LS-0382). . . 145 4.39 Peak pressure in the syringe tip as a function of initial air gap size.
The outer projectile impacts on the syringe wall. This is for the dynamic, large-scale model autoinjector test setup with a flat tip. . . . 146 4.40 Final stage of bubble collapse for tests cases 10b and 10c performed
without a buffer. This is for the dynamic, large-scale model autoinjector.147 4.41 Pressure at the bottom wall for case 11 of the dynamic, large-scale
model autoinjector experiments (test LS-0318). . . 148 4.42 Peak pressure in the syringe tip as a function of initial air gap size.
The outer projectile impacts on the syringe wall. This is for the dynamic, large-scale model autoinjector test setup with a conical tip. . 150 4.43 Velocity of the syringe for case 12 of the dynamic, large-scale model
autoinjector experiments (test LS-0263). . . 150 4.44 Pressure at the bottom wall for case 12 of the dynamic, large-scale
model autoinjector experiments (test LS-0263). . . 151 4.45 Hoop and axial strains for case 12 of the dynamic, large-scale model
autoinjector experiments (test LS-0263). . . 152 4.46 Pressure at the bottom wall for case 12b of the dynamic, large-scale
model autoinjector experiments (test LS-0402). . . 153 4.47 Sequence of images showing the cavitation event at the bottom of the
syringe for test 12b of the dynamic, large-scale model autoinjector experiments (test LS-0402). . . 154 4.48 Final stage of bubble collapse for test 12b of the dynamic, large-scale
model autoinjector experiments (test LS-0402). . . 154 4.49 Velocity of the syringe for case 13 of the dynamic, large-scale model
autoinjector experiments (test LS-0296). . . 157 4.50 Sequence of images showing the motion of the projectile, the buffer
4.51 Pressure at the bottom wall for case 13 of the dynamic, large-scale model autoinjector experiments (test LS-0296). . . 159 4.52 Hoop and axial strains for case 13 of the dynamic, large-scale model
autoinjector experiments (test LS-0296). . . 160 4.53 Schematic of the wave mechanics in the syringe wall and the liquid
column during and after the syringe deceleration for case 13. . . 161 4.54 Sequence of images of the cavitation events for case 13b of the
dynamic, large-scale model autoinjector experiments (test LS-0417). . 164 4.55 Velocity of the syringe for case 14 of the dynamic, large-scale model
autoinjector experiments (test LS-0319). . . 164 4.56 Pressure at the bottom wall for case 14 of the dynamic, large-scale
model autoinjector experiments (test LS-0319). . . 165 4.57 Box plot of the peak pressure at the flat wall of the tip during the
rapid deceleration of the syringe in the dynamic, large-scale model autoinjector experiments. . . 166 4.58 Velocity of the syringe for case 15 of the dynamic, large-scale model
autoinjector experiments (test LS-0227). . . 167 4.59 Pressure at the bottom wall for case 15 of the dynamic, large-scale
model autoinjector experiments (test LS-0227). . . 168 5.1 Cross-sectional view of the geometry used in the numerical
simula-tions on shock focusing in a straight cone. . . 171 5.2 Amplification of a sharp pressure wave entering a straight, rigid cone
with a half-angle of 30 degrees. . . 175 5.3 Pressure history on the cone axis and the tip wall for a sharp pressure
wave entering a straight, rigid cone with a half-angle of 30 degrees. . 176 5.4 Evolution of the amplification factor as a function of the half-angleα. 178 5.5 Spherical convergence of an acoustic wave. . . 178 5.6 Evolution of the amplification factor as a function of the normalized
rise time of the incident pressure wave. . . 180 5.7 History of the average tip pressure for a pressure wave entering a
straight, rigid cone with a half-angle of 30 degrees. The average tip pressure is shown for different rise times of the incident wave. . . 181 5.8 Evolution of the amplification factor of the cone as a function of the
reflection coefficient. . . 183 5.9 Amplification of a sharp pressure wave entering the cone of a BD
xvii
5.10 Pressure history in the narrower section of the syringe cone. . . 186 5.11 LS-DYNA syringe model of a 1 ml BD Hypack syringe. . . 188 5.12 Schematic representation of the boundary conditions used in the
LS-DYNA numerical model. . . 189 5.13 Maximum principal stress in the syringe wall for a constant and
uniform liquid pressure of 1 MPa. The syringe is supported at the flange. . . 190 5.14 Stresses at three different stations in the syringe wall for a constant
and uniform liquid pressure. The syringe is supported at the flange. . 191 5.15 Stresses along the inner and the outer surface of the syringe for a
constant and uniform liquid pressure. The syringe is supported at the flange. . . 193 5.16 Maximum principal stress in the syringe wall for a constant and
uniform liquid pressure of 1 MPa. The syringe is supported at the shoulder. . . 195 5.17 Stresses at three different stations in the syringe wall for a constant
and uniform liquid pressure. The syringe is supported at the shoulder. 196 5.18 Stresses along the inner and the outer surface of the syringe for a
constant and uniform liquid pressure. The syringe is supported at the shoulder. . . 197 5.19 Maximum pressure along the inner surface of the syringe. The
sy-ringe is supported at the flange, and dynamically pressurized with a sharp pressure wave. . . 200 5.20 Stresses along the inner and the outer surface of the syringe. The
syringe is supported at the flange, and dynamically pressurized with a sharp pressure wave. . . 201 5.21 Maximum pressure along the inner surface of the syringe. The
sy-ringe is supported at the shoulder, and dynamically pressurized with a sharp pressure wave. . . 202 5.22 Stresses along the inner and the outer surface of the syringe. The
syringe is supported at the shoulder, and dynamically pressurized with a sharp pressure wave. . . 204 5.23 Maximum pressure along the inner surface of the syringe. The
5.24 Stresses along the inner and the outer surface of the syringe. The syringe and its liquid content are initially traveling downward, and the syringe is rapidly decelerated using a support at the flange. . . 208 5.25 Maximum pressure along the inner surface of the syringe. The
sy-ringe and its liquid content are initially traveling downward, and the syringe is rapidly decelerated using a support at the shoulder. . . 209 5.26 Stresses along the inner and the outer surface of the syringe. The
syringe and its liquid content are initially traveling downward, and the syringe is rapidly decelerated using a support at the shoulder. . . . 210 5.27 Schematic of the Ram-Rod testing facility used to construct Weibull
curves of various pre-filled syringes. . . 212 5.28 Probability of failure as a function of the peak magnitude of the
pressure wave created under the plunger-stopper (Weibull curve) for a 1 mL BD Hypack pre-filled syringe. . . 213 5.29 Probability of failure as a function of the peak magnitude of the
maximum principal stress in the syringe shoulder (Weibull curve) for a 1 mL BD Hypack pre-filled syringe. The main plot uses double logarithmic coordinates so that the regime of small failure probability is visible. . . 214 5.30 Initial pressure source (left & center) and spherical shock wave (right)
used in the LS-DYNA simulations to predict wall stresses. . . 215 5.31 Pressure and stresses along the inner surface of the syringe. The
pressure and stresses are created by a spherical pressure wave similar to the wave created by a bubble collapsing in the cone. . . 217 6.1 Geometry used in the numerical simulations of a bubble collapse
inside a straight cone. . . 222 6.2 Effect of the grid resolution on the evolution of bubble volume and
peak pressure on the wall. The grid resolutions are reported in Table 6.1.223 6.3 Collapse time as a function of the initial location of the bubble and
the half-angle of the cone. . . 225 6.4 Evolution of the bubble volume during collapse in a 45-degree cone. . 227 6.5 Shock-induced collapse of a bubble initially located atΛ/R0= 2.8 in
a 45-degree cone. . . 228 6.6 Placement of the bubble in a cone with Λ/R0 = 1 for a small and a
xix
6.7 Peak wall pressure as a function of the initial location of the bubble
and the half-angle of the cone. . . 232
6.8 Peak wall pressure when no bubble is present in the cone (i.e., effect of shock focusing alone). . . 234
6.9 Amplification of the peak wall pressure due to the collapse of a bubble inside the cone. . . 235
6.10 Initial configuration used in the numerical simulations performed with MFC and ECOGEN. . . 237
6.11 Collapse of a bubble inside the cone of a pre-filled syringe. Results obtained using ECOGEN. . . 239
6.12 Evolution of the bubble volume during collapse in the cone of a syringe. Results obtained using ECOGEN. . . 240
6.13 Evolution of the peak pressure during collapse in the cone of a syringe. Results obtained using ECOGEN. . . 241
7.1 Schematic of a SureClick autoinjector with damping material. . . 246
7.2 Velocity of the moving components in a SureClick autoinjector with damping material. . . 247
7.3 Liquid pressure in a SureClick autoinjector with damping material. . 248
7.4 Hoop and axial strains on the barrel of the syringe in a SureClick autoinjector with damping material. . . 248
7.5 Syringe model acceleration with memory foam between the outer projectile and the syringe wall. . . 251
A.1 Characteristic directions at a point in the flow. . . 272
A.2 Geometry of characteristics. . . 273
A.3 Network of characteristics in the acoustic limit. . . 277
A.4 Schematic representing the idea behind the DVCM model. . . 281
LIST OF TABLES
Number Page
2.1 Reflection of pressure/stress waves at the interface between two media – magnitude of the reflected∆Pr and transmitted waves∆Pt. . . 16 2.2 Density and sound speed of fluids and solids which are relevant to
this thesis. . . 16 2.3 Axial stress and velocity within regions 0 to 7 identified in Figure 2.13. 30 3.1 Estimated physical and geometrical properties of a BD HyPack and
a Daikyo Crystal Zenith pre-filled syringe. . . 58 4.1 Axial location of the pressure transducers in the static, large-scale
model autoinjector. . . 91 4.2 Axial location of the strain gauges in the static, large-scale model
autoinjector. . . 91 4.3 Parameters used in the equations of state used in the LS-DYNA model. 93 4.4 Rise time of the second incident wave for case 4 of the static,
large-scale model autoinjector experiments (test GG-0034). . . 108 4.5 Nominal axial location of the strain gauges mounted on the outer
surface of the syringe used in the dynamic, large-scale model autoin-jector experimental setup. . . 117 6.1 Grid resolutions used to investigate the effect of the mesh on the
shock-induced collapse of a bubble in the vicinity of a flat wall. . . . 224 6.2 Axial and radial location of the vertices in the simplified syringe
geometry used in ECOGEN and MFC. . . 237 7.1 Experimental verification of the maximum allowable model syringe
acceleration to eliminate cavitation – large-scale model syringe with a flat tip. . . 251 7.2 Experimental verification of the maximum allowable model syringe
acceleration to eliminate cavitation – large-scale model syringe with a conical tip. . . 252 B.1 Test matrix of the successfulin situexperiments. . . 288 B.2 Test matrix for the experiments performed with the static, large-scale
model autoinjector. . . 295 B.3 Test matrix for the experiments performed with the dynamic,
xxi
NOMENCLATURE
Greek symbols
α Void fraction (–) or half-angle (degree)
β Fluid structure interaction coupling parameter (–)
δ Air gap size (mm) ∆( ) Variation of
Strain (–)
γ Ratio of the specific heats (–)
Λ Minimum distance between the bubble center and the cone wall (mm)
λ Amplification factor (–) or relative position of the inner projectile within the outer projectile (mm)
µ Dynamic viscosity of the syringe content (P or cP)
ν Poisson’s ratio (–)
φ Acoustic potential (m2/s)
ψ Integration weighting factor (–)
ρ Density (kg/m3)
σ Stress (MPa)
τ Non-dimensional time (–)
τc Non-dimensional bubble collapse time (–)
ζ Axial coordinate (stationary frame) (mm or m)
Roman (uppercase)
A Cross-sectional area (mm2or m2) C±,C0 Characteristic directions (–) D Diameter (mm)
E Young’s modulus of elasticity (GPa)
F Syringeability or force applied on the plunger-stopper (N) H Distance between the bubble center and the tip of the cone (mm) K Bulk modulus (GPa)
L Axial length (mm)
P Pressure (Pa, kPa or MPa)
Ps Pressure downstream of a shock wave (MPa) Pvap Vapor pressure (Pa)
Q,R Riemann invariants (m/s)
R Radius (mm)
V Volume (mL) or velocity (m/s) Vcav Volume of vapor cavities (m−3)
Z Acoustic impedance (kg m−1s−2)
Roman (lowercase)
a Acceleration (m/s2) c Sound speed (m/s) cK Korteweg speed (m/s)
dtip,i Diameter of the truncated tip of a straight cone (mm) e Internal energy (J)
f Friction force (N)
h Wall thickness (m or mm) m Mass (kg or g)
r Radial coordinate (m or mm) s Entropy (J/K)
t Time (s or ms) u Velocity (m/s)
x,y,z Spatial coordinates (m or mm)
Subscripts
0 Ambient or initial condition
θ Hoop
b Syringe barrel or bubble b f Buffer
c Cone
dr Driving rod gap Air gap
i Inner or incident
l Liquid or syringe liquid content
n Needle
o Outer
ps Plunger-stopper qs Quasi-static
r Radial, radial coordinate or reflected s Syringe or solid
t Transmitted w Wall
1
C h a p t e r 1
INTRODUCTION
1.1 Motivation
Autoinjectors were first developed and introduced for military application in the 1970s for the delivery of emergency drugs in the field of combat (Lange and Thomp-son, 2013). Today, autoinjectors are also used by civilians for emergency purposes
(e.g., epinephrine), but they are also extensively used for long-term treatments re-quiring the frequent subcutaneous injection of biopharmaceuticals (e.g., etanercept, adalimumab, and darbepoetin alfa) (Akers, 2010).
Even if autoinjectors are already ubiquitous in the pharmaceutical industry, the market for those devices is still continuously growing at a very fast pace (Akers, 2010;Thompson, 2006). According to some recent market studies (Future Market
Insights, 2017) the Compound Annual Growth Rate (CAGR) of the autoinjector
industry could exceed 15% for the next decade, and over US$6.8G worth of au-toinjectors could be annually manufactured by the year 2026. Autoinjector devices will therefore receive significant attention for years to come, and we can expect an increasing number of parenteral drugs to be administered using autoinjector devices.
The continuously increasing demand for autoinjectors is attributed to a variety of factors. From a technical standpoint, there is a clear trend toward biological drugs which cannot be administered orally, and the relative importance of those drugs is expected to grow further (Lange and Thompson, 2013;Thompson, 2006;Thompson and Lange, 2013). Oral delivery of biological drugs is often not possible because
they tend to degrade substantially in the gastrointestinal tract. Furthermore, oral delivery generally results in the poor absorption of the molecules into the system. For those reasons, the preferred route of administration is injection (Singh, Singh, and Lillard, 2008). There are multiple types of injection, such as intravenous (IV), subcunatenous (SC), and intramuscular (IM). Only the subcutaneous delivery of injectables is considered herein.
and improve the quality and efficacy of treatments. Some of the most important and recurrent reasons cited to explain the undeniable success and the large popularity of autoinjectors are the compactness of the device, its ease of use, an improved dosage accuracy, and the increased treatment adherence. (Akers, 2010; Cadranel et al., 2007;French and Collins, 2010;Limmroth and Gerbershagen, 2014;Pozzilli
et al., 2011;Schiff et al., 2014;Shire, Shahrokh, and Liu, 2004). Another advantage
is that autoinjectors generally reduce the number of required visits to a health-care provider because they are typically approved for use at home (Turner and Balu-Iyer, 2018).
There are mechanical, physiological, and human factor constraints which need to be accounted for during the design and development of subcutaneous autoinjector devices. The volume of a subcutaneous injection is generally limited to approxi-mately 1.0-1.5 mL because subcutaneous tissues can only absorb a finite quantity of liquid, and because larger injection volumes generally create more discomfort and pain (Adler, 2012; Arendt-Nielsen, Egekvist, and Bjerring, 2006; French and Collins, 2010;Jorgensen et al., 1996;Shire, Shahrokh, and Liu, 2004;Yadav, Shire,
and Kalonia, 2010).1 For this reason, typical autoinjectors currently available on the market use a 1 mL syringe (French and Collins, 2010;Stout and Vilivalam, 2009). Furthermore, the maximum injection time a patient is willing to tolerate is typically around 10 to 15 seconds (French and Collins, 2010;Fry, 2014). Lastly, larger diam-eter needles are typically associated with more painful injections (Arendt-Nielsen, Egekvist, and Bjerring, 2006;Harvinder and Prausnitz, 2007), meaning that small
diameter needles are preferred.
Monoclonal antibodies are one example of injectables which are often delivered subcutaneously. Monoclonal antibodies generally have a low potency, meaning that large doses have to be delivered (Warne, 2011; Yadav, Shire, and Kalonia, 2010). Figure 1.1is a plot of the concentration of monoclonal antibodies approved by the FDA between 1996 and 2017. Figure 1.1 indicates there is a trend toward more concentrated drug solutions. The upper limit of drug concentrations appears to be increasing over time, and there is a substantial spread in the concentrations of newly developed drug solutions. The increase in drug concentration is partially attributed to the limited injection volume; because the injection volume is limited to 1-1.5 mL, as explained above, controlling the drug dosage is primarily achieved through variations in the drug concentration.
1As highlighted byHeise et al. (2014), published data on the relation between pain and injection
3
1995 2000 2005 2010 2015 2020
0 50 100 150 200 250 300
Figure 1.1: Concentration of FDA approved monoclonal antibodies over the years. Compilation prepared by Amgen (private communication). Data obtained from www.newdrugapprovals.comandwww.fda.gov.
There is a direct correlation between the concentration and the viscosity of drug solutions. As expected, a more concentrated drug solution tends to be more viscous. The viscosity of drug solutions can increase much faster than linearly with con-centration, as is the case for solutions containing monoclonal antibodies (Li et al., 2014; Yadav, Shire, and Kalonia, 2010). By extension, Figure 1.1 indicates the upper bound on the viscosity of drug solutions is increasing over time.
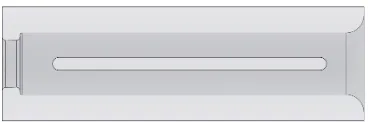
Figure 1.2: Flow in the barrel and the needle of a syringe resulting from a force F applied on the plunger-stopper.
The force required to extrude a volumeV of drug solution within a timeT can be estimated by assuming a steady Poiseuille flow through the syringe needle (Kundu, Cohen, and Dowling, 2012). The required forceF, which is also commonly called
syringeability, is the force which must be applied on the plunger-stopper or piston in order to extrude the drug solution (seeFigure 1.2):
F = 32µLn D
2
b,i D4n,i !
V T
, (1.1)
where µ is the viscosity of the drug solution, Db,i is the inner diameter of the syringe’s barrel, andDn,i and Lnare respectively the inner diameter and the length of the needle. This equation assumes no friction between the plunger-stopper and the syringe barrel, which is not true in general.
Equation 1.1shows that for a given combination of syringe, needle, injection time and volume, the required forceF increases linearly with viscosity. This has signif-icant implications for device design for high concentration drug formulations with high viscosities. The constraints previously mentioned on injection time, injection volume, and needle size mean that increasing the forceFis the only practical alter-native to inject newly developed drug solutions with viscosities as large as 25-30 cP (French and Collins, 2010). However, applying an increasingly large force F on the plunger-stopper to extrude the drug solution comes with the risk of damaging the autoinjector device due to the large pressures and stresses this produces in the syringe. The jerking motion of the autoinjector created by large spring forces could also affect negatively the user’s experience.
5
used to power the autoinjector. When this is the case, the large spring forces can result in impact velocities and accelerations/decelerations which are large enough to cause failure of the device (Fry, 2014;Stout and Vilivalam, 2009). Peak pressures in excess of 6.9 MPa are believed to exist within certain autoinjectors upon actuation (Schiff et al., 2014).
Although the potential issues associated with the delivery of very viscous drug solu-tions using autoinjectors have been acknowledged in the literature, no detailed study of the pressure and stress transients created upon actuation has been published. It is possible that some aspects of the pressure and stress transients in autoinjector devices have been studied within the pharmaceutical industry, but those studies have not been published to be part of public knowledge. Some authors previously acknowledged there is a lack of detailed understanding of how the key design pa-rameters affect the device performances (Wilkins and Simpson, 2012), and further research and development is needed to extend the range of operation of autoin-jectors with respect to viscosity (Adler, 2012). There is also a need for physical measurements on actual devices (Thompson and Lange, 2013).
More recently, some pharmaceutical companies started to experience reliability issues with autoinjector devices under development for the delivery of very viscous drug solutions. This is the case of Amgen, the sponsor of this research project, who adapted an autoinjector device they had successfully used in the past. Adaptation of the device was necessary to make the autoinjector usable for the delivery of a newer, more viscous parenteral drug solution. The primary modification consisted of stiffening the spring mounted inside the device to increase the force F applied on the plunger-stopper. This modification resulted in a low but detectable failure rate of about 30 ppm (parts per million) of the glass syringes during clinical trials (private communication). A 30 ppm failure rate may appear as negligible, but this is far from being the case. A 30 ppm failure rate is generally sufficiently large for regulators to become concerned.
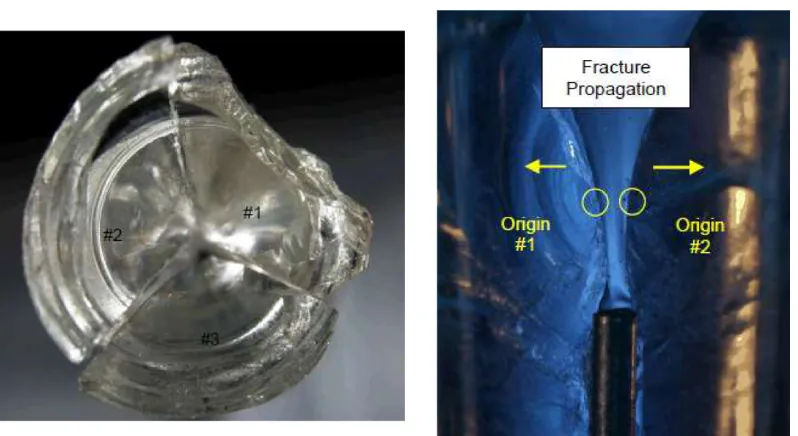
Figure 1.3: Example of a broken glass syringe. Failure originated on the inner surface of the cone area due to an excessive hoop stress. Reproduced fromVeilleux, Jazayeri, et al. (2017)with permission.
knowledge and understanding of the mechanics of autoinjector devices could not explain the source of the large hoop stress and liquid pressure.2
1.2 Objectives and Structure
The unexplained cone failures and the lack of understanding of the dynamic events in an autoinjector has led to this investigation of the pressure and stress transients in the device during actuation. To the author’s knowledge this is the first time an extensive study of the pressure and stress transients in an autoinjector device is performed and published. The main objectives of the present work can be summarized as follows:
1. to explain and characterize the dynamic events taking place in an autoinjector during actuation, and to investigate the resulting pressure and stress transients;
2. to develop novel experimental methods and numerical models which can be used to explain, understand, and quantify the pressure and stress transients during actuation;
3. to understand if and how the presence, location, and size of an air gap in the syringe can affect the pressure and stress transients;
7
4. to develop a better understanding of transient cavitation and bubble dynamics within the cone area of the syringe;
5. to investigate and understand the effect of relevant design parameters, such as syringe material and syringe lubrication, on the pressure and stress transients;
6. to determine more precisely the root cause of the large hoop stress in the cone which caused the failures observed by Amgen during clinical trials;
7. to propose, investigate and assess the efficacy of potential ways to mitigate the pressure and stress transients.
The overall goal of this research is todevelop a better understanding of the failure modes of autoinjector devices in order to improve upon the current designs, and to
make autoinjectors more robust and reliable. Ultimately, it is the author’s hope that this deeper understanding of the mechanics of autoinjectors willmake it possible to use those devices to safely inject the increasingly viscous drug solutions which are
currently under development.
This thesis is structured as follows. The actuation sequence of typical spring-actuated autoinjector devices is introduced in Chapter 2. The various dynamic events which can occur and potentially create a pressure and stress transient are also introduced in an idealized, theoretical context. Simple models are developed and used to explain in simple terms the effect of the various transient events.
The novel experimental methods developed to measure the pressure and stress tran-sients in a minimally modified autoinjector during actuation are described in Chap-ter 3. Typical results obtained using the in situmethods are shown and discussed. The results are used to further illustrate how the dynamic events which occur upon actuation can create deleterious pressure and stress transients in the device. Both glass and plastic syringes are investigated in this chapter to better understand the effect of syringe material and lubrication on the transient events.
part of this chapter is on the experiments performed with a scaled-up model which includes the translational motion of the syringe. This setup is particularly useful to investigate the effect of the large acceleration and deceleration of the syringe during actuation. In particular, this setup makes it possible to better understand the role of the large syringe acceleration along with the effect of the cone area on the cavitation events which can occur inside the syringe.
Numerical results obtained using the LS-DYNA finite-element analysis platform are shown and discussed inChapter 5. LS-DYNA is used to study numerically the shock focusing effect resulting in the substantial amplification of pressure waves entering the cone area of the syringe. LS-DYNA is also used to predict the liquid pressure and the wall stresses during the different dynamic events occurring during autoinjector actuation. The numerical simulations are particularly useful to identify the root cause of the failures observed by Amgen during clinical trials.
Chapter 6is about the shock-induced collapse of a bubble inside a cone. Numerical simulations are performed with two different in-house codes to determine if and how the collapse of a bubble inside the cone region of a syringe is different from the collapse of a bubble in the vicinity of a flat-wall or in a free field. The results are particularly useful to determine whether or not a cavitation event within the cone area of the syringe could cause failure of the glass.
Simple ideas and device modifications which can be used to mitigate the pressure and stress transients upon actuation are introduced in Chapter 7. The efficacy of some of the ideas proposed in this chapter is assessed experimentally.
9
C h a p t e r 2
DYNAMIC EVENTS IN AUTOINJECTOR DEVICES
There is a large variety of autoinjector designs available on the market. This thesis focuses on spring-actuated autoinjector devices which are responsible for two main functions:
1. insertion of the needle into the patient;
2. delivery of the medicament to the patient.
The actuation sequence of a typical spring-actuated autoinjector device is discussed in the first section of this chapter. The second section discusses the dynamic events along with the resulting pressure and stress transients in the syringe caused by device actuation. The third and last section introduces the SureClick autoinjector, a device which is extensively discussed in this thesis.
The primary objective of this chapter is to introduce the origin and essence of each transient event in a generalized context, and to describe how each event could potentially cause failure of a syringe system. Discussions of the various scientific challenges one can expect to encounter in developing a full understanding of the transient events is presented along the way. The content of this chapter is paramount to the remainder of this thesis; subsequent chapters build upon the knowledge introduced herein.
2.1 Actuation Sequence of a Typical Spring-Actuated Autoinjector
Figure 2.1 is a simplified schematic of the internal components and actuation se-quence of a typical spring-actuated autoinjector device. Note that only the key components relevant to the present discussion are represented for simplicity.
11
(a) BD HyPak – pre-filled syringe with a pre-attached needle.
(b) BD HyLok – pre-filled syringe without a pre-attached needle.
Figure 2.2: Examples of pre-filled, glass syringes from BD. Reproduced from http://drugdeliverysystems.bd.com.
plastic, but most autoinjector devices currently available on the market make use of glass syringes. A review paper bySacha, Rogers, and Miller (2015)provides more information on pre-filled syringes.
A needle, as shown inFigure 2.1, is attached to the syringe. The root of the needle is located at the bottom end or tip of the syringe. The needle can be pre-attached to the syringe in the factory, as shown inFigure 2.2a. In other cases the user needs to attach the needle to the syringe prior to using the autoinjector device, as shown in Figure 2.2b(Sacha, Rogers, and Miller, 2015).
The top end of the syringe typically has a flange. The internal and external geometry of the syringe can vary largely from one model to the other, especially in the vicinity of the tip. In some syringes the transition from the barrel to the needle is achieved with a smooth converging section, as depicted in Figure 2.1. In other cases the syringe ends with a flat wall which has a narrow channel at the center for the liquid to enter the needle, similar to the schematic shown inFigure 1.2. In all cases the tip of the syringe is sealed during storage. Adequate sealing is necessary to prevent the ingress of contaminants toward the inside of the syringe.
The syringe is sealed at its other end using a plunger-stopper. This is depicted in Figures2.1 and2.2. The plunger-stopper is typically fabricated with an elastomer, and it serves two important purposes (Sacha, Rogers, and Miller, 2015):
1. it seals the syringe content during storage to avoid drug contamination;
Figure 2.3: Schematic of a pre-filled syringe in a vertical, tip-down configuration with (left) and without (right) an air gap.
It is common for the syringe to not only contain the liquid drug solution, but to also contain an air gap or headspace (Sacha, Rogers, and Miller, 2015). This is shown in Figures2.1and2.3for the case of a syringe in a vertical, tip-down configuration. The presence of an air gap typically results from the syringe filling method. In some cases the presence of an air gap is a necessity, as is the case for drug solutions which contain suspensions. The air gap has important consequences on the transient events during device actuation. This is discussed further in the remainder of this thesis.
There are different means of supporting the syringe within the device. One approach is to support the syringe using its flange. Another approach is to support the syringe using the shoulder located in the vicinity of the tip. Sometimes a combination of both is used. In the configuration shown in Figure 2.1, the shoulder is used to decelerate the syringe, and the flange is used to accelerate the syringe by the means of a needle insertion mechanism.
13
a spring (not shown), and a driving rod. The spring is often contained within the driving rod, and the spring force is applied directly on the tip of the driving rod which, in turn, applies a force on the plunger-stopper of the syringe. The needle insertion mechanism is initially attached to the driving rod.
The actuation sequence shown inFigure 2.1is now discussed using panels A through D. In panel A the device is in its initial state, just before actuation: the unshielded needle is attached to the syringe tip, the device bottom features are in contact with the patient’s skin, and the pre-filled syringe is mounted inside the device and sealed by a plunger-stopper.
In panel B the device has been activated, and the spring-actuated driving rod is moving forward. The insertion mechanism attached to the driving rod is in contact with the flange of the syringe, and this accelerates the syringe assembly forward. The forward motion of the syringe inserts the needle into the patient. The syringe is decelerated to a complete stop once the needle has reached the adequate depth for injection. The deceleration of the syringe results from the contact of the syringe shoulder on a device bottom feature which is part of the enclosing shell (not shown).
In panel C the driving rod is moving independently from the insertion mechanism, and it impacts on the plunger-stopper. The impact velocity and the force exerted by the spring-actuated driving rod on the plunger-stopper pressurizes the syringe, and this forces the medicament to be extruded through the needle and into the patient, as shown in panel D.
2.2 Transient Events During Autoinjector Actuation
In the sequence of events described in the previous section, there are three dynamic events which are capable of producing deleterious pressure and stress transients during device actuation:
• event 1: the syringe acceleration;
• event 2: the syringe deceleration;
• event 3: the impact of the spring-actuated driving rod on the plunger-stopper.
assumptions are introduced when appropriate. The objective of this section is to provide the reader with basic information about the physics at play during the transient events, but without getting into all the intricacies of the dynamic events. The next several chapters build upon the basic knowledge introduced herein.
2.2.1 Acoustics and Wave Dynamics
Before diving into the discussion of the dynamic events it is necessary to introduce or review a few concepts related to acoustics and wave dynamics. First and fore-most, acoustics is extensively used in this thesis, starting with the present chapter. Using acoustics is justified because the magnitude of motion u of the solid and fluid elements is small (i.e., less than 10 m/s) compared to the sound speed c of pressure/stress waves in the materials: u c. This is equivalent to saying that the peak magnitude of the pressure/stress waves created during the dynamic events is relatively weak. In the context of acoustics, a pressure/stress wave is weak if its magnitude∆Pis much smaller thanρc2, whereρandcare respectively the density and sound speed of the medium into which the pressure/stress wave propagates.
For a liquid with properties similar to that of water, ρc2 is well over 2 GPa. The value of ρc2is even larger for most solids. As it will later be seen, all pressure and stress waves considered in this thesis have peak magnitudes which remain below 100 MPa. Therefore,∆P ρc2, and using acoustics is justified.
Acoustic theory and the acoustic version of the method-of-characteristics are thor-oughly introduced inAppendix A. A cavitation model which can be used within the acoustic version of the method-of-characteristics is also described inAppendix A. The reader is urged to review this appendix if not entirely familiar with those con-cepts.
15
Figure 2.4: Reflection and transmission of pressure/stress waves at the interface between two media.
wave has formed and propagates from left to right in medium 2, and a reflected wave has formed and propagates from right to left in medium 1.
The magnitude of the transmitted (∆Pt) and the reflected (∆Pr) waves depends on the acoustic impedances Z = ρc of the two media. Enforcing compatibility at the interface (i.e., continuity of the pressure and velocity fields) yields (Pierce, 1989):
∆Pr =
Z2−Z1
Z2+Z1
∆Pi, (2.1)
and
∆Pt = ∆Pr +∆Pi . (2.2)
The general result expressed using Equations2.1and2.2can be specialized to a few cases which are relevant to the syringe situation. First, the case of a wave reflecting on a rigid wall is considered. Medium 2 is the rigid wall, and therefore it has an infinite acoustic impedance. Taking the limit of Equation 2.1for Z2 which tends
to infinity indicates that ∆Pr = ∆Pi: the incident wave is entirely reflected back into medium 1. This important result can also be obtained using the method-of-characteristics introduced inAppendix A.
Second, the case of a wave reflecting on a free surface is considered. The pressure at a free surface is constant. Therefore, the magnitude of the transmitted wave in medium 2 is zero. Equation 2.2 indicates that ∆Pr = −∆Pi: the incident wave is reflected into medium 1, but the sign of the reflected wave is changed. In other words, a compression wave reflecting on a free surface becomes a tension or rarefaction wave, and vice versa. The same result is obtained when taking the limit ofEquation 2.1for Z2which tends to zero. This important result can also be
obtained using the method-of-characteristics introduced inAppendix A.
Table 2.1: Reflection of pressure/stress waves at the interface between two media – magnitude of the reflected ∆Pr and transmitted waves ∆Pt. The reflection and transmission coefficients are calculated using Equations 2.1 and 2.2 and the data shown inTable 2.2.
Case Medium 1 Medium 2 ∆Pr/∆Pi ∆Pt/∆Pi
1 Arbitrary Rigid wall 1.00 2.00
2 Arbitrary Vacuum -1.00 0.00
3 Water Air -1.00 0.00
4 Water Glass 0.80 1.80
5 Water Aluminum 0.81 1.81
6 Water Polycarbonate 0.30 1.30
Table 2.2: Density and sound speed of fluids and solids which are relevant to this thesis.
Medium Density Sound speed Reference (kg/m3) (m/s)
Air 1.2 343 Shepherd and Inaba (2010)
Water 1000 1482 Shepherd and Inaba (2010)
Glass (pyrex) 2320 5640 Lide (1990)
Aluminum 2700 5100 Shepherd and Inaba (2010) Polycarbonate 1200 2300 Selfridge (1985)
∆Pt ≈0. This result is practically the same as the one previously obtained for the reflection of a wave on a free surface. This is because the acoustic impedance of air is negligible compared to the acoustic impedance of water. The three results obtained above are summarized inTable 2.1, along with a few more cases relevant to this thesis. The density and sound speed of fluids and solids which are relevant to this thesis are summarized inTable 2.2.
2.2.2 Event 1: Syringe Acceleration
17
The acceleration of the syringe occurs over a time scale of approximately 0.25-0.5 ms (seeChapter 3). Although the syringe is accelerated though the propagation of stress waves created at the contact between the insertion mechanism and the syringe wall, the syringe appears to be accelerated as a rigid body at this time scale. This is because the stress waves can complete several round trips (approximately 15 to 30) within the syringe wall in 0.25-0.5 ms. This has the effect of accelerating forward and equilibrating the motion of the solid elements, making the rigid body approximation adequate.
Although the syringe is rapidly accelerated when the driving rod and the insertion mechanism are released, the liquid contained inside the syringe is not; the accelera-tion of the liquid is lagging behind the acceleraaccelera-tion of the syringe. The explanaaccelera-tion for the delayed acceleration is provided later in this section and supported using results obtained with the method-of-characteristics. The delay in accelerating the liquid contained inside the syringe means that the liquid can’t keep up with the motion of the syringe, and a large cavity forms at the bottom of the container; the liquid begins to cavitate.
The mechanism for creating cavitation is schematically depicted using Figure 2.5 where a liquid-filled container with a flat bottom wall is used for illustration. The wave mechanics in the wall of the container is neglected; the container is assumed to be a rigid body. In frame A a large force is applied on the vertical wall of the container. The large force rapidly accelerates the container, but not the liquid. This is because the liquid, contrary to the solid wall, can’t sustain tensile forces.1
There is a loss of contact between the container and the liquid, and a cavity forms. The pressure inside the cavity forming at the bottom wall is sub-atmospheric, and tension waves are created in the liquid. The tension waves slowly but progressively accelerate the liquid. Later the growth of the cavity stops, the cavity then starts diminishing in size, and finally collapses with great intensity. The collapse of the cavity produces a relatively large and sharp pressure increase as the liquid impacts or crashes into the bottom wall of the container.
A qualitative example of the liquid pressure at the bottom of the container is shown in Figure 2.6. The large and momentarily increase in liquid pressure at collapse (time "D") creates stresses and strains in the wall of the container. One common example of this type of pressure and stress transient is when a beer bottle is broken upon its abrupt acceleration (Daily et al., 2012). The abrupt acceleration can be
Figure 2.5: Schematic of the growth and collapse of a cavity shortly after the abrupt acceleration of a liquid-filled syringe.
19
generated by holding the open bottle with one hand, and impacting on the lip of the bottle with the other hand. This practical example indicates the pressure and stress transients generated by the cavitation event created by the rapid acceleration of a container, even when using bare hands, is large enough to break glass.
The above explanation of the pressure and stress transient during the first event is rather intuitive. A more thorough explanation where the wave dynamics within the liquid is taken into account in a more consistent manner is presented below.
The rapid acceleration of the syringe is partially analogous to the well known gas dynamics problem of a piston withdrawal (Liepmann and Roshko, 2002), where the bottom wall of the syringe is analog to the piston. The rapid withdrawal of a piston from a tube filled with gas creates an expansion fan. In the present situation the tension waves originate at the bottom of the syringe in the vicinity of the cone area. This situation is represented inFigure 2.7using a space-time diagram. There are several assumptions behind this space-time diagram to simplify the discussion:
1. the interaction between the air gap and the plunger-stopper is neglected (i.e., the top end of the liquid column is assumed to be a free end where a constant pressure is maintained);
2. the bottom wall of the syringe is assumed to be flat and rigid (i.e., this is assumed to be a one dimensional problem);
3. the wave mechanics within the syringe wall is neglected (this assumption is justified by the much larger sound speed in the solid wall than in the liquid);
4. the liquid inside the syringe is an ideal fluid which can withstand tension without undergoing cavitation;
5. the acceleration of the syringe is assumed to be impulsive.
We now return to the space-time diagram shown in Figure 2.7. The bottom wall of the syringe is impulsively accelerated to a velocityu. Note thatu < 0, meaning the bottom wall is accelerated toward negativez. This results in the production of a tension wave which propagates upward in the syringe liquid content. The magnitude of the tension wave can be estimated using acoustic theory (seeAppendix A):
Figure 2.7: Space-time diagram of the pressure transient created by the impulsive acceleration of the syringe. The syringe contains an ideal fluid which can sustain tension.
where∆Pis the change in pressure, ρlis the density of the liquid, andclis the sound speed in the liquid. ∆Pis negative, which indicates the pressure wave created upon the acceleration of the syringe is a tension wave, not a compression wave.
The liquid pressure is initially P0 before the transient event begins (region 0).
The tension wave, upon its arrival at a given location, reduces the liquid pressure. The pressure after the passage of the tension wave (region 1) is P = P0+ ∆P or
P = P0− ρlcl|u|. The tension wave also accelerates the fluid downward, such that
the velocity of the liquid after the passage of the tension wave (region 1) is the same as the velocity of the bottom wall.
21
Figure 2.8: Space-time diagram of the pressure transient created by the impulsive acceleration of the syringe. The syringe contains an ideal fluid which can sustain tension. Results obtained with the method-of-characteristics. All results are non-dimensional.
The method-of-characteristics is used to predict the wave dynamics for this idealized scenario. The numerical methods described in Appendix A were implemented in Matlab to solve this problem. Figure 2.8is a space-time diagram of the computed liq-uid pressure; this is equivalent toFigure 2.7. The results shown are non-dimensional and were obtained withu/c = -3.33×10⁻³, a value which is representative of the magnitude of motion in a SureClick autoinjector device. The reverberations of the wave generated upon the impulsive acceleration of the syringe are again visible. The change of sign of the pressure wave at the free end is also noticeable, resulting in the non-dimensional pressure oscillating between -1 and 1.
if the pressure is reduced much faster than the liquid can evaporate because phase change is not an instantaneous process.
In most engineering applications where the time scales of interest are sufficiently long (milliseconds to seconds) it is typical to assume that cavitation begins as soon as the pressure is reduced at or below the vapor pressure of the liquid. This is the typical approach used, for example, when studying the transient events in piping systems (Wylie and Streeter, 1993). This is because most liquids used in engineering applications contain a sufficiently large number of nuclei for the dynamic and static delays to be much shorter than the characteristic time scale of interest. This is expected to be the case in a syringe, particularly because it is generally possible to observe with the naked eye air bubbles within the liquid drug solution prior to actuation of the autoinjector.
Cavitation occurs if the change in velocity of the syringe due to the impulsive acceleration is large enough, causing the pressure to drop below the vapor pressure. Equation 2.3is used to estimate how substantial the change in velocity of the syringe needs to be for cavitation to occur for a water column which is accelerated downward (u< 0), as previously assumed:
u < Pvap−P0
ρlcl . (2.4)
In the syringe of a SureClick, the pressure P0 before actuation is approximately
ambient pressure, or 101 kPa. The vapor pressure of water Pvap is approximately 2.3 kPa.2 With those values of P0 and Pvap, one obtains that u < -0.067 m/s is
expected to cause cavitation in liquid water. This result indicates there is no need for the change in velocity created by the impulsive acceleration of the syringe to be substantial for cavitation to occur, but only a modest downward motion will suffice. This explains why bare hands can be used to cause cavitation in a beer bottle, resulting in failure of the glass container (Daily et al., 2012).
A space-time diagram which illustrates this physical situation is shown inFigure 2.9. Upon the rapid acceleration of the syringe, a relatively weak tension wave forms in the liquid. No matter what the magnitude ofuis, the magnitude of the tension wave is ∆P = (Pvap− P0). This is because the pressure at the bottom of the container
inside the cavity which forms is maintained at Pvap, while the pressure at the
free-2The vapor pressure of the drug solution is not known, but we anticipate from Raoult’s law that
23
Figure 2.9: Space-time diagram of the pressure transient created by the impulsive acceleration of the syringe. The syringe contains a real fluid which does not sustain tension.
end is maintained at ambient pressure P0. This is significantly different from the
situation where cavitation is not allowed to occur (see Figures2.7and2.8).