OVERVIEW OF THE PROGRESS OF MICROFINANCE PROGRAMME IN INDIA
Ms. Parul Mittal
Assistant Professor, Department of Commerce,
KLP College, Rewari-123401
M. D. University, Rohtak (Hr.) India.
ABSTRACT
Throughout this paper, we tried to discuss the progress of microfinance programme in India. The main objective of microfinance programme is to provide financing facilities to those areas of thrust from where the generation of income and the employment may be takes place. There are certain principles and delivery models also through which the microfinance process takes place. In this regard, Self Help groups play a vital role. In this sector, many banks (public and private), NGOs, Cooperative banks have shown very keen interest. There are also many programmes/schemes through various agencies and departments are going on to promote the SHGs. In addition, it also provides the services of Micro savings, Micro insurance, Micro Leasing and the money transfer which are similar to banking services.
INTRODUCTION
Microfinance refers to loan; saving, insurance, transfer services and other financial products
targeted at low levels clients. Microfinance in India is mainly provided through Self-Help Groups
(SHGs), Microfinance Institutions (MFIs) and some other methodologies. The network of many
financial institutions like public and private sector commercial banks, co-operative banks,
regional rural banks (RRBs) and MFIs is used to provide microfinance services to the poor
people. Microfinance programme claims to provide the poor an access to capital and give them
opportunities to climb the economic ladder. Microfinance, by its name refers the whole journey of
financial and non financial services which covers skill up gradation, entrepreneurship
development rendered to the poor and needy people for the purpose of enabling them to overcome
poverty. The microfinance as a tool in poverty reduction, improving socio economic conditions of the poor and empowerment particularly in rural areas, has gained credence in development
dialogue the world over (Joy and Murthy, 2007). It is a method to meet the credit requirements in
rural areas. It puts credit, savings, insurance and other basic financial services like fund transfer
(Robert et al, 2004) within the reach of poor and low income household & their microenterprises.
After this, various programmes and schemes of Microfinance such as Swayamsiddha, Swa-shakti,
RMK, CAPART, SJSRY, SGSY, VELUGU, and SCRIA etc. were initiated for poverty
alleviation. Now, microfinance has received bigger attention among financial service providers, as
a good alternative in the rural credit market. Within this context, the SHGs movement in India
especially the SGSY of DRDA, SHG- bank linkage programme of the NABARD, various MFIs
and community based organizations presented the rich experience.
OBJECTIVES OF STUDY
The objective of this study is to examine the various Microfinance programmes and schemes in
METHODOLOGY
The secondary literature is drawn in house. The secondary data was collected through various
published reports, journals, magazines, web sites. The literature is cross checked and validated to
gives the latest information.
MICROFINANCE PROGRAMMES IN INDIA
The Government of India has initiated various programmes and schemes in the area of microfinance. The most important programmes are SGSY (1999) and NABARD‘s SBLP (1992)
which are using SHGs approach. Other initiatives by government include IMY, Swa-Shakti,
DWCRA, CAPART, SJSRY, IFAD, Swayamsiddha, RMK etc. These all programmes aimed at
reduction of poverty and improving the living condition of rural poor with the help of economic
activities. Some details about the progress of above programmes are given here:
1. Swaranjayanti Gram Swarozgar Yojana / National Rural Livelihood Mission
(SGSY/NRLM)
The Swaranjayanti Gram Swarozgar Yojana (SGSY) is a major on-going programme for the
generation of self-employment of the rural poor people so that they can enhance their living
conditions. Due to the ineffective results of IRDP, DWRCA and TRYSEM, it was felt that there
should be single self employment programme based on group approach. So for this purpose
SGSY was launched on 01.04.1999 after restructuring and merging the erstwhile Integrated Rural
Development Programme (IRDP) and its allied programmes namely Training of Rural Youth for
Self Employment (TRYSEM), Development of Women and Children in Rural Areas (DWCRA),
Supply of Toolkits in Rural Areas (SITRA) and Ganga Kalyan Yojana (GKY), besides Million
Wells Scheme (MWS). The Planning Commission set up a committee under the chairmanship of
Prof. S R Hashim in 1997, the report of which formed the basis for shifting from an individual
beneficiary approach to a group-based approach for poverty alleviation. The Swarnjayanti Gram
Swarozgar Yojana (SGSY) became major sustainable income generation through Self
Employment and micro-enterprise development programme to be implemented by the states, with
peffect from April, 1999. The Performance of SGSY was assessed through concurrent evaluation,
Centre for Management Development, Thiruvananthapuram; reports of the Steering Committee
constituted by the Planning Commission for the 11th Plan. Prof. Radhakrishna Committee on
Credit Related Issues related to SGSY, set up by the Ministry of Rural Development in April,
2008 and reported on the shortcoming in the implementation of SGSY. Accordingly, based
largely on the recommendations of the Prof. Radhakrishna Committee, SGSY has been
restructured as National Rural Livelihoods Mission (NRLM), subsequently renamed as
"Aajeevika", to implement it in a mission mode across the country. The programme was formally
launched on 3rd June, 2011. Since the inception of the Programme 43.96 lakh SHGs have been
formed up to 2013 in India. As of March 2014, all States except Goa have transited to NRLM
(have set up a SRLM as society/company, appointed CEO and core team, and prepared action
plan). Among the Union Territories, Pondicherry has transited to NRLM. Goa and the remaining
union territories (except Chandigarh and Delhi) are expected to transit in FY 2014-15.
During 2011-12, a total of 16.77 lakh Swarojgaris were assisted out of which 11.03 lakh (68.63%)
were women Swarojgaris. In 2012-13, till December, 4.38 lakh Swarojgaris have been assisted
out of which 3.49 lakh (79.68%) are women. Currently a total of 90,917 individual Swarojgaries
from SCs/STs group (50% of total no. of individual Swarojgaries) have been assisted under
SGSY/NRLM in 2012-13. During 2012-13 against the national target of 18, 87,471 (swarozgaris
to be assisted under SGSY), a target of 2, 83,189 has been set for minorities. Out of this target
53,419 individual Swarojgaries have been assisted under SGSY up to 12-02-2013 during the year.
Under SGSY/NRLM, a total of about 86 lakh SC and ST members from SHGs were assisted for
economic activities in 2013-14. During 2013-14, NRLM was implemented in 261 new blocks,
making the cumulative NRLM footprint to 1303 bocks. It has entered 32,573 villages spread
across these blocks. NRLM has supported additional 2.92 lakh SHGs (either newly formed or
strengthened) during the year 2013-14. Further, NRLM has provided funds amounting to Rs.
204.56 crore to the SHGs/Federations during 2013-14.
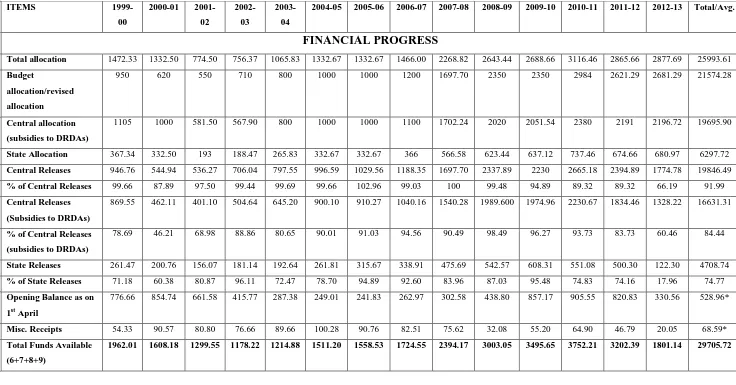
Table 1 shows the financial and physical performance of SGSY/NRLM since inception in India.
The total allocation amount was Rs. 25993.61 crores in 2013 which includes central allocation
release were Rs. 19846.49 & Rs. 4708.74 crores respectively. Total funds available were Rs.
29705.72 crores out of which Rs. 21632.38 crores were utilized. The amount of credit mobilized
was Rs. 33500.46 crores in 2013. Total 4396468 SHGs were formed since inception out of which
2992752 were women SHGs. 98.49% of SHGs have undertaken economic activities after
Grade-II. Total 12934204 Swarojgaris were assisted out of which 8798475 were SC/ST members.
2. Indira Mahila Yojana (IMY)
It was first SHG based women‘s empowerment programme. IMY was launched by ministry of
women and child development in 1995-96 in 238 blocks in the country. It has been recast after
merging Mahila Samridhi Yojana and retiled as 'Swayamsiddha' in 2001 to empower women
through awareness generation, achievement of economic strength through micro-level
income-generating activities and establish convergence of various services such as literacy, health, rural
development etc. The major thrust of IMY was the formation of SHGs at the village or at the
Aaganwadi level, so as to establish a strong base for women at the Panchayati level to prioritize women‘s needs. More than 42,000 Women Self-Help Groups were formed by the end of 2000
Table 1: Financial and Physical performance of SGSY/NRLM in India since inception i.e. 01-04-1999 (Rs. in crores)
SR.
NO.
ITEMS
1999-00
2000-01
2001-02
2002-03
2003-04
2004-05 2005-06 2006-07 2007-08 2008-09 2009-10 2010-11 2011-12 2012-13 Total/Avg.
FINANCIAL PROGRESS
1 Total allocation 1472.33 1332.50 774.50 756.37 1065.83 1332.67 1332.67 1466.00 2268.82 2643.44 2688.66 3116.46 2865.66 2877.69 25993.61
2 Budget
allocation/revised
allocation
950 620 550 710 800 1000 1000 1200 1697.70 2350 2350 2984 2621.29 2681.29 21574.28
3 Central allocation
(subsidies to DRDAs)
1105 1000 581.50 567.90 800 1000 1000 1100 1702.24 2020 2051.54 2380 2191 2196.72 19695.90
4 State Allocation 367.34 332.50 193 188.47 265.83 332.67 332.67 366 566.58 623.44 637.12 737.46 674.66 680.97 6297.72
5 Central Releases 946.76 544.94 536.27 706.04 797.55 996.59 1029.56 1188.35 1697.70 2337.89 2230 2665.18 2394.89 1774.78 19846.49
% of Central Releases 99.66 87.89 97.50 99.44 99.69 99.66 102.96 99.03 100 99.48 94.89 89.32 89.32 66.19 91.99
6 Central Releases
(Subsidies to DRDAs)
869.55 462.11 401.10 504.64 645.20 900.10 910.27 1040.16 1540.28 1989.600 1974.96 2230.67 1834.46 1328.22 16631.31
% of Central Releases
(subsidies to DRDAs)
78.69 46.21 68.98 88.86 80.65 90.01 91.03 94.56 90.49 98.49 96.27 93.73 83.73 60.46 84.44
7 State Releases 261.47 200.76 156.07 181.14 192.64 261.81 315.67 338.91 475.69 542.57 608.31 551.08 500.30 122.30 4708.74
% of State Releases 71.18 60.38 80.87 96.11 72.47 78.70 94.89 92.60 83.96 87.03 95.48 74.83 74.16 17.96 74.77
8 Opening Balance as on
1st April
776.66 854.74 661.58 415.77 287.38 249.01 241.83 262.97 302.58 438.80 857.17 905.55 820.83 330.56 528.96*
9 Misc. Receipts 54.33 90.57 80.80 76.66 89.66 100.28 90.76 82.51 75.62 32.08 55.20 64.90 46.79 20.05 68.59*
10 Total Funds Available
(6+7+8+9)
11 Total Funds Utilized 959.86 1117.94 970.32 921.11 1043.43 1290.83 1338.78 1424.20 1965.97 2285.40 2779.19 2804.04 2318.17 413.15 21632.38
% of utilization to fund
available
48.92 59.52 74.67 78.18 85.89 85.42 85.90 82.58 82.12 76.10 79.50 74.73 72.39 22.94 72.82
% of utilization to
allocation
65.19 83.90 125.28 121.78 97.90 96.86 100.46 97.15 86.65 86.46 103.37 89.98 80.89 14.36 89.30*
% of utilization on
subsidies
36.79 52.67 86.16 65.78 68.37 66.52 67.59 68.18 65.57 76..23 70.56 64.68 72.25 61.77 65.94*
% of utilization of
revolving funds
5.06 6.73 8.79 12.58 15.14 10.79 11.08 9.86 9.52 10.83 12.04 10.42 9.22 10.74 10.20*
% of utilization on
infrastructure
development
22.16 24.45 15.79 14.79 14.47 14.10 13.30 12.99 15.98 15.78 16.30 15.14 14.35 14.64 16.02*
% of utilization on
training/skill
development
4.65 4.32 4.97 4.47 4.91 5.90 6.31 7.26 9.76 9.42 9.52 9.33 8.25 10.20 7.09*
% of utilization on
others
0.79 0.82 1.05 1.76 2.34 2.06 2.16 2.15 5.48 1.93 0.17 0.17 0.17 0.27 1.52*
12 Total credit target 3205.00 3205.00 3200.87 2525.21 2129.33 2507.67 2515.65 2869.12 3743.55 3929.80 4443.91 5210.63 6020.00 0.00 45505.76
13 Total credit mobilized 1056.46 1459.44 1329.68 1184.30 1302.10 1658.18 1823.16 2291.21 2760.31 3530.07 4447.03 4585.98 4399.00 1673.54 33500.46
PHYSICAL PROGRESS (Nos.)
ITEMS
1999-00
2000-01
2001-02
2002-03
2003-04
2004-05 2005-06 2006-07 2007-08 2008-09 2009-10 2010-11 2011-12 2012-13 Total/Avg.
1 SHG formed 292426 223265 434387 398873 392136 266230 276414 246309 306688 563530 389259 311314 233713 61924 4396468
2 Women SHG formed 176263 153285 296175 221085 233136 191666 213213 176712 231670 404972 292788 207280 153558 40949 2992752
3 No. of SHG passed
grade I
125402 214011 176002 189634 204987 219604 210639 222029 251163 322322 439275 280575 181070 73217 3109930
4 No. of SHG passed
grade II
74234 101291 54040 94754 90673 105839 91920 156353 116878 138641 161496 171657 148138 48387 1554301
5 SHG taken up
IGAs-Target
- - - 53876 77018 10636 138169 155288 185525 187821 178937 1081670
Achievements 29017 26317 30576 35525 50717 68102 80130 137931 181386 114452 136411 312288 242948 85087 1530887
% of SHG engaged in
IGAs after Grade-II
39.09 25.98 56.58 37.49 55.95 64.34 87.17 88.22 155.19 85.55 84.47 181.93 164.00 175.85 98.49
6 SHGs swarojgaris
assisted-Target
- - - 528757 770175 1060365 1381689 1552884 1855250 1878210 1789370 10816700
Achievements 347912 318803 364676 414419 577532 788573 873485 1472066 1154269 1470032 1736214 1743726 1468796 407492 13137995
7 Individuals
swarojgaris
assisted-Target
- - - 330473 320906 292380 380981 269598 222093 102972 98101 2117504
Achievements 585956 687349 572792 411848 319363 327355 277631 219860 253503 291392 278136 296113 208321 30607 4760226
8 swarojgaris
assisted-Special projects
- - - 291523 100451 70827 70147 0 0 532948
9 Total swarojgaris
assisted- Target
- - - - - - 859230 1091081 1352745 1762670 1822482 2177343 1981182 1887471 12934204
Achievements 933868 1006152 937468 826267 896895 1115928 1151116 1691926 1699295 1861875 2085177 2109986 1677117 438099 18431169
% of swarojgaris
assisted
37.25 31.69 38.90 - - - 133.97 155.07 125.62 105.63 114.41 96.91 85.65 23.21 -
10 SC swarojgaris
assisted
11 ST swarojgaris assisted 134944 137850 143619 130260 138909 149115 165407 241291 251783 274530 322142 361891 251337 45202 2748280
12 Total SC/ST
swarojgaris assisted
413882 448376 427659 379816 413802 501979 548531 841655 812835 875829 1075782 1006666 789004 172299 8798475
13 Minorities swarojgaris
assisted
- - - 60494 142399 275121 241866 244225 273355 39212 1276672
14 Women swarojgaris
assisted
416690 409842 385891 382613 470740 606141 662764 1247132 1083905 1206513 1502285 1424059 1103553 349322 11251450
15 Disabled swarojgaris
assisted
8529 6737 6059 6118 8504 12680 14793 31864 36113 42315 45869 40838 24505 4506 289430
% of SC/ST
swarojgaris assisted
44.32 44.60 45.62 45.97 46.14 44.98 47.65 49.75 47.83 47.04 51.59 51.98 47.05 39.33 46.70
% of Minorities
swarojgaris assisted
- - - 3.58 8.38 14.78 11.60 11.57 16.30 8.95 11.04
% of Women
swarojgaris assisted
44.62 40.73 41.16 46.31 52.49 54.32 57.58 73.71 63.79 64.80 72.05 67.49 65.80 79.74 61.05
% of Disabled
swarojgaris assisted
0.91 0.67 0.65 0.74 0.95 1.14 1.29 1.88 2.13 2.27 2.20 1.94 1.46 1.03 1.57
Source: Ministry of Rural Development, GOI
Note: All India target for per capita investment and credit subsidy ratio are Rs. 25000 and 3:1 respectively.
(-)Not Available.
3. Swa-Shakti Project
The Rural Women‘s Development and Empowerment Project (RWDEP) now called the
Swa-Shakti Project. Swa-Swa-Shakti is jointly assisted by the World Bank, IFAD and Government of India
(GOI). It was started on 16th October, 1988 for duration of 5 years with an outlay of Rs. 186.21
crore. An additional amount of Rs. 5 crore was provided under the project for setting up a
revolving fund for giving interest bearing loans to beneficiary groups, primarily during the
formative stages. It was started by the WDC of 7 states viz. Gujarat, Haryana, Bihar, Jharkhand,
Karnataka, M.P, U.P. Over all 57 districts, 335 development blocks, 7531 villages are covered
under the project while 17647 SHG's were formed with the membership of 243962 women. The
project is being implemented by 218 NGOs in various states. The total amount of group savings
was Rs. 2215 lakh and bank loan was 2508 lakh rupees. Inter-loaning amount was Rs. 5487 lakh.
In this project, 130896 members were engaged in economic activities. Gujarat, U.P and
Karnataka formed highest number of SHGs while Bihar had low quantity of groups formed. In
Haryana, total 1550 SHGs were formed under Swashakti.
4. Swayamsiddha Project
An improved version of the SHG based women‘s empowerment and development programme,
namely Swayamsiddha, was launched in Feb. 2001 in 650 blocks, including the 238 IMY blocks
in 35 states/UTs, with a total budget of Rs. 116.30 crores. The Scheme ended in March 2008.
Govt. of India has desired that the State Governments should hand hold the Self Help Groups
formed under the Swayamsiddha scheme till the launch the second phase of the programme.
There were total 335 districts covered in this programme which include 650 blocks. The total
numbers of SHGs formed were 69803. During the period 2000-06, total Rs. 4392.77 lakh was
released as fund. In the year of 2007-08, Rs. 2287.30 lakh were released. The highest number of
SHGs formed in the state of U.P (9268), West Bengal (5184), Tamil Nadu (5452) and Bihar
(6340) while some states and U.T showed low progress of groups under this project like Delhi
(276), Sikkim (576), Nagaland (600), Manipur (300), Mizoram (300), A&N Island (225),
Lakshadweep (273) and Pondicherry (300). In Haryana, 1300 groups were formed.
FINANCIAL INSTITUTIONS OF MICROFINANCE IN INDIA
Various type of financial institutions offer microfinance programmes and schemes. There are
programme was initiated by NABARD‘s SHG-Bank linkage programme (SBLP) in 1992. SIDBI
is second player in this sector. SIDBI also provides refinance to the SFCs and commercial banks
for their direct lending. RMK is the third player providing the loans to NGOs for on-lending to the women‘s SHGs. Each has different approach in microfinance sector. The details of all
Institutions are as follows:
1. NABARD’s SHG Bank Linkage Programme (SBLP)
The SBLP has now completed more than 21 years of existence. The Self Help Group-Bank
Linkage Programme (SBLP) was originated in GTZ-sponsored project in Indonesia. NABARD
has set up a task force with the APRACA to identify the existence of SHGs. Starting from a
modest scale as a pilot in the year 1992, the SHG-Bank linkage programme has turned into a
solid structure with more than 73.18 lakh savings-linked Self Help Groups (SHGs) covering over
9.50 crore poor households as on 31 March 2013. The total savings of these SHGs with banks
amounted to Rs. 8,217.25 crore. The number of credit-linked SHGs under the programme stood
at 44.51 lakh. NABARD expended a sum of Rs. 50.44 crore during 2012-13 from Micro Finance
Development and Equity Fund and Women Self Help Group Development Fund for various
micro finance related activities such as formation and linkage of SHGs through SHPIs, training
and capacity building of stakeholders, livelihood promotion, documentation and awareness, etc.
NABARD continued to extend support to NGOs, RRBs, CCBs, Farmers‘ Clubs and Individual
Rural Volunteers (IRVs) for promoting and nurturing SHGs. During 2013-14, grant assistance of
Rs. 36.33 crore was sanctioned to these agencies. The cumulative assistance sanctioned to
various agencies was Rs. 262.83 crore for promoting 7.46 lakh SHGs. Cumulative assistance of
Rs. 79.04 crore was released for formation of 4.99 lakh SHGs as on 31 March 2014. The NGOs
were the most dominant SHPI, forming more than 3.79 lakh SHGs. Grant assistance of Rs. 76.74
crore was sanctioned for promotion of 3.99 lakh JLGs across the country as on 31 March 2014.
During 2013-14, Rs. 1,392.58 crore was disbursed by banks to around 1.29 lakh JLGs and the
cumulative loan disbursement as on 31 March 2014 was Rs. 6,075.91 crore to 6.58 lakh JLGs.1.
There was small increase of 2% in the number of SHGs with outstanding bank loans on 31
March 2013 as compared to a year earlier. This reversed the decline during 2010–12. The
1
volume of fresh loans issued by banks to SHGs during 2012–13 showed a significant growth of
24.5 per cent to reach Rs. 205.85 billion. The average loan outstanding was Rs. 88,455 on 31st
March, 2013 as against Rs. 83,457 a year earlier. Despite significant growth (25.4 per cent) in
bank savings of SHGs, the number of savings-linked groups declined between 2012 and 2013,
with a consequent increase in average savings. The number of SHGs savings-linked with the
banking system grew steadily since 2008 and had peaked at 7.96 million groups in March 2012.
The number declined to 7.32 million as at the end of March 2013. Over a period of more than 15
years up to 2011–12 NABARD sanctioned an amount of Rs. 184.17 crore for promoting 675,661
SHGs. A further Rs. 45.62 crore was sanctioned for promoting and credit linking 97,862 SHGs
during 2012–13.2
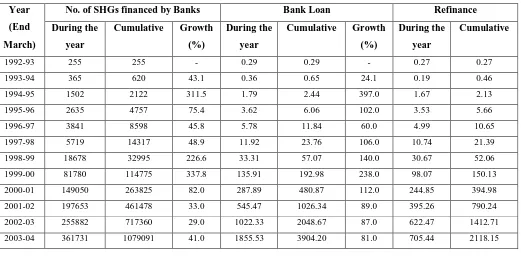
It is clear from table 2 that SBLP was started with 255 SHGs in 1992, a total of 4451343 SHGs
were linked with banks in 2013. The cumulative disbursement of bank loan was Rs. 0.29 crores
in 1992 while it increased to Rs. 105264.60 crores in 2013. The total of Rs. 20585 crore was
given as bank loan in 2013. During the year of 2013, a total of Rs. 1767.42 crores was refinanced
by NABARD.
Table 2: Self Help Group- Bank Linkage Programme (Amount in Rs. Crore)
Year
(End
March)
No. of SHGs financed by Banks Bank Loan Refinance
During the
year
Cumulative Growth
(%)
During the
year
Cumulative Growth
(%)
During the
year
Cumulative
1992-93 255 255 - 0.29 0.29 - 0.27 0.27
1993-94 365 620 43.1 0.36 0.65 24.1 0.19 0.46
1994-95 1502 2122 311.5 1.79 2.44 397.0 1.67 2.13
1995-96 2635 4757 75.4 3.62 6.06 102.0 3.53 5.66
1996-97 3841 8598 45.8 5.78 11.84 60.0 4.99 10.65
1997-98 5719 14317 48.9 11.92 23.76 106.0 10.74 21.39
1998-99 18678 32995 226.6 33.31 57.07 140.0 30.67 52.06
1999-00 81780 114775 337.8 135.91 192.98 238.0 98.07 150.13
2000-01 149050 263825 82.0 287.89 480.87 112.0 244.85 394.98
2001-02 197653 461478 33.0 545.47 1026.34 89.0 395.26 790.24
2002-03 255882 717360 29.0 1022.33 2048.67 87.0 622.47 1412.71
2003-04 361731 1079091 41.0 1855.53 3904.20 81.0 705.44 2118.15
2
2004-05 539365 1618465 49.1 2994.25 6898.46 62.0 967.76 3085.91
2005-06 620109 2238565 14.9 4499.09 11397.55 50.0 1067.72 4153.63
2006-07 1105749 3344314 78.3 6643.19 18040.74 47.7 1292.86 5446.49
2007-08 1227770 4572084 11.0 8849.26 26890.00 33.2 1615.50 7061.99
2008-09 1609586 6181670 31.1 12253.51 39143.51 38.5 2620.03 9682.02
2009-10 1586822 7768492 -1.4 14453.30 53596.81 18.0 3173.42 12855.44
2010-11 1196154 8964626 -24.6 14548.23 68145.04 0.65 2545.43 15400.87
2011-12 1148000 10112626 -4.0 16534.56 84679.60 13.66 3072.59 18473.46
2012-13 4451434 14564060 - 20585.00 105264.60 - 1767.42 20240.88
Note: Data relate to Commercial Banks, RRBs and Cooperative Banks. From 2006-07 onwards,
data on number of SHGs financed by banks and bank loans are inclusive of ‗Swarnajayanti Gram Swarozgar Yojana‘ (SGSY).
Source: Compiled from NABARD Annual Reports and NABARD publications, Progress of
SHG-Bank Linkage in India and Status of Microfinance in India.
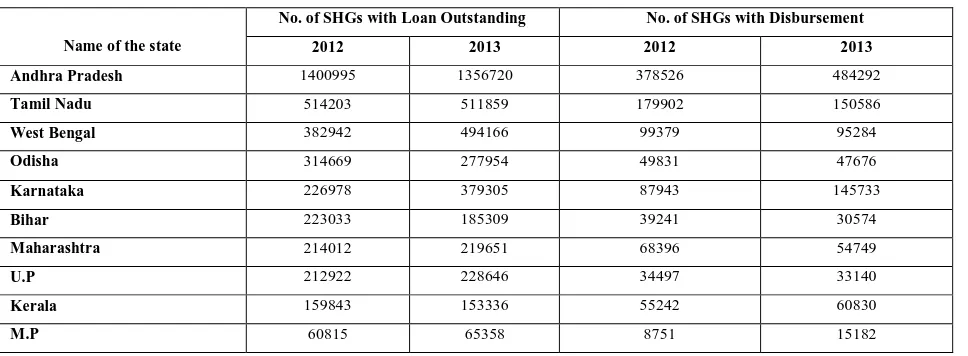
Table 3 demonstrates the top 10 states in terms of SHGs with outstanding loan and disbursement
for the year of 2012 and 2013. It stated that Andhra Pradesh have highest numbers of SHGs with
outstanding loan in 2013 i.e.1356720 which is followed by Tamil Nadu (511859), West Bengal
(494166), Karnataka (379305) and Odisha (277954). While M.P, Kerala and Bihar showed less
number of SHGs. In terms of SHGs with disbursement, Andhra Pradesh has first position with
total 484292 SHGs in 2013. Tamil Nadu was in the 2nd position and Karnataka has 3rd position.
In low growth states, NABARD has taken some action or special measures for their growth and development.
Table 3: Top Ten States under SHG- Linkage Programme in India
Name of the state
No. of SHGs with Loan Outstanding No. of SHGs with Disbursement
2012 2013 2012 2013
Andhra Pradesh 1400995 1356720 378526 484292
Tamil Nadu 514203 511859 179902 150586
West Bengal 382942 494166 99379 95284
Odisha 314669 277954 49831 47676
Karnataka 226978 379305 87943 145733
Bihar 223033 185309 39241 30574
Maharashtra 214012 219651 68396 54749
U.P 212922 228646 34497 33140
Kerala 159843 153336 55242 60830
M.P 60815 65358 8751 15182
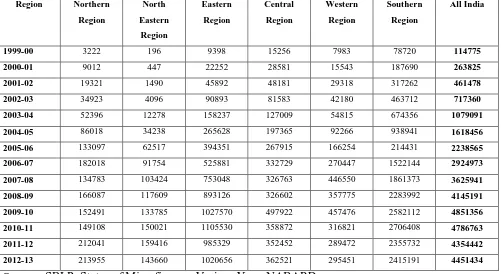
In India, there is no uniformity regarding the progress of microfinance in all regions. In
comparison to other regions of the country, Southern region has great progress of microfinance
sector in terms of numbers of SHGs formed. Northern, North eastern and central region has very
low performance while Eastern region as better progress. Table 4 shows that in 1999, Southern
region had 78720 SHGs which increased to 2415191 in 2013 which is followed by Eastern
(1020656), Central (362521), Western (295451), Northern (213955) and North Eastern (143660)
in 2013. The total numbers of groups in all regions were 4451434.
Table 4: SHG Bank Linkage Programme- Regional Spread of Physical Progress
(Cumulative)
Region Northern
Region
North
Eastern
Region
Eastern
Region
Central
Region
Western
Region
Southern
Region
All India
1999-00 3222 196 9398 15256 7983 78720 114775
2000-01 9012 447 22252 28581 15543 187690 263825
2001-02 19321 1490 45892 48181 29318 317262 461478
2002-03 34923 4096 90893 81583 42180 463712 717360
2003-04 52396 12278 158237 127009 54815 674356 1079091
2004-05 86018 34238 265628 197365 92266 938941 1618456
2005-06 133097 62517 394351 267915 166254 214431 2238565
2006-07 182018 91754 525881 332729 270447 1522144 2924973
2007-08 134783 103424 753048 326763 446550 1861373 3625941
2008-09 166087 117609 893126 326602 357775 2283992 4145191
2009-10 152491 133785 1027570 497922 457476 2582112 4851356
2010-11 149108 150021 1105530 358872 316821 2706408 4786763
2011-12 212041 159416 985329 352452 289472 2355732 4354442
2012-13 213955 143660 1020656 362521 295451 2415191 4451434
Source: SBLP, Status of Microfinance, Various Year, NABARD
2. Small Industrial Development Bank of India (SIDBI)
SIDBI also launched its bank linkage programme in 1992. The micro credit scheme (MCS) was
formulated in March 1994. Encouraged by the success of the pilot phase of MCS, the bank
launched SIDBI foundation for Micro credit (SFMC) during the year of 1999. The cumulative
disbursements (including loans, equity and quasi equity but excluding IMEF) under SIDBI‘s
micro credit portfolio of the Bank stood at Rs. 1,810.92 crore, as on March 31, 2013. The
number of MFIs assisted by SIDBI and having loaned outstanding with the Bank as on March
31, 2013 stood at 102. The assistance through SIDBI has benefited around 322 lakh
disadvantaged people, most of them being women. Under IMEF (the scheme operationalised as
per Union Budget 2011-12), a sum of Rs. 104.25 crore has been sanctioned up to March 31,
2013 out of which Rs. 73.25 crore stands disbursed as on March 31, 2013. The total numbers of
beneficiaries assisted under SIDBI were 12.88 lakh in 2007-08 and 19.62 lakh in 2008-09.
Transformation loan assistance of Rs. 8 crore was extended to 10 MFIs during the year. Total
disbursement during the year 2009 was 1741.61 crores and loan portfolio was 2136.89 crores. In
2013, the total amount of Rs. 1810.92 crores was sanctioned by SIDBI out of which only Rs.
335.06 crores was disbursed.
3. Rashtriya Mahila Kosh (RMK)
The Rashtriya Mahila Kosh (RMK) is a national level mechanism to meet the micro credit needs
of the poor and asset-less women in the Informal Sector. It works under the ministry of women
and child development. From inception in 1993 till February 2001, total credit worth Rs. 100
crore was sanctioned to benefit more than 400,000 women through 827 NGOs spread over the
country. RMK has a very creditable recovery rate of 90 to 95 per cent. It has also ventured to
develop an institutional base at grass-roots level with the establishment of Self Help Group for
expanding its credit services. Since inception, in all over India RMK had sanctioned total amount
of Rs. 34103.09 lakh and out of this Rs. 22931.79 lakh had been disbursed up to the year of
2012. Total number of 717434 beneficiaries was linked with RMK as on Feb., 2012. The total
sanctioned loan amount was Rs. 439.33 lakh in 1993 and total disbursement was Rs. 140.82 lakh.
This increased to a large extent up to 2013. Total 41 NGOs are working through RMK. There
were 3617 SHGs were linked in the year of 2009. Out of total beneficiaries, women were 23019
in 2013.
4. Microfinance Institutions (MFIs)
Microfinance Institutions (MFIs) was promoted by government, banks, NGOs and individuals.
AGA KHAN is the first microfinance bank which was established in the year 2002. Though the
microfinance industry was present in India from the early 1970s, but it came into prominence
provides services like micro credit, economic development, savings, insurance, remittances,
nonfinancial services etc. During the year 2011-12, the banks financed 453 MFIs with bank loans
of Rs. 49658.68 crores and 1831 MFIs were with outstanding loans of Rs. 98532.37 crores. As
per the provisional data furnished by Sa-Dhan for 2012–13, there are 2.75 crore active clients of
MFIs—both NBFCs and others—with a loan outstanding of Rs. 22,300 crore. Both client
outreach and outstanding loans of MFIs have not increased since 2010–11. The number of active
clients has remained around 9 crore over the last four years, if one ignores the possible
overlapping between the SBLP and MFI models. The loan outstanding was stagnant around Rs.
21,000 crore, and increased marginally by about Rs. 1,300 crore between 2011–12 and 2012–
133.
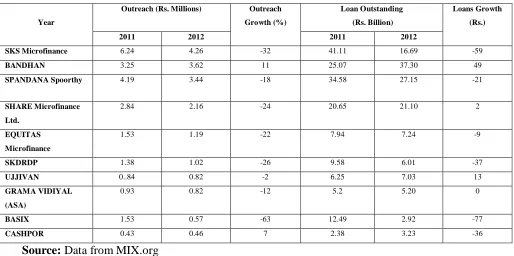
Table 5 demonstrates the top 10 MFIs all over India. SKS Microfinance is leading the sector with the
total 4.26 million clients in 2012. Its outstanding loan amount was Rs.16.69 billion in 2012. Other
leading Microfinance Institutions in this sector was BANDHAN, SPANDANA, SHARE, EUQITAS,
SKDRDP, UJJIVAN, GRAMA VIDIYAL, BASIX and CASHPOOR. The data given in the table
shows the client outreach and loan outstanding in the year of 2011 and 2012.
Table 5: Top 10 Micro Finance Institutions by Outreach
Year
Outreach (Rs. Millions) Outreach
Growth (%)
Loan Outstanding
(Rs. Billion)
Loans Growth
(Rs.)
2011 2012 2011 2012
SKS Microfinance 6.24 4.26 -32 41.11 16.69 -59
BANDHAN 3.25 3.62 11 25.07 37.30 49
SPANDANA Spoorthy 4.19 3.44 -18 34.58 27.15 -21
SHARE Microfinance
Ltd.
2.84 2.16 -24 20.65 21.10 2
EQUITAS
Microfinance
1.53 1.19 -22 7.94 7.24 -9
SKDRDP 1.38 1.02 -26 9.58 6.01 -37
UJJIVAN 0..84 0.82 -2 6.25 7.03 13
GRAMA VIDIYAL
(ASA)
0.93 0.82 -12 5.2 5.20 0
BASIX 1.53 0.57 -63 12.49 2.92 -77
CASHPOR 0.43 0.46 7 2.38 3.23 -36
Source: Data from MIX.org
3
MICROFINANCE PENETRATION IN INDIA
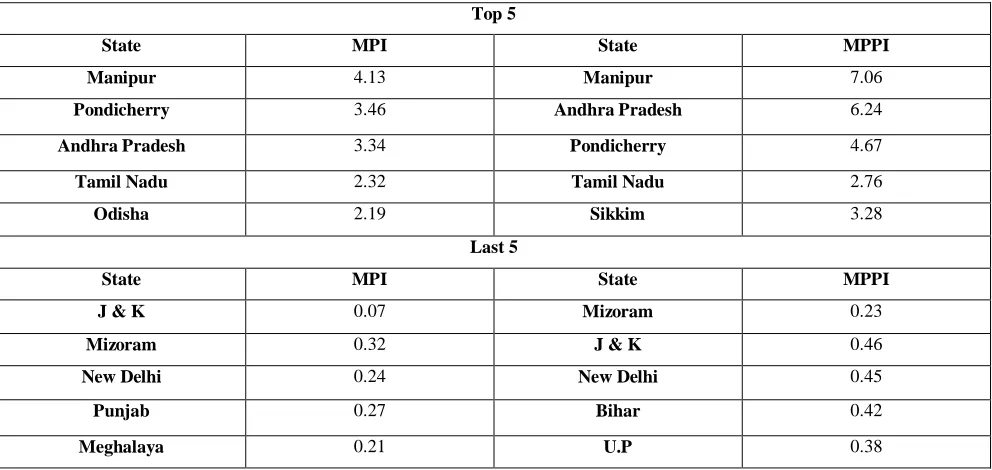
In the current microfinance landscape in India, there is a significant change in the Microfinance
Penetration Index (MPI) and Microfinance Poverty Penetration Index (MPPI) in several states.
The analysis shows Manipur has taken the top position for the second consecutive year with a
score of 4.13 in MPI and 7.06 in MPPI. AP, the top ranking state in penetration in the previous
years is now placed third. Puducheri (Pondicherry) has improved its ranking and moved to
second place. The ranking of the last five ranks remain the same as the previous year except that
there was some increase in the values. The population data has been sourced from the latest
Census 2011 and this might be one of the reasons for some changes among states in terms of
MPI. The changes in the spread of SHG linkage and MFIs customer base as the result of the
crisis have caused some changes to the MMPI rankings of states (Table 6). The low MPPI ratio
in states like Bihar and UP with a large proportion of households under poverty line indicates
that considerable work has to be done in these states both by SBLP and MFIs.
Table 6: Ranks of the selected states based on MPI and MPPI, 2012
Top 5
State MPI State MPPI
Manipur 4.13 Manipur 7.06
Pondicherry 3.46 Andhra Pradesh 6.24
Andhra Pradesh 3.34 Pondicherry 4.67
Tamil Nadu 2.32 Tamil Nadu 2.76
Odisha 2.19 Sikkim 3.28
Last 5
State MPI State MPPI
J & K 0.07 Mizoram 0.23
Mizoram 0.32 J & K 0.46
New Delhi 0.24 New Delhi 0.45
Punjab 0.27 Bihar 0.42
Meghalaya 0.21 U.P 0.38
CONCLUSIONS
Although Microfinance in India has grown at a remarkable pace in recent years and also
achieved considerable outreach amongst rural households across the nation. Microfinance
services are provided by the SBLP of NABARD, NGOs, MFIs and various government schemes
and programmes. SHGs in India are mostly promoted by SBLP of NABARD, NGOs and MFIs.
Microfinance helped poor to gain banking and financial facilities. Despite of the significant role
of microfinance programme in enhancing the status of rural poor and nurturing the SHGs, the
overall progress of microfinance across the country is not equal. There were regional disparities.
This programme concentrated more in southern region in comparison to other region of India.
On the basis of above findings, it is observed that there are so many problems associated with the
MFIs. There is a big difference between demand and supply of microfinance in India. The
Southern regions showed greater progress in this sector. Moreover, Microfinance institutions are
lagging behind in terms of loan and credit the real needy, regional imbalance, a proper regulation
etc. These Internal, external and client based challenges are prevailing from starting of the MFIs
in India. Finally, MFIs in India have so many lacunas in their running, though the MFIs paid an
important role in the poverty alleviation and enhancing the living standards of the poor.
REFRENCES
Vinayak. Gopal. Patil (2011), ―Microfinance in India‖, Golden Research Thoughts, ISSN
No-2031-5063, Vol.1,Issue.V/Nov 2011pp.1-4.
Microfinance-State of Sector Reports, Various Years.
NABARD Reports, Various Years.
SIDBI Reports, Various Years
Women and child development department, Annual Reports, Various years