145
Volume 65 17 Number 1, 2017
https://doi.org/10.11118/actaun201765010145
DRAWBAR PULL AND ITS EFFECT ON
THE WEIGHT DISTRIBUTION OF A TRACTOR
Adam Polcar
1, Lukáš Renčín
1, Jiří Votava
11 Department of Technology and Automobile Transport, Faculty of AgriSciences, Mendel University in Brno,
Zemědělská 1, 613 00 Brno, Czech Republic
Abstract
POLCAR ADAM, RENČÍN LUKÁŠ, VOTAVA JIŘÍ. 2017. Drawbar Pull and Its Effect on the Weight Distribution of a Tractor. Acta Universitatis Agriculturae et Silviculturae Mendelianae Brunensis,
65(1): 0145 –0150.
This article aims to experimentally determine how the tractor’s weight distribution changes during loading by drawbar pull, and how the tractor’s weight affects its drawbar pull properties. Drive wheel ballasting has a significant effect on the drawbar pull and wheel slip of the tractor - travelling gear losses.To achieve these objectives, we conducted experimental measurements on the tractor Case IH Magnum 370 CVX. The results show that higher drawbar pull is achieved in tractors with a higher weight. The measured increase of drawbar pull was 15,8 kN between maximal and minimal weight (∆ 2320 kg). All variants show an equal percentage increase in the weight on the rear axle of the tractor (+ 6 %). Increasing the tractor’s weight affected the drawbar pull as well as the wheel slip. As the tractor’s weight increases, there is a smaller increase in wheel slip as the drawbar pull increases. The results confirmed that tractor ballasting is important in order to achieve optimum drawbar pull properties, but it is necessary to keep in mind that the higher the weight of the machine or equipment, the larger the effect on the soil.
Keywords: drive wheel ballasting, drawbar performance, slip
INTRODUCTION
Tractors are a mobile energy resource intended for tractive work, which is why its drawbar performance are essential. The drawbar pull and tractive power are given particularly by the design parameters of each tractor. The energy contained in the fuel (amount of energy depend on fuel composition and properties (Kumbár and Skřivánek, 2015)) is converted in the engine into mechanical work intended for tractive work, to drive machines powered through a power take-off, or an external circuit of the tractor hydraulics. The effective power of the engine cannot be entirely converted to either tractive power or a power take-off. The whole process can be described by an equation of the power balance of the tractor (Bauer et al., 2013):
[ ]
e t VH H m v s w a
P P P= + +P +P +Pδ+ + +P P P +P W (1)
where:
Pe ...effective engine output, Pt ...drawbar pulling power, PVH ...power transmitted by PTO, PH ...hydroelectric generator power, Pm ...power loss in transmission device, Pδ ...power loss by slip,
Pv ...power loss by rolling resistance, Ps ...power required to climb slope,
Pw ...power required to overcome air resistance, Pa ...power required for acceleration.
Pertinent parts of this equation (1) includes the drawbar pulling power, power transmitted by the hydroelectric generator, and effective PTO power. At a driving speed of up to 9 m.s-1 on a flat
surface, the climb, acceleration and air resistance are negligible.
The individual powers shown in equation 1 are given primarily by the design parameters of the tractor. These design parameters include the center of gravity and wheel base of the tractor (expecially for 4×4), its weight, hinge position, type and condition of tires, engine power, type of transmission gear, size of active area of belts in crawler tractors, etc. (Grečenko, 1963) Equation (2) is an example representing the maximum drawbar pull Ftmax that can be drawn from a vehicle (Grečenko,
1994):
(
)
[ ]
max .
t T
F =G µ−f N (2)
It is apparent from equation (2) that the drawbar pull of the tractor GT, or the ballasting of drive
axles depends on the weight of the tractor and the difference between the drag coefficient and the rolling resistance coefficient. The drag coefficient m represents the perfection of the contact of the drive mechanism with the ground, as well as part of the engine driving force transferred to the ground. It is dependent on the size of the contact area of the tire or belt, surface, etc. The rolling resistance coefficient f also depends on many parameters: the speed, size, air pressure and tire load on the surface on which the vehicle is moving. As the above description indicates, the drawbar pull can be influenced by many parameters. We can most
often see a change in tire pressure in wheel tractors and in weight distribution, or the ballasting of drive axles with ballasts or mounted or semi-mounted trailers. Each tractor manufacturer offers a set of ballasts to increase the weight of the tractor, or change the weight distribution between the axles.
Weight distribution is a variable parameter and it changes over the course of its work. This change is a result of the effect of the drawbar pull. Fig. 1 shows a simplified power diagram for a pulling 4x4 tractor moving at a uniform rate of up to 9 km.h-1 (the air
resistance and rolling resistance of tires is left out). The power diagram (Fig. 1) shows a tractor ballasted by general force applied to the trailer. The resultant exerted by the tool on the tractor is labeled F. This resultant is the result of the drawbar pull Ft and the force arising from the weight of
the machine. The tractor’s weight GT is effective
in the center of gravity. The wheels on the contact surface are affected by normal force Y1 and Y2.
The ground force and the driving force, Fh1 and Fh2,
move the tractor forward. The size of force Y varies depending on the drawbar pull Ft. This change can
be described by the torque equilibrium (for item 2) according to equation 3:
2 0 T. 1. t. t t. . t 0
M = G d Y a F h F tg c− − − θ =
∑
(3)The normal force Y1 can be determined by
adjusting equation 3:
[ ]
1. . . .
T t t t t
G d F h F tg c
Y N
a
θ
− −
= (4)
1: Simplified power diagram of pulling tractor (Bauer et al., 2013)
If the aggregate machine does not draw any vertical force (tgθ = 0) then equation (4) is simplified to:
[ ]
1 T t. t
d h
Y G F N
a a
= − (5)
The equation shows (5) that the normal force consists of the static adhesive weight (member GT.d/a) and the auxiliary weight transfer
(member −Ft.ht/a), which is exerted by the drawbar
pull. We can therefore generally conclude that an increase in drawbar pull results in a weight transfer from the front axle to the rear axle. This article aims to experimentally determine how the tractor’s weight distribution changes during loading by drawbar pull, and how the tractor’s weight affects its drawbar performance.
MATERIALS AND METHODS
In order to fulfill the objectives given above, the experimental measurements were carried out on tractor Case IH Magnum 370 CVX. The tractor New Holland T8.420 Autocommand weighing 17,600 kg was used to create a load force.
The experiment was carried out on a piece of land after the harvest of corn silage and worked to a depth of 10 cm with a stubble plough two weeks prior to the measuring. According to VÚMOP (2016), this soil type is classified as alluvial soil. The land consists of flat to slightly inclined terrain. The measured soil moisture content was 26 %.
Both internal and external sensors were used in the tractor during the measurement of parameters. The reading of data from internal sensors was conducted via the CAN bus. The electrical signal from external sensors (drawbar pull sensors U10M, GPS receivers for measuring the actual speed of the tractor) was processed by the data logger CompactRio from National Instruments, and further evaluated and stored using propriety software developed with the LabVIEW program. The data transmission frequency was 20 Hz.
As the name of the measured tractor implies, the tractor is equipped with a CVX transmitter. This is a hydromechanical transmitter, or a transmitter with continuously variable transmission. For this reason, it was not possible to perform the measurement in
a specific gear, as it is usually performed (Semetko
et al., 1986). During the measurement, the gear unit mode in the tractor was set to maintain a constant velocity. In this mode the gear unit maintains a constant velocity or constant gear ratio regardless of the ballasting of the tractor. The speed selected for the tests was 6 km.h-1 and 9 km.h-1.
To determine the effect of the drawbar pull on the weight distribution, we conducted a total of 6 test variants. Each variant presented different front and rear axle loads. For this purpose, the front ballast in front tree point hitch and different wheel ballasts were used. A detailed overview of each variant is shown in Tab. I.
The tests were so-called „accelerated drawbar pull tests“. In these tests both tractors move at a desired speed, while the engine of the tested tractor operates at the maximum fuel supply. The braking tractor then steadily decelerated until it came to a halt. The measured parameters are captured during the deceleration. Each variant is repeated for statistical significance. The average values of the measured parameters are calculated from the repeated tests. During the testing, the measured tractor was in 4×4 drive mode. The tractive power
Pt was also calculated for evaluation according to
equation 6:
[ ]
.
t t s
P F v W
=
(6)where:
Ft ... drawbar pull [N]
vs .... actual speed from GPS [m.s-1]
Other evaluated parameters included wheel slip calculated with equation 7:
[ ]
1 s.100 %
t v v
δ= − (7)
where:
vt .... theoretical speed [m.s-1]
RESULTS AND DISCUSSION
As we deduced from the beginning of this article, increasing drawbar pull creates a moment of drawbar pull at point 2 (see Fig. 1). This moment causes the weight distribution to move from the front axle to the rear axle, overloading it.
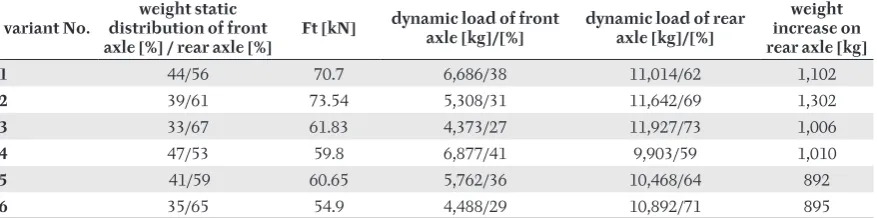
I: Tractor’s weight distribution in different variants
variant No. front axle load [kg]/[%] rear axle load [kg]/[%] total weight of tractor [kg]
1 7,860/44 9,840/56 17,700
2 6,530/39 10,420/61 16,950
3 5,400/33 10,900/67 16,300
4 7,870/47 8,910/53 16,780
5 6,570/41 9,460/59 16,230
If we know the distance of the center of gravity from the axis of the rear axle, the height of the hitch (ht = 550 mm) and the wheelbase (a = 3,375 mm) we can (using equation 5) determine the reaction force, or rather the front and rear axle weight (sum of reaction forces from ground is equal to the total weight of tractor – see Fig. 1). The average drawbar pull achieved at a speed of 6 km.h-1 was included
in the equation. The highest drawbar pulls are achieved at lower speeds (Bauer et al., 2013). Results in percentages of weight distribution are given in Tab. II.
As Tab. II shows, the higher the tractor’s weight, the higher average drawbar pull is. The measured increase of drawbar pull was 15.8 kN between maximal and minimal weight (∆ 2,320 kg). The results also show that the percentage increase in weight on the rear axle is approximately the same in each variant. This increase is approximately 6 % of the original or static load on the rear axle. The greatest increase, 1,302 kg, was found in the highest drawbar pull. We can therefore generally say that it is convenient to use a combination of front and rear ballasts for the tractor’s optimum weight distribution (also in older types of tractors 4k2). The additional ballasting of the rear wheels reducing the wheel slip (see below) occurs due to the moment deduced from the drawbar pull. Uneven weight distribution, or overloading of the tractor’s rear wheels (or overloading of the tractor with front ballasts reducing the weight on the rear axle) could lead to pedocompaction. Excessive compaction of soil results in topsoil with a strained pattern distribution. This topsoil is characterized by its compactness, difficult cultivation, increased capillary porosity, poor infiltration of rainwater and heavy surface runoff. There is also limited air capacity and biological activity in this type of soil. (Jandák et al., 2010) However, as other results confirm, using additional ballasts has a positive effect on the drawbar pull properties of tractors.
Fig 2 shows the drawbar performance measured in a tractor moving at a speed of 9 km.h-1.
The measured values (Fig. 2) show that the tractor’s drawbar pull properties increase with a higher weight. These conclusions are confirmed by Bauer and Sedlák (2000) and Grečenko (1994). The best drawbar pull properties were found in variant No. 2. In this variant the tractor was equipped with 650 kg
ballasts in the front three-point hitch and 2,500 kg ballasts in the rear wheels. The graph also shows that the drawbar pull of the tractor is approximately the same in all variants up to 70 kN. This implies that adding additional weight to the tractor should be carefully considered depending on what work we will perform. As stated in the article by Bauer
et al. (2013), increasing the weight of the tractor or using additional ballasts also increases the rolling resistance and fuel consumption.
Increasing the tractor’s weight is also reflected in its slip, in addition to the drawbar pull. The relationship between the slip and drawbar pull is shown in Fig. 3.
In large drawbar pull, slip losses constitute the largest portion of total losses (Bauer et al., 2013). The greater the driving force of the running gear, the higher the slip value. In addition, the slip not only affects the unusable drawbar pull, it also adversely affects the soil structure and the sward state. The slip depends on many factors, especially the adhesive forces between the surface and the tire, the shape and size of the imprint produced at the tire’s contact with the ground, and the driving force. The larger the imprint, the smaller the slip (for the same driving force). One of the factors is the load on the tire, which is confirmed by results shown in Fig. 3. As the tractor’s weight increases, there is a smaller increase in wheel slip with increasing drawbar pull. Up to 70 kN the slip is almost linear. From this point on (at δ = 10 %) it increases steeply. Slip can be reduced by increasing the load on the drive wheels, and as the study by authors Šmerda and Čupera (2011) suggests, by reducing the inflation pressure. The authors of the study also state that reducing the inflation pressure not only significantly reduces slip and increases drawbar pull, but also increases the tractive power. For optimum transmission of engine power to the ground we must assess both the load on the driving axles, or weight distribution, and the tire pressure.
II: Results of the calculation of the dynamic load of both axles with the average value of drawbar pull achieved by each variant
variant No. distribution of front weight static
axle [%] / rear axle [%] Ft [kN]
dynamic load of front
axle [kg]/[%] dynamic load of rear axle [kg]/[%]
weight increase on rear axle [kg]
1 44/56 70.7 6,686/38 11,014/62 1,102
2 39/61 73.54 5,308/31 11,642/69 1,302
3 33/67 61.83 4,373/27 11,927/73 1,006
4 47/53 59.8 6,877/41 9,903/59 1,010
5 41/59 60.65 5,762/36 10,468/64 892
CONCLUSION
The results show that the load on the drive wheels is significantly affected by the tractor’s drawbar pull properties. On the other hand, it is important to realize that high loads also increase tire deformation, i.e. their rolling resistance. It is obvious that for light pulling work, work with machinery powered through PTO with low drawbar pull resistance and for transportation, it is necessary to carefully consider ballasting the tractor. In these cases the use of ballasts is justified to provide steerability of the tractor with mounted equipment.
Every tractor manufacturer or dealer should have a prepared method for the types of ballasts the operators should use for different types of work. New Holland has created a detailed guide
0 20 40 60 80 100 120 140 160 180 200
0 20 40 60 80 100 120
Pt
[k
W]
Ft [kN]
6. variant - 15,380 kg
5. variant - 16,230 kg 4. variant - 16,780 kg
3. variant - 16,300 kg 2. variant - 16,950 kg 1. variant - 17,700 kg
2: Tractive power and drawbar pull relationship at a speed of 9 km.h-1
0 10 20 30 40 50 60 70 80 90 100
0 20 40 60 80 100 120
δ
[%
]
Ft [kN] 6. variant - 15,380 kg
5. variant - 16,230 kg 4. variant - 16,780 kg
3. variant - 16,300 kg
2. variant - 16,950 kg
1. variant - 17,700 kg
that describes how to ballast tractor models T7, T8 and T9 in aggregation with different tools. For example, tractors with high-performance engines (i.e. models T7 and T8) should adhere to the weight distribution of 40 % on the front axle and 60 % on the rear axle. For “light equipment” (equipment with a working speed above 8,7 km.h-1) the ratio of the tractor’s weight [kg]/ nominal engine power [HP] should
be close to 45. For “medium equipment” and a speed ranging from 7,2–8,7 km.h-1, this ratio should be
close to 50 kg/HP. For “heavy equipment” and maximum drawbar pull, it should be 55 kg/HP.
As we’ve mentioned several times, tractor ballasting is important to achieve optimum drawbar pull properties, but we must keep in mind that the heavier the machine or machines, the higher their effect on the soil.
Acknowledgement
The presented work has been prepared with the support of IGA MENDELU IP 10/2016: “Verification of the model force action in a three-point hitch”.
REFERENCES
BAUER, F. and SEDLÁK, P. 2000. Influence of drive wheels load on tractor drawbar pull properties [in Czech: Vliv zatížení hnacích kol na tahové vlastnosti traktoru]. Zemědělská technika, 46 (1): 11–15.
BAUER, F., SEDLÁK, P., ČUPERA, J., POLCAR, A., FAJMAN, M., ŠMERDA, T. and KATRENČÍK, J. 2013.
Tractors and their Use[in Czech: Traktory a jejich využití]. Praha: Profi Press s.r.o.
GREČENKO, A. 1963. Wheel-Type and Chain-Track Tractor [in Czech: Kolové a pásové traktory]. Praha: Státní zemědělské nakladatelství in cooperation with Ústředím věděckotechnických informací MZLVH.
GREČENKO, A. 1994. Properties off-road vehicles [in Czech: Vlastnosti terénních vozidel]. Praha: Vysoká škola zemědělská.
JANDÁK, J., POKORNÝ, E. and PRAX, A., 2010: Pedology. [in Czech: Půdoznalství]. Brno: Mendelova zemědělská a lesnická univerzita.
KUMBÁR, V. and SKŘIVÁNEK, A., 2015: Temperature dependence viscosity and density of different biodiesel blends. Acta Universitatis Agriculturae Et Silviculturae Mendelianae Brunensis, 63(4), 1147–1151. NEW HOLLAND AGRICULTURE. Tractor New Holland weight down [in Czech: Dotěžování traktorů New Holland].
[Online]. Available at: http://www.eagrotec.cz/obrazky-soubory/dotezovani-traktoru_pro-web-37b41. pdf?redir [Accessed: 2016, August 12].
SEMETKO, J. et. al. 1986. Mobile Power Means of Transport 3[in Czech: Mobilné energetické prostriedky 3]. 2nd
edition. Bratislava: Príroda.
ŠMERDA, T. and ČUPERA, J. 2011. Tire inflation and its influence on drawbar characteristics and performance – Energetic indicators of a tractor set. Journal of Terramechanics, 47: 395–400.
VÝZKUMNÝ ÚSTAVU MELIORACÍ A OCHRANY PŮDY (VÚMOP), 2016. eCatalog BPEJ [in Czech: eKatalog BPEJ]. [Online]. Available at: http://bpej.vumop.cz/00100 [Accessed: 2016, August 12].
Contact information Adam Polcar: [email protected]