R E S E A R C H
Open Access
QoE optimization of video multicast with
heterogeneous channels and playback
requirements
Ali Bakhshali
1*, Wai-Yip Chan
1, Steven D. Blostein
1and Yu Cao
2Abstract
We propose an application-layer forward error correction (AL-FEC) code rate allocation scheme to maximize the quality of experience (QoE) of a video multicast. The allocation dynamically assigns multicast clients to the quality layers of a scalable video bitstream, based on their heterogeneous channel qualities and video playback capabilities. Normalized mean opinion score (NMOS) is employed to value the client’s quality of experience across various possible adaptations of a multilayer video, coded using mixed spatial-temporal-amplitude scalability. The scheme provides assurance of reception of the video layers using fountain coding and effectively allocates coding rates across the layers to maximize a multicast utility measure. An advantageous feature of the proposed scheme is that the complexity of the optimization is independent of the number of clients. Additionally, a convex formulation is proposed that attains close to the best performance and offers a reliable alternative when further reduction in computational complexity is desired. The optimization is extended to perform suppression of QoE fluctuations for clients with marginal channel qualities. The scheme offers a means to trade off service utility for the entire multicast group and clients with the worst channels. According to the simulation results, the proposed optimization framework is robust against source rate variations and limited amount of client feedback.
Keywords: Video multicast, Scalable video, Fountain coding, Rateless coding, Multicast optimization, Heterogeneous clients, Quality of service
1 Introduction
1.1 Motivation
Multimedia delivery systems can be optimized to maxi-mize the overall throughput (best effort) or to satisfy client quality of experience (QoE) demands (QoS-guaranteed). QoE-guaranteed optimizations may suffer from being overly constrained, especially in large-scale multicasts. Tracking the media processing capability, QoE demand, and channel quality of every client can be daunt-ing, prompting the search for better trade-offs between bandwidth usage efficiency and optimization complexity. Sometimes, no feasible solution exists due to bandwidth limitations and/or clients with poor channels that require forward error correction (FEC) codes with exceedingly
*Correspondence: ali.bakhshali@queensu.ca
1Department of Electrical and Computer Engineering, Queen’s University, K7L 3N6 Kingston, ON, Canada
Full list of author information is available at the end of the article
large overheads. Therefore, having a screening process to reduce excessive QoE demands is essential, especially in large-scale multicasts. One may utilize a mechanism to dynamically assign clients to available media quality lev-els in order to improve resource utilization efficiency. For example, using scalable bitstreams, the multicast server may drop the highest enhancement layers when relatively few users with high-quality channels and high-resolution displays exist. The saved transmission resources could be redeployed to serve clients with poor channels. The multicast optimization needs to be performed repeatedly due to client channel and source bitstream variations, as well as to account for clients dynamically joining or leav-ing the multicast at random times. Thus, low complexity optimization methods are required.
In point-to-multipoint services such as multicast, the transmission to the multicast clients may traverse dif-ferent paths. As a result, the end-to-end transmission channels may exhibit diverse behaviors and capacities.
End-to-end QoE can be assured by providing sufficient error protection. Feedback-based error correction such as automatic repeat request (ARQ) and hybrid ARQ [1] may not be feasible due to latency and possible feed-back implosion at the multicast server. An alternative which avoids these problems is to employ FEC coding. In multicasting, we are faced with an ensemble of chan-nels with different loss processes and require FEC that is “universally” efficient. Fortunately, fountain codes [2] have been demonstrated to well approximate the ideal. With fountain codes, the receiver can recover the source sym-bols with high probability when the number of correctly received code symbols is slightly larger than the number of source symbols. Crucially, this recovery capability is independent of the loss pattern or channel memory. One implication of this “independence” from channel memory is that clients connected to distinct channels with differ-ing memory behaviors that inflict the same amount of loss will see the same throughput.
This paper is concerned with an efficient application of fountain codes as an application-layer FEC (AL-FEC) code to meet the QoE demands of video multicast clients with heterogeneous channels and video quality requirements.
This approach offers the following advantages : 1) ser-vice versatility since the serser-vice is agnostic to the under-lying network infrastructures, enabling clients to join the multicast through a variety of network connections; 2) quick service deployment or reconfiguration, eliminating the wait for infrastructure upgrade and enabling quick launch of third-party services; and 3) extending the capa-bility of an existing network (infrastructure) [3].
1.2 Related approaches
Multicast schemes have evolved with advances in source and channel coding techniques. Receiver-driven layered multicast (RLM) [4] is a landmark technique for multi-casting to clients with heterogeneous channels. RLM is a “client-pulled” scheme suitable for large-scale multicast over the Internet. Subsequently, unequal error protection (UEP) was proposed [5] and its application to multime-dia transmission was studied [6]. Further works largely fall into one of the following three categories: AL-FEC design for UEP [7–13], link-layer scheduling [14–18], and joint source-channel coding [19]. In practice, system design and provisioning usually prefer separate source and channel coding as well as low computation complexity.
Fountain codes are employed in many current mul-timedia delivery standards [20, 21] due to their struc-tural benefits, e.g., linear time encoding/decoding algo-rithms and small overhead [22, 23]. Digital fountain-based approaches in the AL-FEC design category [8–10] mainly rely on altering the degree distribution and source symbol selection process to provide UEP across different source layers. In [24], the fountain-code degree distribution is
optimized to provide short code length performance. The advantage of using rateless codes over conventional Reed-Solomon codes in providing graceful-degradation was reported in [12]. In [13], UEP and rateless coding are uti-lized in streaming a scalable video from multiple servers. This work aims to maximize the probability of successful decoding through proper rate allocation amongst video layers of different servers. Note that none of the above fountain-code-based works consider client channel het-erogeneity in their design. Moreover, these schemes treat only one scalability dimension (PSNR) and do not opti-mize the visual perceptual quality.
There are a number of notable link-layer scheduling algorithms for multimedia multicast. A best-effort opti-mization framework is proposed in [14] for Internet pro-tocol television broadcast over worldwide interoperability for microwave access (WiMAX) channels with consid-eration of capacity variation in the multicast channel. Sharangi et al. [17] proposed a scalable video transmission scheduling optimization scheme for multiple multicasts to share a set of WiMAX timeslots such that the aver-age utility of the multicasts is maximized. A similar work with a more elaborate model of physical layer parameters and channel effects is proposed by Vukadinovic et al. [18]. While our problem (described below) and [17, 18] both strive to balance serving individual clients versus overall throughput, for our problem, the individuals are clients with heterogeneous channels and playback requirements within a multicast, whereas for [17, 18], the individuals are distinct multicasts each of which targeting one channel and one media quality.
Several multicast schemes benefiting from application-layer FEC and file delivery over unidirectional transport (FLUTE) [25] have been recently introduced [26, 27]. Adoption of dynamic adaptive streaming over HTTP (DASH) to support multicast services is discussed in [28, 29]. A hybrid multicast architecture based on FLUTE and DASH is proposed in [30] where FLUTE provides multi-casting with application-layer FEC and DASH is utilized for retransmission of lost frames over a unicast channel. Bouras et al. [31] experimentally assessed the efficacy of using standard raptor [32] codes as application-layer FEC codes for multicasting video over 3GPP long-term evo-lution (LTE) wireless networks. The assessment employs non-scalable low-bit-rate video, and no service optimiza-tion is performed.
1.3 Proposed approach
scheme. Clients may be connected to the service using dif-ferent physical channels. For instance, mobile clients may be able to access multiple network infrastructures and engage in “vertical handoffs” across different networks. From the perspective of the multicast service, the end-to-end path to individual clients may traverse different network infrastructures with their underlying physical-layer error protection mechanisms. For the purpose of our AL-FEC coding optimization, the net effect of the end-to-end channel capacity is parameterized in the form of a “reception coefficient” (RC). The RC parameter enables the application layer to use a memoryless erasure chan-nel model (see (10) below) to represent, for instance, lower layer FEC decoding performance in cellular net-works or packet losses on the Internet. The diversity of client channel capacities is modeled using probability dis-tributions. The utility is based on using an objective video quality measure to value client satisfaction across differ-ent possible adaptations of the video layers. A clidiffer-ent may have a specific playback profile, which could be elastic in the sense that the client may be willing to accept (or even reject) playback of various layer adaptations, with corresponding degrees of utility gained.
The allocation is performed to maximize a utility mea-sure that permits balancing between individual client utility and serving as many clients as possible. Our problem provides an answer to the question: given an application-layer multicast service bandwidth, a popula-tion of clients with heterogeneous end-to-end channels and devices (with different video playback capabilities), determine how best to provision fountain codes across the video layers in order to serve as many clients as possi-ble while meeting their video perceptual-quality demands. A byproduct of our problem solution is indicating which clients cannot be served to meet their desired viewing quality.
Our problem is fashioned to enable using standard foun-tain codes or their equivalent. We believe this is a more attractive proposition for multicast equipment/service engineering than using customized fountain codes. A client utility measure is defined based on a visual percep-tual model [33, 34] that admits mixed spatial-temporal-amplitude scalability. Our multicasting framework also offers the flexibility to admit other advanced video quality assessment models for mixed-scalability video. An advan-tageous feature of the proposed method is that the opti-mization complexity does not increase with the number of clients, a property particularly appealing for large-scale multicasts. Moreover, by employing statistical modeling of client reception capabilities, the optimization can be performed with different resolutions to trade off complex-ity and performance. The reliabilcomplex-ity of decoding the video layers in terms of outage probability (OP) is enforced to be commensurate with the probabilistic decoding nature
of rateless codes. Compared to the previous multicast optimization techniques based on fountain codes in [8, 10, 35], our work considers clients with heterogeneous channels and video-playback quality demands and bene-fits from a simple yet accurate model [36] of the client decoding outage probability. The QoE of the proposed multicast scheme has both guaranteed and best-effort aspects. The qualities of the different video layers are guaranteed, provided the client’s channel has commensu-rate capacities. The best layer the client can access also depends on the client population channel qualities and demand profiles. Another aspect of our framework is that it does not require altering the video bitstream or rate-less code, avoiding compatibility issues with existing and future standards, e.g., [37–39].
Additionally, we extend our previous work on video multicast optimization [40] to suppress temporal qual-ity fluctuations caused by source bit-rate variation. By utilizing a quality-aware optimization that admits source scalability, the proposed scheme provides a range of trade-offs between transmission resource utilization efficiency and stable client video playback quality. With some sim-plifications, we obtain a convex optimization problem. It turns out that the solution of the convex problem is a highly accurate approximation.
The rest of this paper is organized as follows. Section 2 is devoted to the general problem formulation as well as a convex formulation that admits lower computation with moderate loss in accuracy. In Section 3, we extend our formulation to a dynamic optimization that consid-ers client dissatisfaction due to video quality fluctuations. In Section 4, we assign values to the client utility parame-ters in our formulated problem using a recently developed video quality metric. The performance of the proposed optimization framework is evaluated in Section 5. Finally, conclusions are drawn in Section 6. The basic notations used in this paper are listed in Table 1.
2 Proposed multimedia multicast with heterogeneous clients
2.1 System setup
Table 1Basic notations
Symbol Definition
L Total number of embedded layers in a video stream.
Sl Number of source symbols per layer.
M Total number of client classes.
Nl Number of encoded symbols per layer.
Nmax Maximum amount of encoded symbols.
hm Highest video layer that clients in classmcan potentially
decode.
0≤δ≤1 Reception coefficient (RC) for a client.
fm(δ)/Fm(δ) RC probability distribution / cumulative distribution for
classm.
πm Prior probability for classmclients.
Plout Outage probability constraint for layerl.
P(S,N,δ) Outage probability.
Media server bandwidth (bit/s).
B Size of the encoded symbols (bits).
Tseg Duration of each video segment (s).
Rl Cumulative source rate up to layerl(bit/s).
Um(R) Utility-rate function of classm.
αm,l Incremental utility of layerlfor a client in classm.
Um Total utility for classm.
NMOS Normalized mean opinion score. I(x)
1, Ifxis true, 0, otherwise.
the spatio-temporal resolution of the preceding layer. We assume that successful decoding of any layer relies on successful decoding of all of its preceding layers. This implies that layers with lower indices are more important in the decoding process. Fountain coding [2] in the form of raptor codes is applied to every layer of the bitstream to provide protection against erasures caused by channel errors in the physical layer. The code for layerlreceives Sl source symbols and generates Nl encoded symbols. Unlike conventional Reed-Solomon codes, fountain codes can potentially generate an infinitely large code sequence, making the code rateSl/Nlelastic, or the code “rateless.” Generation of the rateless code sequence is determined by specifying a degree distribution and a random num-ber generator. Here, we exploit the elastic property by choosing the code rateSl/Nlto best suit an optimization objective. Standardized raptor codes [41] have been opti-mized so that a receiver that correctly receivesKl=Sl(1+ ) encoded symbols from the transmission can recover the message, with > 0 representing a small overhead typically below 2 %. Successful decoding is probabilisti-cally ensured by the total number of transmitted symbols successfully recovered by the receiver [36]. For practical
considerations, we assume thatNl encoded symbols are transmitted for thel-th layer such thatLl=1Nl ≤Nmax. Nmax, which we call the “service bandwidth,” is set as part of the service provisioning and may depend on the band-width available to the server, the temporal duration of the video segment, and other factors. For example, consider a video sequence which is partitioned into segments each with Tseg second duration and a server-allocated band-width of bit/s. Assuming that each symbol comprises B bits, the maximum number of available transmission symbols for each video segment is
Nmax=
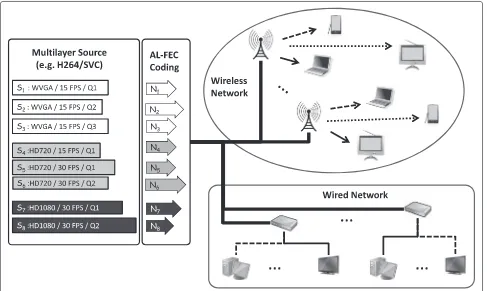
and can be chosen and even varied across segments to meet deadline requirements in streaming applications. The multicast clients are modeled byMclasses of media players, each class comprising players that are capable of decoding the media up to layer hm ∈ {1,. . .,L}, m = 1,. . .,M, and have commensurate display reso-lutions. Classes are indexed in increasing order h1 < h2,. . .,< hM. Clients with high-definition (HD) displays may demand decoding up to a HD layer, while smart-screen and portable device users may demand standard definition (SD) or a lower resolution to suit their appli-cation memory capacity and/or power consumption poli-cies. For example in Fig. 1, multicast transmission of a source with L = 8 layers to M = 3 classes of users is considered. Mobile and portable TV clients can poten-tially decode the video up to layersh1 = 3 andh2 = 6, respectively, while all 8 layers are decodable by HD clients (h3 = L = 8). Clients may also have different recep-tion capabilities, e.g., due to having different bandwidths, antenna systems, and radio propagation characteristics. A reception coefficient (RC) 0≤δ≤1 is used to model the client reception capability, where 1−δis the application-layer packet loss rate due to loss phenomena in the lower layers. We assume memoryless erasure channels (MECs) with independent and identically distributed (i.i.d.) era-sures between the server and the clients. A client channel with RC δc has an erasure rate of 1 − δc and receives anexpectednumber ofδcNmaxtransmitted fountain sym-bols in a transmission period of one video segment. Note that the actual number of the correctly received symbols depends on the channel symbol erasure events. We define the cumulative distribution function (CDF) of the channel quality of class mclients asFm(δ),m = 1,. . .,M. Addi-tionally, prior class probabilitiesπm > 0,m = 1,. . .,M withMm=1πm =1 are used to reflect the distribution of client population across different classes.
Fig. 1System setup. System setup for the proposed rateless-code-based video multicast
due to resource or channel limitations. For those clients that are served a particular layerl, the probability of fail-ing to decode the layer can be limited by settfail-ing outage probability constraintsPlout, 1 ≤ l ≤ L. While it is con-ceivable that the clients desiring the same layer might want different levels of decoding assurance, for simplicity, we assign one assurance level, in the form of probabil-ity 1−Poutl , to each media layer. Ideally, every additional encoded symbol drawn from a digital fountain improves the decoding probability of the code. Thus, if Nmax is allowed to be sufficiently large, all clients with non-zero RC will eventually achieve the targeted quality of service (QoS). However, in a more realistic scenario with finite transmission resourcesNmax, and any given set ofNl,l= 1,. . .,LwithLl=1Nl = Nmax, we can find a set of mini-mum needed reception coefficients (MNRCs)δlsuch that those clients with RCδc< δland desiring the layerlmedia will not reach the layer-decoding assurance probability 1−Poutl . Since successful decoding of all layersj=1,. . .,l is necessary in order to enjoy the media quality of layerl, we impose an unequal error protection (UEP) condition
0< δ1≤δ2≤. . .≤δL≤1. (2)
Later, we prove that this condition is necessary for optimal utilization of transmission resources while simpli-fying the utility function.
2.2 Utility function
Letum,l be the utility for classmclients decoding layerl with decoding failure probability guaranteed to be below a given outage probability threshold. Our “utility” differs from the conventional average utility found in best effort QoE formulations, wherein utilities associated with unac-ceptable decoding failure probabilities are included in the utility averaging.um,lis a function of the number of clients who are able to decode layerlunder the guarantee, as well as the amount of utility they gain,
um,l=αm,l 1
0
fm(ξ)I ⎛ ⎝ l
j=1
1−P(Sj,Nj,ξ)≥1−Plout
⎞ ⎠dξ.
(3)
Here,fm(δ)is the RC probability distribution of clients in classm,I(.)is the indicator function,P(Sj,Nj,δ)is the probability of failing to decode the fountain code in layerj, withSjsource symbols andNjtransmitted symbols, for a client with RCδ, andαm,lis the incremental utility gained by a classmclient after decoding layerl, provided that all preceding layers are successfully decoded.αm,lis obtained from the utility-rate function of each client class,Um(Rl), i.e.,
We show in Section 4 a specific way of using this function to optimize viewing experience. In (4), Rl = l
k=1Sk/Tsegis the cumulative source symbol rate up to layerlwithR00 andUm(0)0,∀m. The product term within the indicator function in (3) provides the probabil-ity of successfully decoding all layers up to and including layerl. With the MNRCsδldefined earlier, we can write l
We obtain the utility of classmclientsUmby accumu-lating the guaranteed utility of all useful layers. However, we should make sure that the incremental utilities αm,l for enhancement layer l contributes to Um only when the clients can reliably decode the preceding layers. The UEP conditions embodied in (2) represent the hierarchi-cal decoding dependencies of the shierarchi-calable video layers and provide the needed assurance.
Not all the video layers can be useful for the clients of a class due to screen resolution or other playback con-straints. Therefore, in (6), hm ≤ L denotes the highest video layer which can contribute to the utility of classm clients.
Finally, the overall utility is obtained by summing over the utilities of all client classes using the prior class prob-abilitiesπm>0,m=1,. . .,M, bound on the deliverable utility and only depends on the media source and the priors. This bound is achiev-able if the MNRCs δhm,m = 1,. . .,Mare small enough so that no client has to settle for a quality layer lower than their maximum desired quality. However, this may not be possible since the service bandwidth Nmax and the OP constraints prevent the MNRCs from becoming arbitrarily small. As a result, clients with poor RCs may end up being not served their most desired video qual-ity, or even worse, being unable to decode the base layer.
Utotal is to be maximized, as shown below. We empha-size that the problem at hand is efficient utilization of the multicast service bandwidthNmaxto provide guaran-teed utility to individual multicast clients while serving as many clients as possible. However, for a given Nmax and set of client RC distributions, the problem solution may not be able to service a portion of the clients with exceedingly poor channels. These clients may be served by increasingNmax or providing alternate solutions, e.g., unicast (re)transmission, peer-assisted repair [42]. Such solutions are outside the scope of this paper.
2.3 Outage probability
LetP(S,N,δ)be the probability that a client fails to decode theSinformation symbols, given the client’s RCδand the number of transmitted symbolsN. The performance of a rateless decoder in decoding a source withSinformation symbols after receiving K code symbols is given by the decoding failure probability functionPf(S,K). Assuming interleaving is used if needed, we consider a memory-less erasure channel (MEC) with symbol erasure rate 1− δ ∈[ 0 , 1] assumed to be fixed during the transmis-sion period of a video segment. For a given number of transmitted code symbols, the outage probability can be obtained from
P(S,N,δ)=EK|N[Pf(S,K)] (8)
with erasure probability 1−δand i.i.d. erasure events, and Kis a binomial random variable. Moreover, the decoding failure probability of rateless codes can be modeled by [23]
Pf(S,K)=
1, ifK≤S,
abK−S. ifK>S, (9)
P(S,N,δ)=0.5 exp
−δ(N−S/δ)H
S(1−δ)
forN ≥S/δ.
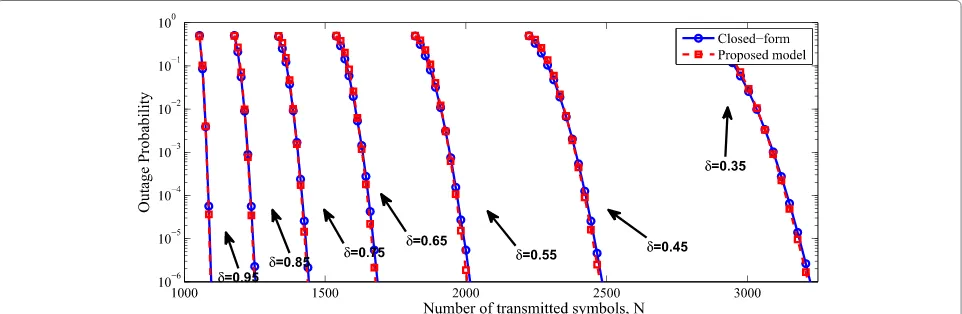
(11)
Note thatH≈1.8 for the rateless codes used in [23]. As shown in Fig. 2, this model accurately estimates the outage probability (10) for various channel parameters.
In summary, we aim to maximize the utility in (7) sub-ject to the bandwidth and the UEP constraints defined in Section 2.1. The first term in (7) is not a function of the optimization variables, MNRCs δl, l = 1,. . .,L. Hence, the utility maximization can be transformed into the following utility loss minimization problem:
Problem 1.(General formulation)
min
{δl}Ll=1 M
m=1 hm
l=1
ˆ
αm,lFm(δl)
subject to
UEP constraints:δ1≥0, (12)
δl−δl+1≤0, l=1,. . .,L−1, δL≤1,
BW constraint: L
l=1
Nl ≤Nmax.
We first consider using exhaustive search to solve Problem 1. The set of all δl,l = 1,. . .,L satisfying the UEP constraints forms anL-simplex inLdimension. For exhaustive search, the simplex volume is discretized using an L dimensional cubic lattice L with |L| points. For each point inL, say δl, l = 1,. . .,L, we first obtain the required per layer transmission resourcesNjin a forward procedure using
Nl= ⎧ ⎪ ⎨ ⎪ ⎩
P−1S1,δ1,Poutl
l=1,
P−1
Sl,δl, 1− 1−P l out l−1
j=1[1−P(Sj,Nj,δl)]
l≥2,
(13)
whereinP−1(S,δ,p)is the inverse outage probability func-tion which yields the required number of transmitted symbols N as a function of the number of source sym-bols S, the reception coefficient δ, and the designated outage probability constraintp. A convenient closed form expression ofP−1(S,δ,p) is obtained by rearranging the terms in the approximated OP model (11). HavingNj,j= 1,. . .,Lin hand, the bandwidth constraint is checked. If the constraint is satisfied, the cost function is calculated; otherwise, the cost is set to infinity. For a sufficiently fine discretization, we regard the minimum cost point inLas the “optimal” solution. Note that by using the bandwidth constraint in the above manner, the exhaustive search can be conducted overL−1 dimensions. The complex-ityO(DL−1)can be large, whereDis the number of grid points on each dimension.
After obtaining the optimal MNRCs,δ∗l,l = 1, ..,L, the corresponding transmission resources per layerNl∗,∀lare obtained. Clients whose highest media quality demand is layerlbut whose RCs are belowδ∗l have to settle for the lower quality of layeri whereiis the largest layer index withδi∗no greater than the client’s RC. Ultimately, clients with RCs belowδ1∗are dropped from the multicast as they cannot decode the base layer with the assured probability. In contrast to other formulations such as [16] in which clients are individually represented in the optimization, here multicast clients are grouped and represented by the distributionsFm(δ)and associated priorsπm. Conse-quently, the complexity of the proposed optimization is independent of the number of clients. Moreover, client-to-server feedback for the purpose of updating the RC
distributions could be managed without feedback implo-sion, e.g., the server could broadcast a threshold value and clients with a locally generated random number above the threshold would send their RCs to the server. This threshold is adapted to the multicast population size such that the server is not overwhelmed by excessive amount of feedback messages. The RC distributions could be parametrized or discretized with a suitably chosen reso-lution to trade-off between computational complexity and accuracy.
2.4 Simplified formulation
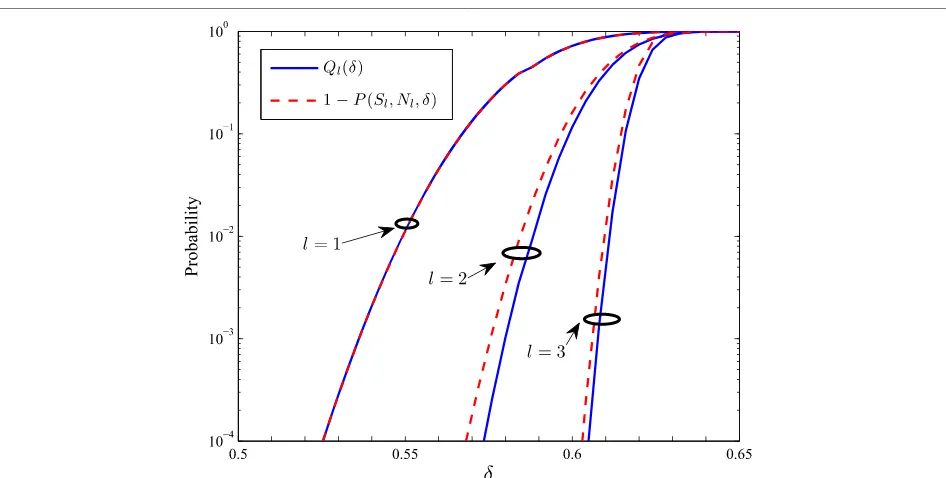
Next, we exploit simplifications of the outage probabil-ity constraints to obtain a problem formulation that is amenable to solution using gradient search. LetQl(δ) = l
j=1
1−P(Sj,Nj,δ)
be the probability of receiving lay-ers 1 to l. Ql(δ) is monotonically non-increasing with l and monotonically non-decreasing withδ. Moreover, due to the fast-decaying nature of the decoding failure prob-ability (9),Ql(δ)exhibits an abrupt transition forδin the neighborhood ofδl. This can be seen from Fig. 3 which showsQl(δ)and [1−P(Sl,Nl,δ)] for a closely spaced set ofδl’s. It can be seen from Fig. 3 that in the neighborhood ofδl, the factorQl−1(δ)=jl−=111−P(Sj,Nj,δ)
is nearly one and the transition behavior ofQl(δ)is dominated by
1−P(Sl,Nl,δ)
. Hence, we can use the approximation
l
j=1
1−P(Sj,Nj,δl)
≈1−P(Sl,Nl,δl). (14)
Consequently, for a given set ofδl,l=1,. . .,L, the per-layer transmission resourcesNjcan be obtained from
Nl =P−1
Sl,δl,Poutl
, l=1,. . .,L. (15)
Using (11) to estimateNl as a function of the outage probability, we have
Nl =Sl/δl+τlH
1−δl δl
, (16)
where
τl= H
−Slln
2Poutl
, Poutl ≤0.5. (17)
Using this, the bandwidth constraint becomes
L
l=1
Sl/δl+τlH
1−δl δl
≤Nmax, 0<Plout≤a.
(18)
As a result, a new optimization problem can be formulated.
Fig. 3Outage probability approximation. A comparison betweenQl(δ)(solid blue line) and [ 1−P(Sl,Nl,δ)] (dashed red line) for the different layers of
Problem 2.(Simplified formulation)
Unlike Problem 1, first order derivatives of the BW constraint can now be easily obtained. Hence, gradient descent algorithms withO(Llog(1/e))complexity, where e is the required accuracy, can be deployed to solve Problem 2. Since Problem 2 may have multiple local min-ima, the quality of the gradient descent solution depends on the algorithm initialization. In the next section, a con-vex approximation to Problem 2 is obtained. In Section 5, we present numerical results demonstrating the effective-ness of the convex initialization to the gradient search.
2.5 Convex formulation
Problem 2 is not convex. We show that, by making further simplifying approximations, the problem can be recast into a convex optimization problem. In the first step, we propose the following parametric CDF approximations. Form=1,. . .,M,
Fm(δ)≈Fm(δ)=cmδpm+1−cm, 0<cm≤1, pm>0, 0≤δ≤1,
(19)
where pm and cm are model parameters obtained by regression. In Section 5, we investigate the ability of the above approximations to represent client RC distribu-tions.
Next, we further simplify the outage probability con-straints. We use the following simpler model [36] for the outage probability in order to estimateNlfor each layer:
Nl≈
Sl+logbPlout/a δl
, 0<Plout≤a, (20)
where a and b are obtained from the decoding failure probability function of the rateless code (9). Using this, the bandwidth constraint becomes
After introducing a parameter transformation θl = 1/δl,∀l, we obtain
We prove that Problem 3 is convex in the Appendix. In Section 5, we examine the three problem formulations numerically in different application scenarios and assess their accuracies.
3 Utility smoothing
Source rate and/or service bandwidth fluctuations across consecutive video segments could result in variations of the optimized MNRCs. Hence, clients with RCs close to the MNRCs may experience quality variations across suc-cessive segments. One may encode video segments of longer durations to reduce rate fluctuations at the cost of additional server/client-terminal complexity, memory requirements, and delay [43, 44]. Below, we reformulate our problem to include suppression of client dissatisfac-tion due to quality variadissatisfac-tions.
Major quality variations are due to unwanted switch-ings between different layers. This mainly results from the client’s RC crossing the MNRC of a layer subscribed by the client. For example, if a client’s RC is always above the MNRC for the base layer, no frame dropping would occur (within the statistical assurance of the base layer out-age probability constraint). Below, we extend our problem formulation to include suppression of MNRC variation. Numerical results shown later demonstrate the effective-ness of the suppression in reducing quality switchings, and more specifically, base-layer outage occurrences.
Let us assume that the client RC distributions do not change significantly across consecutive video segments, i.e., Fm(k)(.) ≈ Fm(k−1)(.),∀m, where k is the video seg-ment index. Similar to (4), we define the increseg-mental dissatisfaction coefficientsβm,l ≥ 0 to model the client disappointment for not decoding layer l of the current video segment that was successfully decoded previously. Consequently, the disappointment of a classmclient who enjoyed layerlof the previous video segment but can only decode the current video segment up to a lower layerˆl<l is proportional tol
D(k)=M rent video segments, respectively. SubtractingD(k) from the total utility in (7) to instrument a variation-induced penalty term leads to the following optimization problem.
Problem 4.(Dynamic optimization)
0 ≤ λ ≤ 1 effects a balance between the two utility loss terms. A smallλtends to prevent the MNRCs from increasing excessively across two consecutive video seg-ments. However, a longer-term gradual increase of the MNRCs due to variations of the RC distributions Fm(.) and source bit rate is still possible. However, an exceed-ingly small λmay significantly reduce the overall utility provided to the clients. Hence, a judicious choice of λ would avoid letting clients with the worst channels from unduly influencing the solution.
4 Utility optimization using a perceptual quality metric
The proposed multicast optimization scheme can be tailored to fit different application scenarios. Here, we aim to maximize the clients’ subjective viewing experi-ence by setting the marginal utility parametersαm,lusing a perceptual quality model that was developed using subjective-viewing test results [33, 34]. Although peak signal-to-noise ratio (PSNR) [45] has been widely used as a measure of video quality, low correlation between PSNR and video quality ratings provided by human viewers— commonly reported as mean opinion scores (MOSs)— is reported. The shortcomings of PSNR are more pro-nounced when comparing video playback at different spatial and temporal resolutions. More versatile objective quality measures have been proposed as estimates of sub-jective quality ratings. The obsub-jective video quality metric introduced in [33] and [34] provides a normalized MOS
(NMOS) that can be used to quantify the quality between different spatial, temporal, and quantization resolutions
NMOS(s,f, PSNR)=
Here,sandf represent the number of pixels and frame rate, respectively, whilesmaxandfmaxare their maximum values.bs,bf, andbp are model parameters that depend on the video content [33, 34]. This NMOS model is con-veniently used to illustrate the method proposed herein. More elaborate quality estimation methods such as the video quality metric (VQM) [46] algorithm may be advan-tageously employed. We should mention that a slightly advanced version of the NMOS model used in this work was published in [47].
As an illustration, consider a scenario wherein the high-est video layer successfully recovered by a terminal has a spatial resolution lower than the playback capability; specifically, a HD terminal receiving a SD video. The ter-minal may display the SD video as received in the middle of the HD display or adapt the video to the display by upsampling. The perceptual quality metric in (23) is used as a yardstick to compare the perceptual effects of various possible adaptations.
NMOSm,l, non-decreasing with layer index l, repre-sents the highest NMOS corresponding to the best pos-sible adaptation—within the capabilities of the class m terminals—that can be performed on the media up to layerl≤hm. Recall thathmis the highest layer of the video stream that class m terminals can potentially decode. Furthermore, we may also model client playback prefer-ences that can be set independently of the achieved video quality. For example, a certain application may require the spatial resolution not to be lower than some specific level. We may use preference weights 0 ≤ Wm,l ≤ 1, non-decreasing with respect to index l, to map NMOS to multicast utility while accounting for clients’ playback preferences. If class m users are unwilling to settle for media playback at any layerl< hm, thenWm,l =0 ∀l < hm. Thus, we define our utility-rate function as
Um(Rl)=Wm,lNMOSm,l, (24) which can be applied to (4) to calculate the marginal utility coefficientsαm,l≥0.
5 Numerical simulations
Table 2Specification of H.264/SVC coded video bitstreams
Video Layer Resolution(pixels) Frame rate Bit rate Y-PSNR(frames/s) (kbps) (dB) Ssymbols)l(source
City
1 QCIF 176×144 15 104.3 33.4 261 2 CIF 352×288 30 548.6 33.5 1111 3 4CIF 704×576 60 3226.2 33.5 6694
Ice
1 QCIF 176×144 15 84.6 32.2 212 2 CIF 352×288 30 378.9 34.9 736 3 4CIF 704×576 60 2610.4 38.6 5579
Crew
1 QCIF 176×144 15 150.8 37.3 377 2 CIF 352×288 30 758.4 37.1 1519 3 4CIF 704×576 60 3560.4 37.7 7005
denotes the number of source symbols in each layer over aTseg=1 s time segment, and each symbol comprises 50 bytes.
The bit rates given are for each layer. The OP constraints Pout=$Pout1 ,P2out,Pout3 %=$10−4, 4×10⁻⁴, 5×10⁻⁴%are enforced. An equal error protection (EEP) scheme is used as the baseline for the performance comparison. In the EEP scheme, the transmission resources allocated to each media layer is proportional to the relative size of that layer in the source bitstream, i.e.,
Nle= NmaxL Sl k=1Sk
l=1,. . .,L.
We use the following metrics to evaluate the perfor-mance gain and efficiency of different schemes, respec-tively,
η↑ U−Ue Ue
%, ε U
Uopt
%, (25)
whereUis the utility delivered to the clients,Uoptis the maximum attained by using the optimal MNRCs, andUe corresponds to the utility of the EEP scheme. The interval 0 < δ ≤ 1 is partitioned into small sub-intervals and an exhaustive search is performed to find the MNRCsδl,l= 1,. . .,Land subsequentlyUopt. Nevertheless, this process could be computationally expensive for a large number of sub-intervals and source layers. To obtain a sub-optimal solution with much lower complexity, first, the convex problem (Problem 3) is solved. Next, a constrained gra-dient descent (GD) algorithm is deployed to solve the simplified formulation (Problem 2) using the convex solu-tion as a starting point. The performance measures of these two solutions are superscripted “CV” and “GD,” respectively. The multicast clients may experience a wide variety of channel conditions depending on fading and their distance to the transmitting station [48]. For wide-area cells, the range of channel qualities can be expected to be broader than reported in [48]. Thus, the uniform distribution and truncated Gaussian mixtures in Fig. 4 are selected to reflect distinct types of client RC statis-tics with different balances between the number of clients with poor and good channels. One thousand clients are considered for these scenarios. In the multi-class scenario, each class inherits a portion of clients based on the priors πm,m = 1,. . .,M. Next, samples of the client reception coefficients (RCs) are generated for each distribution.
5.1 Single-class scenario
In this scenario, all clients are assumed to be capable
of decoding all three layers. Hence, M=1 and h
h1 = L=3. Table 3 exhibits the optimization results for Nmax=13, 000 symbols.
Fig. 4Class RC distributions. Prototypical (top) PDFs and their corresponding (bottom) CDFs. Approximated CDFs based on (19) are depicted in
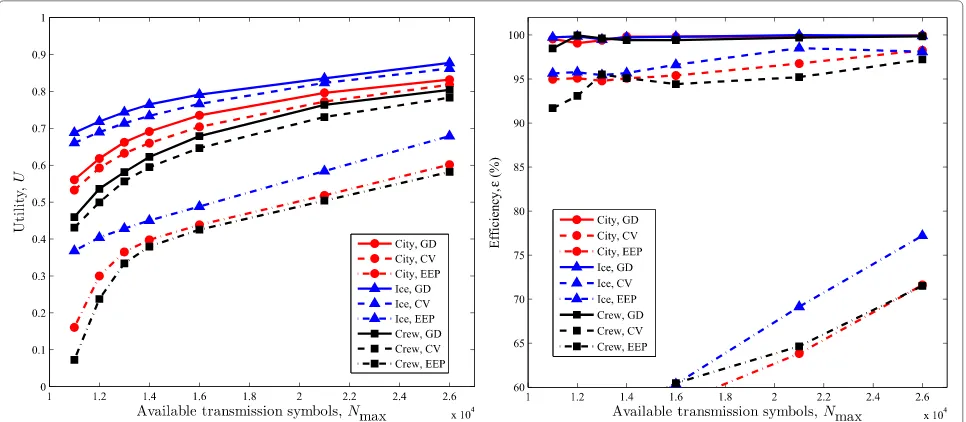
The performance metrics are evaluated over four crafted utility settings. On average, the proposed opti-mization manages to increase the utility by a factor of more than 2 compared to the EEP solution. The EEP solution is highly inefficient when the majority of clients experience poor channels, as in the -III distribution in Fig. 4. Note that the solution of the convex opti-mization yields an average efficiency of 95.25 %. Adding the GD search increases the efficiency to 99.50 %. The optimization results as well as the solution of the EEP approach for different service bandwidth constraintsNmax are depicted in Fig. 5. The metric values are averaged over the four distributions and utility settings (the 16 cases in Table 3).
Due to the high efficiency of the initial convex solu-tion, the GD step could be omitted in order to reduce computation without significant performance penalty.
5.2 Multi-class scenario
Next, we consider a scenario withM = 2 client classes. The class 1 clients with CIF resolution displays may only decode the base layer and the first enhancement layer, i.e., h1 = 2. The clients in class 2 have 4CIF resolution dis-plays and decoders capable of decoding the entire video stream, i.e., h2 = 3. The four sample distributions in Fig. 4 are used to model the client RC distributions of both client classes, resulting in 16 possible distribution pairings. For each pair of distributions, the simulation is performed with different prior values. The utility param-eters are obtained using the perceptual quality metric in (24). The preference parameters are assumed to beWm,l = 0.9hm−l,l≤h
m. The NMOS parameters for the test video sequence are extracted from [33] and [34]. The simula-tion results are shown in Table 4 in terms of metric values averaged over the 16 pairings.
On average, the initial allocation provided by the con-vex approximation achieves 97.57 % efficiency. Using the GD algorithm, the efficiency is increased to 99.80 %. Similar to the single-class scenario, most of the poten-tial performance gain can be obtained using the convex optimization.
5.3 Reduced-feedback scenario
It is worthy to investigate the optimization performance when client RC statistics are collected only from a portion of the multicast clients. Limiting channel state informa-tion feedback could be an effective measure against feed-back implosion at the server and for maintaining a low error rate for a multiple access feedback channel. For all 16 pairings of the RC distributions in Fig. 4 for the class 1 and 2 clients, an ensemble of sizenm =1000,m= {1, 2} sam-ples are drawn from each distribution to represent 1000 clients in each class (π1 = π2 = 1/2). The performance is evaluated as a function of the fraction of clients from
each class that successfully send their RC and media player capability information to the server—in terms of client-to-server feedback ratio (CSFR), 0 ≤ CSFR ≤ 1. This experiment is repeated 100 times for every CSFR and dis-tribution pairing to ensure accuracy, especially for small CSFR values. The histograms of the received RC feed-back messages are used as estimates of the actual class RC distributions and employed in the optimization. The performance is compared to the scenario in which full knowledge of all client RCs is revealed to the server, i.e., all clients successfully feedback their RCs to the server (CSFR=1). For each CSFR, the performance metrics of all three tested video sequences are combined (4800 sim-ulation runs per CSFR) and the results are illustrated in Fig. 6.
The proposed optimization demonstrates good toler-ance to limited RC feedback. Optimization based on RC feedback from only 5 % of the clients still provides perfor-mance close to 100 % feedback. Both convex optimization and the GD algorithm maintain their performance in the limited feedback regime. For a smaller pool of 100 clients per class, the CFSR needed goes up to about 20 %. How-ever, the small number of feedback clients, 20 in this example, should be manageable. We believe this robust-ness comes from the ability of the parametric CDF in (19) to capture the general characteristics of the client RC distributions.
5.4 Variable rate source scenario
Performing a resource allocation optimization repeatedly for each video segment means that computation intensity depends on segment duration Tseg. One way to reduce computation is to use a large Tseg though Tseg may be limited by other considerations such as media bitstream access and formatting requirements. Another way is to optimize the video less frequently by using longer-term statistics. In this section, we aim to quantify the per-formance penalty incurred when the optimization uses longer-term statistics as compared to segment by segment optimization. Note that a video bitstream may exhibit large bit rate variations due to intra-coded frames. Longer video segments can reduce the rate fluctuations at the cost of additional buffering. Let us considerR(lk)=S(lk)/Tsegas the source rate for layerlof video segmentk with dura-tionTsegseconds andS(lk)source symbols. We model the source bitstream variations across different segments by
S(lk)=Sl
1+γl(k)
, (26)
et
al.
EURASIP
Journal
o
n
W
ireless
C
ommunications
and
Networking
(2015) 2015:260
Page
13
of
21
Table 3Performance of optimized allocation for the single-class scenario (Nmax=13, 000,αlα1,l,∀l)
Utility settings
City Ice Crew
RCδ Distribution
Performance (%) Efficiency (%) Performance (%) Efficiency (%) Performance (%) Efficiency (%)
[α1 α2 α3] η
CV
↑ ηGD
↑ εCV
εGD
ηCV
↑ ηGD
↑ εCV
εGD
ηCV
↑ ηGD
↑ εCV
εGD
-I
[ 1/3 1/3 1/3] 114.40 114.40 100.00 100.00 71.22 71.22 100.00 100.00 113.82 113.82 100.00 100.00
[ 1/4 1/4 1/2] 81.74 81.74 100.00 100.00 52.40 52.40 100.00 100.00 75.89 75.89 100.00 100.00
[ 1/2 1/4 1/4] 144.48 144.48 100.00 100.00 87.18 87.18 100.00 100.00 152.44 152.44 100.00 100.00
[ 4/7 2/7 1/7] 176.61 176.61 100.00 100.00 105.33 105.33 100.00 100.00 188.40 188.40 100.00 100.00
-II
[ 1/3 1/3 1/3] 15.83 20.53 96.10 100.00 14.43 22.55 93.37 100.00 17.96 25.36 94.10 100.00
[ 1/4 1/4 1/2] 11.58 16.79 95.54 100.00 8.37 16.44 93.06 100.00 17.91 21.34 97.18 100.00
[ 1/2 1/4 1/4] 22.49 27.82 95.83 100.00 20.06 26.68 94.77 100.00 24.52 32.87 93.71 100.00
[ 4/7 2/7 1/7] 27.96 31.48 97.32 100.00 26.12 31.10 96.20 100.00 28.79 38.39 93.06 100.00
-III
[ 1/3 1/3 1/3] 281.10 318.43 90.42 99.27 379.38 395.35 96.77 99.99 209.62 210.07 98.75 98.89
[ 1/4 1/4 1/2] 167.02 213.91 84.47 99.30 238.25 293.25 86.01 99.99 113.42 154.63 83.81 99.99
[ 1/2 1/4 1/4] 358.66 395.93 92.49 100.00 434.55 454.58 96.39 100.00 326.65 336.00 97.85 100.00
[ 4/7 2/7 1/7] 424.19 466.78 92.49 100.00 514.46 530.42 97.47 100.00 387.60 398.29 97.85 100.00
-IV
[ 1/3 1/3 1/3] 38.68 54.54 89.73 100.00 32.92 40.35 90.02 95.04 32.22 34.00 95.58 96.87
[ 1/4 1/4 1/2] 27.40 27.83 91.47 91.78 22.02 31.10 93.07 100.00 23.06 24.59 97.07 98.28
[ 1/2 1/4 1/4] 61.61 72.15 93.88 100.00 50.69 53.27 95.22 96.85 41.34 59.93 88.37 99.99
[ 4/7 2/7 1/7] 78.11 83.92 96.84 100.00 61.30 70.15 94.80 100.00 57.03 72.07 91.01 99.72
Fig. 5Single-class optimization results. Average utility traces (left) and efficiency of the single-class video multicast optimization (right) for various transmission budgets
becomes a constant-rate source (CRS) and the optimal allocation is independent of any particular video segment k provided that the service bandwidth, the utility coeffi-cients, and client RC distributions are fixed. The following efficiency measure quantifies the performance penalty due to performing the resource allocation optimization using average statistics,
εCRS = UCRS
(k)/U(k). (27)
Here, . denotes averaging over segments. UCRS(k) is the utility achieved for thek-th video segment when the resource allocation optimization is performed only once based on average rate-distortion statistics. Conversely, U(k) is the maximum attainable utility when a separate resource allocation optimization is conducted for each video segment. The maximum number of transmitted packetsNmaxand the client RC distributions are assumed to remain unchanged during the entire multicast. For everyγmaxand 16 pairings of the candidate distributions, 100 samples of γl(k),∀l are generated to represent vari-able source rates for 100 video segments. The results are plotted in Fig. 7 as a function of the max-to-min rate ratio (MRR) for the video rates generated by (26) where MRR 1+γmax
1−γmax.
As expected, optimization based on long-term statis-tics results in lower efficiency. However, the performance penalty is moderate sinceεCRS remains at above 90 % effi-ciency even for a rate variation as large as MRR = 19. We should mention that the efficiency εCRS of the EEP solution remains below 65 % for Nmax = 15, 000 and Nmax = 19, 000, respectively, reconfirming the poor per-formance of the EEP solution for quality-aware multicast transmission.
5.5 Multi-segment quality smoothing
et
al.
EURASIP
Journal
o
n
W
ireless
C
ommunications
and
Networking
(2015) 2015:260
Page
15
of
21
Table 4Simulation results forM=2 classes andL=3 layers (π2=1−π1)
Nmax π1
City Ice Crew
Performance (%) Efficiency (%) Performance (%) Efficiency (%) Performance (%) Efficiency (%)
ηCV
↑ ηGD
↑ εCV
εGD
ηCV
↑ ηGD
↑ εCV
εGD
ηCV
↑ ηGD
↑ εCV
εGD
10,000
0.1 139.75 185.02 88.71 99.41 94.55 95.79 98.36 99.25 729.00 840.57 93.21 97.99
0.3 148.06 180.00 92.00 99.71 91.98 93.47 98.59 99.59 694.42 774.50 96.11 99.23
0.5 164.39 193.34 93.25 99.99 97.00 100.11 97.52 99.45 711.10 793.00 96.85 99.77
0.7 187.93 222.15 92.66 100.00 116.24 118.15 98.30 99.34 754.36 842.38 96.01 99.09
0.9 230.60 284.35 91.00 100.00 158.42 159.80 99.24 99.98 868.80 1001.10 92.76 97.69
15,000
0.1 88.06 95.91 95.54 99.70 86.72 94.33 95.20 100.00 99.03 103.91 97.26 99.98
0.3 83.34 90.59 95.81 99.91 81.91 87.50 96.32 100.00 90.59 94.45 97.59 99.84
0.5 90.77 95.43 97.05 99.94 86.43 90.20 97.47 100.00 93.05 96.36 97.77 99.62
0.7 108.87 111.70 98.01 99.84 100.93 103.02 98.56 99.97 106.31 109.35 98.30 99.88
0.9 152.94 154.14 99.28 99.89 137.00 138.04 99.37 99.92 134.99 138.98 98.33 99.98
19,000
0.1 78.32 86.74 94.92 100.00 47.77 50.33 98.24 100.00 102.87 110.00 95.79 99.95
0.3 74.52 80.94 95.86 100.00 49.81 51.74 98.68 100.00 93.00 97.82 96.92 99.98
0.5 79.53 83.96 97.03 100.00 54.77 56.13 99.07 100.00 95.44 98.64 98.00 99.95
0.7 93.92 96.50 98.26 99.98 63.90 64.76 99.40 100.00 108.67 110.06 98.62 99.95
0.9 128.10 129.14 99.33 99.89 80.97 81.63 99.61 99.98 142.63 144.29 99.35 99.97
Fig. 6Optimization results for the reduced-feedback scenario. Performance of the proposed optimization as a function of the fraction of clients that successfully feedback their channel state information to the server for convex optimization (dashed lines) and GD method (solid lines)
Here, we aim to optimize the provided utility under the constraint of limited service bandwidthNmax. Addi-tionally, failure in decoding the base layer is considered unacceptable for both classes. Therefore, we set the dis-satisfaction coefficientsβm,1 = 1 ∀mand the rest of the dissatisfaction coefficients to zero. The server is assumed to transmit Nmax = 11, 000 symbols for each segment, where each symbol consists of 16 bytes.
The video segment size, the optimized utility for various values ofλ, and the optimized MNRCsδl(k),l = 1,. . ., 3 are plotted as a function of the segment indexkin Fig. 8. This video sequence exhibits a significant rate increase at
the fourth segment. This raises the MNRC for the base layerδ1(k)when the quality fluctuation suppression term is nulled (λ=1). By increasingλ, the optimization increas-ingly penalizes solutions that allow the base layer MNRC to increase. Hence, the portion of clients that face tempo-ral outage is reduced and a more stable visual experience is provided. This is reflected in lower δ1(k) values with smaller variations. Given a fixed service bandwidth and considering the fact thatβm,l = 0 forl ≥ 2, the reduc-tion in the MNRC fluctuareduc-tions for the base layer comes at the cost of increased variations of the MNRCs for the enhancement layers, as reflected in theδ2(k)andδ3(k)traces
Fig. 7Long-term statistics-based optimization results for a variable-rate source. Optimization efficiency based on the long-term statistics of a variable-rate source forNmax=15, 000 (left) andNmax=19, 000 (right). Sources with different max-to-min rate ratios (MRRs) are emulated by
Fig. 8Dynamic optimization statistics. Traces ofavideo segment size,bprovided utility calculated using (7), andc–eoptimized MNRCs for the base layer and the enhancement layers after solving Problem 3 withNmax=11, 000
in Fig. 8d and e. Note that the achieved utility is closer to the upper-boundUmaxfor the video segments with fewer source symbols.Umaxdepends on the video content and its viewing quality but not the source rate. However, the
distribution of clients with marginal RCs. Additionally, we observe that the penalty term with different weights (1−λ)hardly affects the utility traces except for the fourth segment that contains the sudden rate increase.
For the particular choice ofβm,lvalues in this scenario, the average fraction of clients that successfully enjoys the base layer in one video segment but fails to decode the base layer in the next segment can be obtained by aver-aging the dissatisfaction measure (22) over the video seg-mentsD= D(k). This metric is the marginal probability that a satisfied user encounters frame drops or freezes in the next video segment. Table 5 illustratesDfor various service bandwidths andλ. As expected, higher bandwidth and smallerλboth contribute towards a more stable video quality experience. Table 5 also provides data forZwhich measures the percentage of clients that experience outage in decoding the base layer at least once during the nine video segments. Due to the client RC distributions model-ing a significant portion of clients with poor channels, and a notable rate increase beyond the fourth segment, there is always a portion of clients that experience outage for a constantNmax. When the variation suppression termDis disabled, the outage percentage remains stubbornly high even as the service bandwidth is substantially increased. However, a lower outage rateZis attainable by increasing the penalty weight 1−λ. If segments 4 to 9 are excluded from the statistics forNmax =11, 000,Zis reduced from 16.03 to 3.24 % forλ=1. However, forλ=0.3, exclusion of those segments reducesZ slightly from 3.6 to 2.85 %. This signifies the performance of the proposed dynamic optimization in reducing the sensitivity of client dropout to high-rate video segments.
The outage statistics based on the Z measure for
the EEP solution is 19–30 % higher than the pro-posed dynamic optimization. Figure 9 provides the out-age burst-length statistics assuming that client channel quality is unchanged during the transmission of the nine video segments. The results are normalized to
the number of maximum length outage incidents for the EEP scenario. It is clear that the proposed opti-mization significantly reduces the number of outage incidents.
Furthermore, we investigate the performance of the pro-posed algorithm for a client with time-varying RC. We consider a client with a poor average RCδc = 0.2. Based on the MNRC δ1(k) traces in Fig. 8c, the viewing expe-rience of this client would be disturbed by base-layer outage. We use truncated normal distributions with mean μ = 0.2 and different standard variations σ to model the probability distribution of its RC during the transmis-sion of all nine segments. Examples of these distributions are depicted in Fig 10. We calculate the frame-freeze rate (FFR), defined as the percentage of frames not received and may be replaced by the last decoded frame. The results are depicted in Fig. 11. Using the proposed opti-mization, the FFR is reduced by as much as 11 and 7 % for narrow RC distributions (σ < 0.02)and wide distri-butions (σ > 0.02), respectively. Note that the FFR for the EEP solution is more than 99 % for this client due to significantly higher values of the corresponding δ(1k) traces.
In practice, it may be possible to vary the service band-widthNmax with the source symbol rate. For instance, a server simultaneously serving multiple independent video streams can exploit a well-known advantage offered by statistical multiplexing: the total source rate fluctuates far less than the individual source rates. In such case, allowing Nmaxto vary, in conjunction with the proposed method, would enable suppression of outage to negligible levels. The MNRCs can also be transmitted as a side information with negligible cost. Therefore, a client can select a video layer for playback whose MNRC is at a safe margin below the client’s RC. The client may use the MNRCs for the pre-vious segments as input to an algorithm that selects the actual enhancement layers for decoding and display, with the aim to produce the best viewing experience. MNRC
Table 5Dis the percentage of clients that experience outage in decoding the base layer.Zis the percentage of clients that experience outage at least once over the 9 video segments
Nmax D
(%) Z(%)
Fig. 9Outage burst statistics. Outage burst statistics for different solutions of the dynamic optimization,Nmax=11, 000
smoothing helps the algorithm to achieve a good viewing experience.
6 Conclusions
Considering heterogeneity of client channels and their terminal capabilities, we introduced a QoE optimization framework for video multicast that benefits from the flexibility offered by scalable video coding and fountain coding. The client’s ability to decode different video qual-ity layers is exploited to maximize the overall utilqual-ity of the multicast transmission. Utility is formulated based on a perceptual quality metric that can differentiate between various possible adaptations of a multilayer video stream with a combination of spatial, temporal, and granular scalability. The optimization effects a balance between QoS-guaranteed service and best-effort service. Catering
to the probabilistic decoding nature of rateless codes, out-age probability constraints are applied to guarantee that the video quality layers are received with a high level of assurance. Clients that cannot be served meeting such guarantees may be served with a lower playback quality from the lower video layers. Clients demanding high-quality playback but present in small numbers may be similarly treated. Clients with exceedingly poor channels may be dropped from the multicast. On the other hand, given a sufficient transmission rate, clients are served the highest quality playback level they desire. The optimiza-tion complexity is independent of the number of clients and scales only with the number of client classes. Addi-tionally, a convex optimization approximation is proposed which has shown to attain close-to-optimal performance with even lower computational complexity. The proposed
Fig. 11FFR for dynamic optimization. Frame-freeze rate for the test client with time-varying channel under dynamic optimization
optimization framework is also shown to provide robust performance when limited client feedback information is available. Finally, by introducing a penalty term to the multicast utility, the QoE optimization is extended to sup-press client playback quality variations due to source bit rate and/or service bandwidth fluctuations. Despite the above promising results, a possible future work would be to assess the efficacy of the proposed scheme in more full-fledged application scenarios similar to [49].
Appendix
Convexity analysis of Problem 3
For the convexity analysis, we form the Hessian matrix Hfrom the second derivatives of the cost function with respect to the optimization variablesθl,l=1,. . .,L,
H=Hjk
=
⎡ ⎣ ∂2
∂θj∂θk M
m=1
hm
l=1 ˆ
αm,lFm(1/θl) ⎤
⎦ j,k=1,. . .,L.
The diagonal elements can be obtained from differenti-ating (19)
Hjj= M
m=1
ˆ
αm,j ∂ 2
∂θ2 j
cmθj−pm+1−cm
= M
m=1
ˆ
αm,jcmpm(pm+1)θj−(pm+2). (28)
Sincecm,pm,αˆm,j ≥ 0 andθj ≥ 1, ∀j,m, we conclude thatHjj≥0,∀j.
Similarly, it can be shown that the off-diagonal terms of the Hessian matrixHjk,j = kare zero. As a result,His positive semidefinite and the cost function is convex [50].
The UEP constraints in Problem 3 are linear since they are of the form θj+1 − θj ≤ 0 with j = 1,. . .,L and θL+1 1. Furthermore, the bandwidth constraint is also linear. Hence, the constraints form a polyhedron which is a convex set. Since the convexity of the cost function was previously established, Problem 3 is a convex optimization problem.
Competing interests
The authors declare that they have no competing interests. Acknowledgements
This work was supported by the Natural Sciences and Engineering Research Council of Canada.
Author details
1Department of Electrical and Computer Engineering, Queen’s University, K7L 3N6 Kingston, ON, Canada.2Huawei Technologies, K7L 3N6 Kanata, ON, Canada.
Received: 7 May 2015 Accepted: 23 November 2015
References
1. H Liu, M El Zarki, Performance of h.263 video transmission over wireless channels using hybrid arq. IEEE J. Sel. Areas Commun.15(9), 1775–1786 (1997)
2. DJC MacKay, Fountain codes. IEE Proc. Commun.152(6), 1062–1068 (2005)
3. D Gozálvez, D Gómez-Barquero, T Stockhammer, M Luby, AL-FEC for improved mobile reception of MPEG-2 DVB-T transport streams. Int. J. Digit. Multimed. Broadcast.2009, 10 (2009)
4. S McCanne, M Vetterli, V Jacobson, Low-complexity video coding for receiver-driven layered multicast. IEEE J. Sel. Areas Commun.15(6), 983–1001 (1997)
5. AE Mohr, EA Riskin, RE Ladner, Unequal loss protection: graceful degradation of image quality over packet erasure channels through forward error correction. IEEE J. Sel. Areas Commun.18(6), 819–828 (2000) 6. PA Chou, AE Mohr, A Wang, S Mehrotra, Error control for receiver-driven