A VALIDATED ULTRA-PERFORMANCE LIQUID CHROMATOGRAPHY METHOD FOR NITRATE
AND NITRITE MEASUREMENT
BENNY ANTONY*, MERINA BENNY, BINU T KURUVILLA, NISHANT KUMAR GUPTA
Arjuna Natural Ltd. (formerly Arjuna Natural Extracts Ltd.), Research and Development Laboratory, Behind ISRO, Erumathala P.O, Keezhmad, Aluva – 683112, Kerala, India. Email: [email protected]
Received: 07 April 2018, Revised and Accepted: 25 May 2018 ABSTRACT
Objective: The objective of this study was to develop a simple and sensitive ultra-performance liquid chromatography (UPLC) method for determination of nitrate and nitrite in plant extracts and biological samples.
Methods: Nitrate was analyzed directly by injecting the filtered sample into UPLC and monitoring the chromatogram at 222 nm whereas, for nitrite analysis, the samples were derivatized using Griess reagent, and chromatogram was monitored at 520 nm. The method was validated for accuracy and precision.
Results: The calibration curve was obtained in the range of 0.05–500 µg/ml for nitrate and 5–3200 ng/ml for nitrite which were extremely linear, where both correlation coefficients were >0.9990. Accuracy of the method was found as 99.87% and 100.24% for nitrate and nitrite, respectively. High degree of precision and repeatability was obtained since coefficient of variation values were <2.1%. Among the three commonly used anticoagulants, i.e., K2EDTA, Li-Heparin, and sodium citrate, Li-Heparin did not show any interference with nitrate or nitrite analysis.
Conclusion: Results clearly indicate the sensitivity and suitability of the developed method for estimation of nitrate and nitrite in plant extracts and biological samples. Our findings also indicate that Li-Heparin does not interfere with analysis and thus can be used as anticoagulant while collecting blood.
Keywords: Nitrate, Nitrite, Amaranth, Nitric oxide, Validation.
INTRODUCTION
Vegetables constitute a major source of human exposure to nitrate and nitrite in human diet. It was estimated that vegetables contribute approximately 80~92% and 16~43% of the average daily dietary intake of nitrate and nitrite, respectively [1]. Nitrate concentrations vary significantly, ranging from 1 to 10,000 mg/kg fresh weight, while nitrite levels in fresh vegetables are extremely low (<2 mg/kg) [2,3]. Furthermore, nitrate and nitrite have been routinely added during the curing process of certain meat products, serving as a preservative against microorganisms, such as Clostridium botulinum, that can cause food poisoning. Both nitrate and nitrite are monitored regularly because of their toxicity. There is an increased awareness of the relationship between nitrate and nitrite content in food and water supplies and methemoglobinemia found in infants and the formation of carcinogenic nitrosamines [4].
However, from research performed over the past decade, it is now apparent that nitrate and nitrite are physiologically recycled in blood and tissues to form nitric oxide (NO) and other bioactive nitrogen oxides [5,6]. Therefore, they should now be viewed as storage pools for NO-like bioactivity, thereby complementing the NO synthase (NOS)-dependent pathway. The bioactivation of nitrate from dietary or endogenous sources requires its initial reduction to nitrite, and because mammals lack specific and effective nitrate reductase enzymes, this conversion is mainly carried out by commensal bacteria in the gastrointestinal tract and on body surfaces [7,8]. Once nitrite is formed, there are numerous pathways in the body for its further reduction to NO, involving hemoglobin, myoglobin, xanthine oxidoreductase, ascorbate, polyphenols, and protons [9]. The generation of NO by these pathways is greatly enhanced during hypoxia and acidosis, thereby ensuring NO production in situations for which the oxygen-dependent NOS enzyme activities are compromised [10,11]. Nitrite reduction to NO and NO-modified proteins during physiological
and pathological hypoxia appears to contribute to physiological hypoxic signaling, vasodilation, modulation of cellular respiration, and the cellular response to ischemic stress [12-15].
A variety of analytical methods for the determination of nitrate and nitrite have been developed and applied to the analysis of food, water, plants, and other matrices. These methods include polarographic method [16], capillary electrophoresis [17], reversed-phase high-performance liquid chromatography (HPLC) [18], gas chromatography–mass spectrometry [19], and ion chromatography [20]. In recent years, a lot of development has taken place in ultraviolet spectrophotometry [21]. Burhan and Vyas reported simultaneous determination of nitrite and nitrate in rat plasma [22].
In the present study, a rapid, accurate, and sensitive method for determining nitrate and nitrite is developed by modifying the published procedures of Croitoru [23]. Instead of HPLC with ultraviolet/visible detection, ultra-performance liquid chromatography (UPLC) with photodiode array (PDA) detector was used to increase the sensitivity and reduce the run time of the analysis. In this new method, pre-column derivatization step is not required to analyze nitrate.
The main objective of this study was to develop a simple, rapid, and precise UPLC method for determination of nitrate and nitrite in vegetables, juice, extracts, etc. The developed method was also applied to analyze nitrate and nitrite levels in plasma.
METHODS
Chemicals and reagents
1-Naphthylamine was purchased from Nice Chemicals, Kochi, India, and sulfanilic acid (99.0%) from Fluka, Germany. Potassium nitrate © 2018 The Authors. Published by Innovare Academic Sciences Pvt Ltd. This is an open access article under the CC BY license (http://creativecommons. org/licenses/by/4. 0/) DOI: http://dx.doi.org/10.22159/ajpcr.2018.v11i9.26519
(99%) and potassium nitrite (97%) were purchased from ALFA AESAR (LA3 2XY, England). Tetrabutylammonium hydroxide (10% solution), acetic acid (99–100%, EMPLURA), acetonitrile (HPLC grade), and methanol (HPLC grade) were purchased from Merck KGaA (Darmstadt, Germany). Merck Millipore ultrapure water (Type 1) after filtration through 0.2 µ membrane filter was used. Mobile phase was filtered through 0.2 µ filters from Merck Millipore. All other chemicals used were of analytical grade purity.
Griess A reagent: 1.5 ml acetic acid was mixed with 3 ml Millipore water. Accurately weighed 55 mg sulfanilic acid was dissolved in this mixture using ultrasonic bath. The final solution was filtered through 0.2 µ filter.
Griess B reagent: 6 mg of 1-naphthylamine was dissolved in 4 ml acetic acid using ultrasonic bath. The solution was filtered through 0.2 µ filter.
Instrumentation
The chromatographic analysis was carried out in WATERS ACQUITY UPLC H-Class system attached with column compartment, UPLC Sample Manager - Flow Through Needle, and liquid chromatograph with quaternary solvent manager and detector (PDA detector; wavelength domain 200–600 nm). The column used was ACQUITY UPLC BEH C18 having following configuration: Dimension (mm) 50× 2.1, particle size: 1.7 µm. Waters Empower 2 was used as UPLC software.
Chromatographic conditions
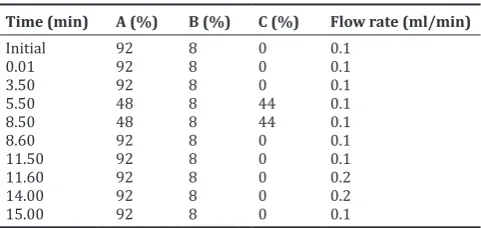
To prepare mobile phase A, 1.4 g tetrabutylammonium hydroxide was dissolved in water and volume was made up to 1000 ml with water, and pH of the solution was adjusted to 2.5 with concentrated sulfuric acid and filtered through 0.2 µ filter. HPLC grade acetonitrile was used as mobile phase B whereas methanol was used as mobile phase C. All the mobile phases were degassed for 15 min in a sonicator bath before taking into the Waters UPLC gradient programming used as mentioned in Table 1. Injection volume was 2 µL in each case. Analysis time was 15 min for nitrate as well as nitrite. The eluted peaks were monitored at 222 nm for nitrate and 520 nm for nitrite.
Sample preparation Nitrate standard solution
81.5 mg of potassium nitrate (equivalent to 50 mg nitrate) was dissolved in Millipore water in a 100 ml volumetric flask, and volume was made up to the mark with water. 1 ml of this solution was diluted to 50 ml to get final concentration of 10 mg/l nitrate as standard solution.
Nitrite standard solution
92.5 mg of potassium nitrite (equivalent to 50 mg nitrite) was dissolved in water in a 100 ml volumetric flask and volume was made up to the mark with Millipore water. 1 ml of this solution was diluted to 50 ml, and again, 1 ml was further diluted to 50 ml to get final concentration of 200 µg/l nitrite as standard solution.
UPLC analysis
The mobile phase solution was allowed to pass through the UPLC column until a stable baseline signal was equilibrated (delta becomes <20). For analysis of nitrate, the filtered sample/standard was used as such in the UPLC system, and the chromatogram was monitored at a wavelength of 222 nm. Derivatization process was used for the analysis of nitrite. Derivatization was done by adding 1 ml of the sample/
standard solution to 1 ml of mobile phase A. To this solution, 200 μl Griess A reagent was added and after 2 min 200 μl Griess B reagent was
added. After derivatization, the solution was filtered through 0.2 µm filter and injected into the UPLC. The chromatogram was monitored at 520 nm for nitrite.
The amounts of nitrate and nitrite in the test solution were calculated from the peak areas using linear regression equations of nitrate and nitrite standard curves. If the curve of the peak areas was larger than
that of the maximum amount from the standard curve, the test solution was diluted to appropriate concentrations.
Method validation Linearity and range
The stock solutions of potassium nitrate and potassium nitrite were diluted appropriately to get various concentrations of standard solution. The calibration curve was obtained by injecting these solutions with known amounts of nitrate (0.05–500 µg/ml) and nitrite (5–3200 ng/ml) into the UPLC system. Linearity was observed throughout the calibration curve, and range was determined.
Accuracy, precision, and repeatability
Accuracy of the method was determined by injecting a sample of known concentration six times and calculating the percent difference between the measured mean concentrations and the corresponding nominal concentrations. Intraday (6 times on the same day) and interday tests (6 times within successive 3 days with 12 h as intervals) were conducted. The repeatability precision values were characterized by the coefficient of variations (%CV).
Specificity
Specificity of the method was determined by monitoring the chromatogram at 222 nm for nitrate and 520 nm for nitrite. Specificity was assessed by retention time, spectra, and peak purity.
Limit of detection (LOD) and limit of quantification (LOQ)
LOD and LOQ were determined using the signal-to-noise method, the peak-to-peak noise around the analyte retention time was measured, and subsequently, the concentration of the analyte that yielded a signal equal to certain value was estimated. Concentration of analyte yielding a signal to noise ratio of 3:1 was accepted as LOD whereas signal-to-noise ratio of 10:1 was accepted as LOQ.
Application of the method
The developed method was used to determine nitrate and nitrite concentrations in amaranth leaves extract and plasma. Recovery study was also performed in amaranth extract and plasma samples. During analysis of plasma samples, it was noted that the anticoagulants used for plasma separation interfere with nitrate and nitrite analysis. Thus, it was also decided to study the interference of various anticoagulants on analysis of nitrate and nitrite in plasma.
Estimation of nitrate and nitrite in amaranth leaves extract Preparation of extract
100 g of fresh amaranth leaves was cleaned and crushed. The crushed material was extracted with 400 ml of water by refluxing for 4 h in a round bottom flask fitted with a reflux condenser. The obtained extract was filtered through muslin cloth and residue was again extracted with 400 ml of water. This process was repeated one more time. All the extracts (filtrates) were pooled and concentrated in a rotary vacuum
evaporator at 85°C to form concentrated water extract. The extract was dried under vacuum to get powdered water extract.
Accurately weighed 40 mg of the extract was dissolved in water and volume was made up to 50 ml with water. The solution was filtered through 0.2 µm filter, and filtrate was used as sample for nitrate and nitrite analysis by UPLC.
Recovery study
To study recovery of nitrates, a series of various concentrations of 10, 50, and 100 mg/l standard solutions containing nitrate were spiked into amaranth extract samples. Similarly, a series of 100, 500, and 1000 µg/l of nitrite standard solutions were spiked into amaranth extract samples for study of nitrite recovery. Each concentration spiked was analyzed four times to evaluate the percentage recoveries and CV.
Estimation of nitrate and nitrite in plasma Collection of blood samples
Goat blood was collected from local slaughterhouse in tubes containing anticoagulant. The anticoagulant used was either K2EDTA, Li-Heparin,
or sodium citrate. Plasma was separated by centrifuging the tubes at 5000 rpm for 15 min. Supernatant plasma was pipetted out using micropipette into plastic vials. The samples were stored in deep freezer
at −80°C till analysis.
Plasma analysis and interference of anticoagulants
Accurately weighed 1.5–2.0 ml of plasma was transferred into a 5.0 ml centrifuge tube. The same volume of acetonitrile was added to the tube to make plasma:acetonitrile ratio of 1:1 (v/v). The tube was shaken for few minutes and centrifuged at 14000 rpm at 5°C for 15 min. The supernatant liquid was filtered through 0.2 µ filter and used in the UPLC as direct injection to detect nitrate. Nitrate was monitored at the wavelength 222 nm. A part of above filtrate was derivatized to detect nitrite. To 1 ml of the filtered solution, 1 ml of the mobile phase A and 200 µl of Griess A reagent were added. After 2 min, 200 µl Griess B reagent was added. This solution was filtered through 0.2 µm filter and injected into the UPLC. The chromatogram was monitored at 520 nm for nitrite.
Plasma samples obtained using different anticoagulants, i.e., K2EDTA,
Li-Heparin, or sodium citrate were analyzed, and chromatograms were monitored to study the interference of anticoagulants.
Recovery study
Recovery study was done with the plasma samples obtained using Li-heparin as anticoagulant. A series of various concentrations of 10, 50, and 100 mg/l standard solutions containing nitrate were spiked into plasma samples. Similarly, a series of 100, 500, and 1000 µg/l of nitrite standard solutions were spiked into plasma samples. Each concentration spiked was analyzed six times to evaluate the percentage recoveries and CV.
Stability studies of nitrate and nitrite in plasma
The stability of nitrate and nitrite in plasma was studied over a period
of 2 months. Plasma samples were stored in deep freezer at −80°C.
After every 2 weeks, the samples were analyzed for nitrate and nitrite separately.
RESULTS AND DISCUSSION Method validation Linearity and range
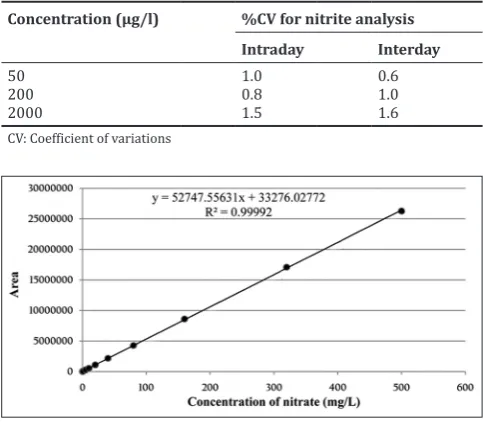
Standard curves for nitrate (0.05–500 mg/l) and nitrite (5–3200 µg/l) were plotted and found linear as shown in Figs. 1 and 2. The linear regression equations of nitrate and nitrite curves were calculated as y = 52748x+33277 (R2 = 0.999) and y = 325.7x+1460 (R2 = 0.999),
respectively. Since the correlation coefficient for nitrate as well as nitrite was >0.999, it showed a very good linearity within the tested range.
Accuracy, precision, and repeatability
Accuracy of the method was found as 99.87% and 100.24% for nitrate and nitrite, respectively. Precision and repeatability of the method were evaluated by intra- and inter-day analysis calculated from the results of six replicates and illustrated by the percentage %CV, as shown in Tables 2 and 3 for nitrate and nitrite, respectively. In repeated trials, all obtained CV values <2.1% indicate high degrees of repeatability.
Specificity
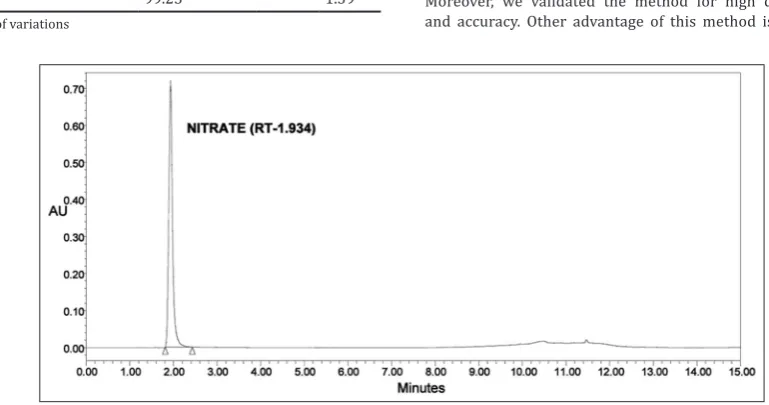
When nitrate standard solution was injected into UPLC and chromatogram was monitored at 222 nm, a single peak was observed around 1.8 min. In case of analysis of nitrite, a single peak was observed around 10.7 min when chromatogram was monitored at 520 nm. Retention time for nitrate was found to be in the range of 1.6–2.1 min, and for nitrite, it was found to be in the range of 10.5– 10.9 min. UPLC chromatograms for nitrate and nitrite are shown in Figs. 3 and 4.
Table 2: Repeatability of inter‑ and intra‑day analysis for nitrate (n=6)
Concentration (mg/l) %CV for nitrate analysis
Intra‑day Inter‑day
0.5 2.1 1.5
20 1.9 1.1
100 1.7 1.3
CV: Coefficient of variations
Table 3: Repeatability of inter‑ and intra‑day analysis for nitrite (n=6)
Concentration (µg/l) %CV for nitrite analysis
Intraday Interday
50 1.0 0.6
200 0.8 1.0
2000 1.5 1.6
CV: Coefficient of variations
Fig. 1: Calibration curve for nitrate (0.05–500 mg/l)
LOD and LOQ
The LOD for nitrate was calculated as 0.01 µg/ml (signal-to-noise ratio: 3:1) and LOQ was 0.05 µg/ml (signal-to-noise ratio: 10:1). For nitrite, it was not possible to calculate LOD since it was very difficult to apply the signal-to-noise ratio of 3:1 due to the presence of contamination peak in the blank itself. Due to this naturally occurring contamination process, a LOD cannot be adequately determined. The LOQ was calculated based on the signal-to-noise ratio of 10:1 and it was found 5 ng/ml. At this level of concentration, a blank-subtracted chromatogram always gives S/N ratio at least 10:1 (the CV [n=6] was <5%).
Application of the method Analysis of extract
In the extract of amaranth leaves, the nitrate and nitrite levels were found as 108.1±0.22 mg/g and 140.0±0.17 µg/g, respectively.
Recovery study
The recoveries of nitrate and nitrite in the study are shown in Tables 4 and 5. The recoveries of nitrate spiked with 10, 50, and 100 mg/l into
amaranth extract were in the range of 99–104%. The recoveries of nitrite spiked with 100, 500, and 1000 µg/l into extract were found to be in the range of 98–103%. The average recoveries of nitrate and nitrite were 100.51% and 100.06%, indicating that the method is quite accurate.
Analysis of nitrate and nitrite in plasma Nitrate and nitrite level in plasma
Because of low concentrations of nitrate and nitrite but high concentrations of interfering substances in biological samples, sample preparation (e.g., cleanup) with a high recovery rate is a necessary step before UPLC analysis. The plasma obtained from goat was analyzed for nitrate and nitrite content after deproteinization. The nitrate and nitrite levels were found as 12 mg/l (ppm) and 49 µg/l (ppb), respectively.
Interference of anticoagulants
Plasma samples obtained using Li-Heparin as anticoagulant were found to be most appropriate for nitrate as well as nitrite estimation. There was no interference observed when Li-Heparin was used as anticoagulant (Fig. 5). When K2EDTA or sodium citrate was
used as anticoagulant, interference with the peak (one extra peak) was observed as shown in Figs. 6 and 7. In nitrite analysis also, interference was observed when K2EDTA or sodium citrate was used as
anticoagulant. Although the peak shapes were good, the peak area was higher as compared to samples devoid of K2EDTA or sodium citrate..
When Li-Heparin was used as anticoagulant, there was no interference observed in nitrite analysis.
Recovery study in plasma
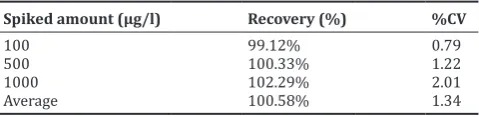
The recoveries of nitrate and nitrite in plasma are shown in Tables 6 and 7. The recoveries of nitrate spiked with 10, 50, and 100 mg/l into goat plasma were in the range of 97–101%. The recoveries of nitrite spiked with 100, 500, and 1000 µg/l into extract were found to be in the range of 99–103%. The average recoveries of nitrate and nitrite were 99.23% and 100.58%, indicating the accuracy of the developed method.
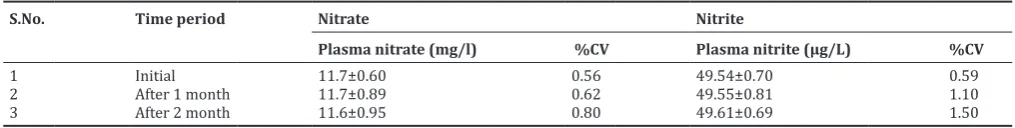
Stability study in plasma
Stability of nitrate and nitrite in plasma was studied during a 2-month period. The samples were found to be stable at −80°C for at least
2 month. The CV was <1% for nitrate and <2% for nitrite in the study period. Results are shown in Table 8.
In the present method, we detected nitrate without converting into nitrite and further derivatization step. The deproteinized samples were directly injected into UPLC to detect nitrate peak at 222 nm. Moreover, we validated the method for high degree of precision and accuracy. Other advantage of this method is very less runtime
Fig. 3: A typical ultra‑performance liquid chromatography chromatogram of nitrate at 222 nm Table 4: Recovery of nitrate spiked into amaranth extract (n=4)
Spiked amount (mg/l) Recovery (%) %CV
10 99.52 1.85
50 98.45 2.08
100 103.55 2.10
Average 100.51 2.01
CV: Coefficient of variations
Table 5: Recovery of nitrite spiked into amaranth extract (n=4)
Spiked amount (µg/l) Recovery (%) %CV
100 103.30 1.55
500 99.05 2.02
1000 97.85 1.85
Average 100.06 1.81
CV: Coefficient of variations
Table 6: Recovery of nitrate spiked into plasma (n=6)
Spiked amount (mg/l) Recovery (%) %CV
10 100.7 0.32
50 97.62 2.81
100 99.38 1.05
Average 99.23 1.39
(retention time: 1–2 min only) for nitrates. When derivatized sample was injected and monitored at 222 nm (to see the possibility of nitrate and nitrite estimation in a single run), peak resolution was not good, and thus, it was decided to estimate nitrate without derivatizing the sample. For analysis of nitrites, the samples were derivatized
to develop color. The samples were monitored at 520 nm to detect nitrite peak at 10–11 min retention time. Repeatability of the method was assessed by inter- and intra-day analysis. The linearity was established from 0.05 to 500 µg/ml for nitrates and 5–3200 ng/ml for nitrites. Recovery studies were also performed by spiking the amaranth leaves/slurry with standard nitrate and nitrite, and then, extraction was performed. The recovery was found as 99–100% for nitrate and 96–102% for nitrite, indicating that there is no loss of nitrate/nitrite during extraction process.
During the analytical method development for plasma samples, we found that different anticoagulants used to obtain plasma from blood have interference in the analysis. Three commonly used anticoagulants were used to study such interference and it was concluded that Li-Heparin is appropriate anticoagulant since it did not interfere with
Fig. 4: A typical ultra‑performance liquid chromatography chromatogram of nitrite at 520 nm
Fig. 5: Chromatogram of plasma nitrate analysis with Li‑Heparin as anticoagulant
Fig. 6: Chromatogram of plasma nitrate analysis with K2EDTA as anticoagulant
Table 7: Recovery of nitrite spiked into plasma (n=6)
Spiked amount (µg/l) Recovery (%) %CV
100 99.12% 0.79
500 100.33% 1.22
1000 102.29% 2.01
Average 100.58% 1.34
nitrate or nitrite analysis. The other anticoagulants, i.e., K2EDTA
and sodium citrate interfere with nitrate as well as nitrite analysis as we observed extra peak or higher peak area, respectively. The plasma samples were found stable at −80°C for at least 2 months for
nitrate and nitrite analysis by developed UPLC method. Some other interfering ions such as chloride and sulfate were also studied, and these ions were not found interfering with nitrate or nitrite analysis (data not shown).
CONCLUSION
The developed method was used to determine nitrate and nitrite content in vegetable extract and further extended to determine the same in plasma samples. The method was assessed for high degree of precision, accuracy, and repeatability. Recovery studies confirm the suitability and reliability of the method in assessing nitrate and nitrite content in vegetables, extracts, and biological samples.
ACKNOWLEDGMENT
The authors acknowledge Mr. Shine Jones, Arjuna Natural Ltd. Kochi, Kerala, for help in UPLC instrument operations.
AUTHOR’S CONTRIBUTIONS
Benny Antony and Merina Benny were involved in conception and design, Binu T Kuruvilla analyzed the data, and Nishant Kumar Gupta drafted the manuscript. All the authors were involved in correction and final revision of the manuscript.
CONFLICT OF INTEREST
The authors declare no conflict of interest.
REFERENCES
1. Walker R. Nitrates, nitrites and N-nitroso compounds: A review of the occurrence in food and diet and the toxicological implications. Food Addit Contam 1990;7:717-68.
2. Hunt J, Turner MK. A survey of nitrite concentrations in retail fresh vegetables. Food Addit Contam 1994;11:327-32.
3. Meah MN, Harrison N, Davies A. Nitrate and nitrite in foods and the diet. Food Addit Contam 1994;11:519-32.
4. Avery AA. Infantile methemoglobinemia: Reexamining the role of
drinking water nitrates. Environ Health Perspect 1999;107:583-6. 5. Zweier JL, Wang P, Samouilov A, Kuppusamy P. Enzyme-independent
formation of nitric oxide in biological tissues. Nat Med 1995;1:804-9. 6. Cosby K, Partovi KS, Crawford JH, Patel RP, Reiter CD, Martyr S,
et al. Nitrite reduction to nitric oxide by deoxyhemoglobin vasodilates the human circulation. Nat Med 2003;9:1498-505.
7. Duncan C, Dougall H, Johnston P, Green S, Brogan R, Leifert C, et al. Chemical generation of nitric oxide in the mouth from the enterosalivary circulation of dietary nitrate. Nat Med 1995;1:546-51.
8. Lundberg JO, Govoni M. Inorganic nitrate is a possible source for systemic generation of nitric oxide. Free Radic Biol Med 2004;37:395-400.
9. Lundberg JO, Weitzberg E, Gladwin MT. The nitrate-nitrite-nitric oxide pathway in physiology and therapeutics. Nat Rev Drug Discov 2008;7:156-67.
10. Giraldez RR, Panda A, Xia Y, Sanders SP, Zweier JL. Decreased nitric-oxide synthase activity causes impaired endothelium-dependent relaxation in the post ischemic heart. J Biol Chem 1997;272:21420-6.
11. Ostergaard L, Stankevicius E, Andersen MR, Eskildsen-Helmond Y, Ledet T, Mulvany MJ, et al. Diminished NO release in chronic hypoxic human endothelial cells. Am J Physiol Heart Circ Physiol 2007;293:H2894-903.
12. Modin A, Björne H, Herulf M, Alving K, Weitzberg E, Lundberg JO. Nitrite-derived nitric oxide: A possible mediator of “acidic-metabolic” vasodilation. Acta Physiol Scand 2001;171:9-16.
13. Bryan NS, Fernandez BO, Bauer SM, Garcia-Saura MF, Milsom AB, Rassaf T, et al. Nitrite is signaling molecule and regulator of gene expression in mammalian tissue. Nat Chem Biol 2005;1:290-7. 14. Duranski MR, Greer JJ, Dejam A, Jaganmohan S, Hogg N, Langston W,
et al. Cytoprotective effects of nitrite during in vivo ischemia-reperfusion of the heart and liver. J Clin Invest 2005;115:1232-40. 15. Shiva S, Sack MN, Greer JJ, Duranski M, Ringwood LA, Burwell L,
et al. Nitrite augments tolerance to ischemia/reperfusion injury via the modulation of mitochondrial electron transfer. J Exp Med 2007;204:2089-102.
16. Ximenes M, Rath S, Reyes F. Polarographic determination of nitrates in vegetables. Talanta 2000;51:49-56.
17. Morcos E, Wiklund NP. Nitrite and nitrate measurements in human urine by capillary electrophoresis. Methods Mol Biol 2004;279:21-34. 18. Ferreira IM, Silva S. Quantification of residual nitrite and nitrate in ham
by reverse-phase high performance liquid chromatography/diode array detector. Talanta 2008;74:1598-602.
19. Tsikas D, Suchy MT, Mitschke A, Beckmann B, Gutzki FM. Measurement of nitrite in urine by gas chromatography-mass spectrometry. Methods Mol Biol 2012;844:277-93.
Fig. 7: Chromatogram of plasma nitrate analysis with sodium citrate as anticoagulant
Table 8: Stability of plasma samples for nitrate and nitrite analysis (n=6)
S.No. Time period Nitrate Nitrite
Plasma nitrate (mg/l) %CV Plasma nitrite (µg/L) %CV
1 Initial 11.7±0.60 0.56 49.54±0.70 0.59
2 After 1 month 11.7±0.89 0.62 49.55±0.81 1.10 3 After 2 month 11.6±0.95 0.80 49.61±0.69 1.50
20. Khan SS, Riaz M. Determination of UV active inorganic anions in potable and high salinity water by ion pair reversed phase liquid chromatography. Talanta 2014;122:209-13.
21. Lotfy HM, Saleh SS. Recent development in ultraviolet spectrophotometry through the last decade (2006-2016): A review. Int J Pharm Pharm Sci 2016;8:40-56.
22. Burhan A, Vyas B. Simultaneous determination of nitrite and nitrate by ultra-performance liquid chromatography in rat plasma. Int J Pharm Pharm Sci 2016;8:294-6.