R E S E A R C H
Open Access
Inhibition of mTORC1 inhibits lytic replication of
Epstein-Barr virus in a cell-type specific manner
Amy L Adamson
*, Brandi T Le and Brian D Siedenburg
Abstract
Background:Epstein-Barr virus is a human herpesvirus that infects a majority of the human population. Primary infection of Epstein-Barr virus (EBV) causes the syndrome infectious mononucleosis. This virus is also associated with several cancers, including Burkitt’s lymphoma, post-transplant lymphoproliferative disorder and nasopharyngeal carcinoma. As all herpesvirus family members, EBV initially replicates lytically to produce abundant virus particles, then enters a latent state to remain within the host indefinitely.
Methods:Through a genetic screen inDrosophila, we determined that reduction ofDrosophila Toractivity altered EBV immediate-early protein function. To further investigate this finding, we inhibited mTOR in EBV-positive cells and investigated subsequent changes to lytic replication via Western blotting, flow cytometry, and quantitative PCR. The student T-test was used to evaluate significance.
Results:mTOR, the human homolog ofDrosophilaTor, is an important protein at the center of a major signaling pathway that controls many aspects of cell biology. As the EBV immediate-early genes are responsible for EBV lytic replication, we examined the effect of inhibition of mTORC1 on EBV lytic replication in human EBV-positive cell lines. We determined that treatment of cells with rapamycin, which is an inhibitor of mTORC1 activity, led to a reduction in the ability of B cell lines to undergo lytic replication. In contrast, EBV-positive epithelial cell lines underwent higher levels of lytic replication when treated with rapamycin.
Conclusions:Overall, the responses of EBV-positive cell lines vary when treated with mTOR inhibitors, and this may be important when considering such inhibitors as anti-cancer therapeutic agents.
Keywords:Epstein-Barr virus, BZLF1, BRLF1, Lytic replication, mTOR, Rapamycin
Background
Epstein-Barr virus (EBV) is a human herpesvirus which has infected a large majority of the world’s human popula-tion. This virus infects epithelial cells of the nasopharynx, where it replicates in a lytic or productive manner, as well as B lymphocytes, where the virus enters a latent state [1]. EBV is associated with a plethora of diseases, including in-fectious mononucleosis, lymphomas (Burkitt’s lymphoma, Hodgkins lymphoma, post-transplant lymphoproliferative disorder), epithelial-based cancers (including nasopha-ryngeal carcinoma), multiple sclerosis, and the rare but deadly X-linked lymphoproliferative syndrome [2]. The prevalence of this virus, along with its potential for ser-ious disease, necessitate the study of means to inhibit
lytic replication, as well as treatments to kill EBV-positive cancer cells.
EBV lytic replication commences upon infection of new cells, or upon reactivation of the latent virus within cells. During lytic replication the first wave of EBV protein ac-tivity includes the immediate-early BZLF1 (Z) and BRLF1 (R) proteins. The Z and R proteins are both absolutely necessary for lytic replication to proceed. These are transcription factors that activate transcription from the promoters of the next wave of EBV genes, the early genes. The early genes encode proteins that act to repli-cate the viral genome. Lastly, the late genes are expressed to provide the virion structural elements [1].
The Z and R proteins act not only as transcriptional activators, but also physically interact with several cellular proteins including CREB-binding protein (CBP), in order to promote viral replication in lieu of cellular activities * Correspondence:[email protected]
Department of Biology, University of North Carolina at Greensboro, Greensboro, North Carolina 27402, USA
mTOR is a kinase at the heart of a major signaling path-way. mTOR can be found in two different protein com-plexes, mTORC1 and mTORC2 [12,13]. Extracellular signals such as various nutrient levels and growth factors impinge on the mTORC1 pathway to control a variety of processes including protein translation, autophagy, cell growth, and mitochondrial metabolism [12-14]. Pathways that activate mTORC1 include the MAPK ERK and Akt signaling pathways, both of which can be activated by phosphatidylinositol 3 kinase (PI3 kinase) [15]. As part of the mTORC1 complex, mTOR promotes the phos-phorylation of downstream targets including p70S6K and 4EBP1. These events promote ribosome biogenesis and cap-dependent translation, respectively [13,15,16].
Rapamycin is a specific inhibitor of mTOR activity within mTORC1. Rapamycin, also an immunosuppres-sant, complexes with the protein FKBP-12; this complex then binds to mTOR and inhibits its kinase activity [16]. As inhibition of mTOR subsequently inhibits protein translation and cell growth, rapamycin is an excellent can-didate for anti-tumor treatment. In fact rapamycin (or similar mTOR inhibitors) has gained interest for the treat-ment of cancers, including EBV-associated post-transplant lymphoproliferative disease [17-19].
Previous studies have shown that inhibition of mTOR by treatment with rapamycin is effective in inhibiting Kaposi’s sarcoma herpesvirus (KSHV) lytic replication [20]. The inhibition of lytic replication appears to be due to the inhibition of translation of the immediate-early protein, RTA [20]. Another mTOR inhibitor, Torin1, was found to inhibit viral replication for the herpesvirus members cytomegalovirus, herpes simplex virus 1, and murine gammaherpesvirus 68 [21]. These three viruses were much less sensitive to rapamycin treatment [21]. In the case of human cytomegalovirus, the inhibition of mTOR did not greatly affect the immediate-early pro-teins, as for KSHV, but appeared to inhibit downstream replication events [21].
In a Drosophilamodel system, we identified Tor as a modifier of Z and R activities. Translating this finding to the context of lytically-replicating EBV, we found that mTORC1 inhibition via rapamycin treatment yielded dif-ferent effects in B cell versus epithelial cell lines. While
Drosophila
We have previously expressed the Z and R genes in
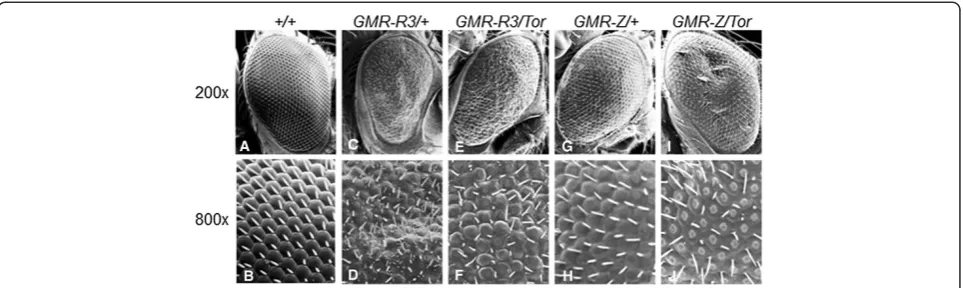
Drosophila eye tissue, which yielded significant mutant eye phenotypes (Figure 1C, D, G, H) [22,23]. Such pheno-types allowed us to perform genetic screens to identify host cellular modifiers of Z or R activity. One such screen in-volved crossing our Z and R expressing flies toDrosophila tumor suppressor mutants [23]. An interesting finding was that when R-expressing flies (GMR-R3) were crossed toTor (the fly homolog of mTOR) mutant fly lines (TorDeltaP and Tork17004, which both decrease Tor levels [24,25]; theTorDeltaP/+andTork17004/+flies alone have wild-type-appearing eyes) the progeny had more wild-type eyes, suggesting that reduced Tor levels suppressed R activity in eye tissue (Figure 1E, F). Conversely, when Z-expressing flies (GMR-Z) were crossed to the sameTormutant fly lines, their progeny had a much more severe mutant phenotype, suggesting that the reduction of Tor actu-ally increased Z activity (Figure 1I, J). Comparing the
Tor-modifiedGMR-R3andGMR-Zphenotypes (Figure 1F and J), it appears that the decrease of Tor activity im-pacted the GMR-Zphenotype more so than theGMR-R3 phenotype. TheGMR-Z/Torphenotype is much more se-vere thanGMR-Z/+; theGMR-R3/Torphenotype is mod-erately improved in relation to theGMR-R3/+phenotype. This suggests that the loss of Tormay impact Z activity more so than R activity.
this cell line (Figure 2B, dark bars). Treatment of other EBV-positive epithelial cells lines (AGS-BX1 and D98/ HR1) yielded similar results (Figure 2C). The rapamycin dose that had the most significant effect upon lytic rep-lication in these cells, without impairing cell growth (5 nM) was very effective at inhibiting mTOR activity, as evidenced by the ability of this dose to inhibit the phos-phorylation of the mTOR target p70S6K in these cells (Figure 2E, lane 2).
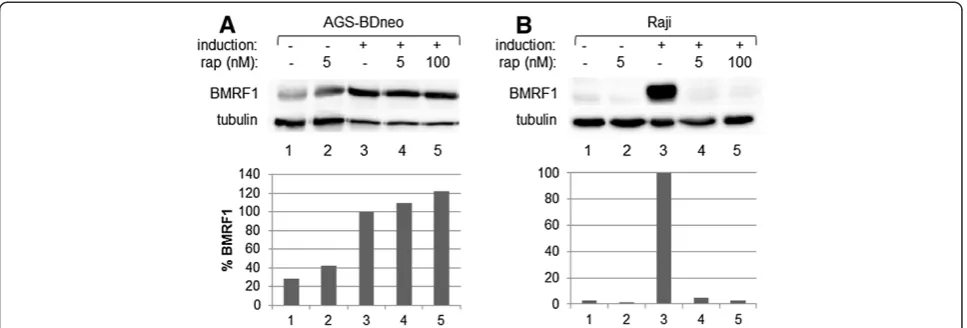
As the doses used were relatively low doses of rapamycin, we tested to see if a higher dose of rapamycin would have a different effect upon lytic replication in EBV-positive epithelial cell lines, in an effort to inhibit lytic replica-tion. We treated AGS-BDneo cells with 100 nM rapa-mycin for 24 hr prior to induction of lytic replication and performed Western blot analysis to examine the levels of BMRF1. We found that the higher dose of 100 nM rapamycin was still unable to inhibit lytic replica-tion, relative to untreated (Figure 3A, lane 5).
EBV biology is cell-type specific, as the virus lytically replicates in epithelial cells to produce abundant pro-geny viral particles, but enters a latent state in B cells, immortalizing those cells to remain a part of those cells indefinitely [1]. To examine the effects of mTOR inhib-ition on EBV lytic replication in EBV-positive B cells, we treated the latently infected B cell line Raji with a dosage series of rapamycin for 24 hr then disrupted latency in these cells. Western blot analysis was performed for BMRF1, and the resulting BMRF1 levels quantified and standardized relative to tubulin levels (Figure 2A, B). In contrast to the epithelial cells, rapamycin treatment inhibited lytic replication in B cells, in a dose-dependent manner. Additional EBV-positive B cell lines were exam-ined, including P3HR1, Daudi, and EBfaV-GFP (derived from B958), and all showed results similar to Raji, i.e. that rapamycin treatment was effective in inhibiting early lytic replication (Figure 2C). The rapamycin dose most effective in decreasing lytic replication in B cells, without impairing
cell growth (5 nM), was also very effective in inhibiting the phosphorylation of p70S6K by mTOR in Raji cells (Figure 2E, lane 2).
As for AGS-BDneo, we examined whether a higher dose of rapamycin would be more effective than 5 nM rapa-mycin at inhibiting early lytic replication in Raji cells. Figure 3B shows that 5 nM was very effective at inhibiting BMRF1 expression (Figure 3B, lane 4), and a higher dose (100 nM) was not more effective (Figure 3B, lane 5).
[image:3.595.58.540.89.233.2]subsequently counted the number of resulting GFP-positive Raji cells, and found that the rapamycin treat-ment significantly lowered the number of viral particles being produced by EBfaV-GFP cells, as judged by the number of Raji cells infected (Figure 4D).
Treatment of EBV-positive cell lines with rapamycin does not impact cell viability
To ensure that rapamycin treatment did not impact the via-bility of the cells used in this study, we treated Raji, EBfaV-GFP, and AGS-BDneo cells with 0 or 5 nM rapamycin for 24 hr, and induced the cells into lytic replication. Viable
versus dead cells were determined by flow cytometry (Figure 5A). The results indicate that rapamycin treatment did not negatively impact cell viability, thus eliminating the possibility that a loss of viability of the cells could ac-count for the alteration of lytic replication seen above. We did find, however, that 5 nM rapamycin decreased the cell proliferation of AGS-BDneo, Raji, and EBfaV-GFP cells (Figure 5B), as would be expected [17-19].
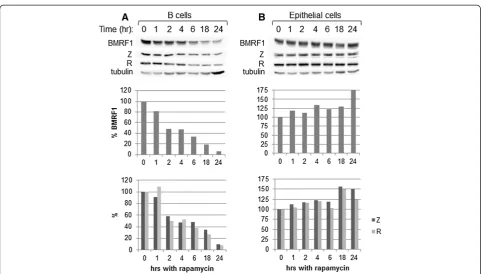
[image:4.595.57.541.87.475.2]short periods of time, then a negative feedback loop is ini-tiated and the inhibitory effect of rapamycin is supposedly lost [27,28]. To investigate whether our dose (5 nM) of rapamycin had a different short-term effect on our cell lines, we incubated Raji cells (as a B cell representative) and D98/HR1 cells (as an epithelial cell representative) with 5 nM rapamycin for 24, 18, 6, 4, 2, 1, or 0 hr. At time 0, the cells were washed to remove the rapamycin treat-ment. Also at time 0 the cells were induced into lytic replication. Western blot analysis was performed to examine BMRF1, Z, R, and tubulin levels; BMRF1, Z, and R levels were quantified and standardized to tubulin levels (Figure 6). B cells that had the rapamycin washed off at time 0 (Figure 6A) had a time-dependent decrease in lytic replication, with the inhibitory effect elicited after 4 hr of treatment, continuing to decrease in a time-dependent manner until 18–24 of rapamycin treat-ment. Similar trends were noted with Daudi and P3HR1 cells (data not shown). Conversely, epithelial cells exhibited a time-dependent increase in lytic replication, with the strongest effect at 24 hr of rapamycin treatment (Figure 6B). Therefore, shorter exposure times did not show a different course of action of rapamycin in regard to lytic replication in either of these cell types.
For all cell lines tested, treatment with rapamycin 18– 24 hr prior to induction yielded the most significant results. Rapamycin treatment at the time of induction (0 hr) yielded a milder change, and treatment 24 hr post-induction yielded little to no change in BMRF1 levels (data not shown).
Z and R transcript and protein levels are altered by rapamycin treatment in a cell-type dependent manner Our initial work inDrosophilasuggested that loss ofTor activity in Drosophila eye cells led to altered Z and R
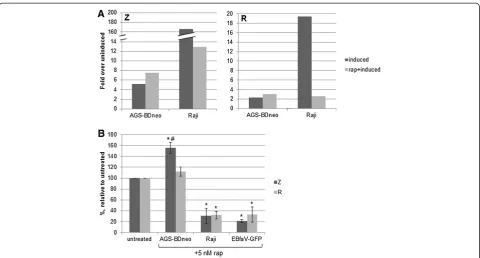
activity (greater Z activity and reduced R activity), with the most significant impact on Z activity (judging by the severity of the phenotypes in Figure 1). Thus we next sought to examine whether inhibition of mTOR in EBV-positive cells could alter expression levels of Z or R. To this end we treated the EBV-positive cell lines Raji and AGS-BDneo with 5 nM rapamycin, induced cells into lytic replication, and subsequently harvested RNA from the cells. Quantitative RT-PCR was performed (Figure 7A). We found that while rapamycin treatment had no/little ef-fect upon the level of GAPDH (control) transcripts, rapa-mycin treatment did affect transcript levels of both Z and R, in a cell-type dependent manner (Figure 7A). In the Raji B cell line, induction alone caused an average 166-fold increase in Z transcripts over uninduced cells; this was decreased to 13 fold when cells were pre-treated with 5 nM rapamycin. Similarly, induction caused a nearly 20 fold increase in R transcripts in Raji cells; this was de-creased to approximately 2 fold after rapamycin treat-ment. Conversely, in the AGS-BDneo epithelial cell line, rapamycin treatment increased both Z and R transcript levels, from an average of 5 fold to about 8 fold for Z, and an average of 2 to 3 fold for R, in relation to uninduced cells. It is worth noting that while it appears that Z and R transcripts are much more abundant in Raji cells than epi-thelial cells (Figure 7A), there actually was a higher base-line of Z and R transcript levels present in AGS-BDneo cells, including the uninduced cells, than in Raji cells. By qRT-PCR we found that while the GAPDH control tran-script levels varied between AGS-BDneo and Raji by a
[image:5.595.57.541.89.253.2]trend was found for R transcript levels in AGS-BDneo versus Raji cells.
The Z and R transcript levels correlated with subse-quent protein levels, such that rapamycin treatment sig-nificantly reduced Z and R protein levels in Raji cells
(and EBfaV-GFP cells) (Figure 7B). Rapamycin treatment of AGS-BDneo cells increased Z and R protein levels; Z demonstrated a significant increase, while R levels were typically increased only moderately (Figure 7B). For rapamycin-treated AGS-BDneo cells the levels of Z were significantly higher than those of R, suggesting that the increase in lytic replication in these cells may be due more to rapamycin-mediated effects upon Z rather than R. Rapamycin-based changes in Z and R expression levels were also demonstrated in Figure 2A (shown quantified in 2D) as well as in Figure 6A and B.
Discussion
We discovered that modulation of mTOR activity alters EBV lytic replication, beginning with a genetic screen in
Drosophilathat demonstrated that loss ofTorenhanced Z activity, and suppressed R activity, inDrosophilatissues (Figure 1). It logically followed that inhibition of mTOR in human cells would alter the lytic replication of EBV, as lytic replication is dependent upon both Z and R activities.
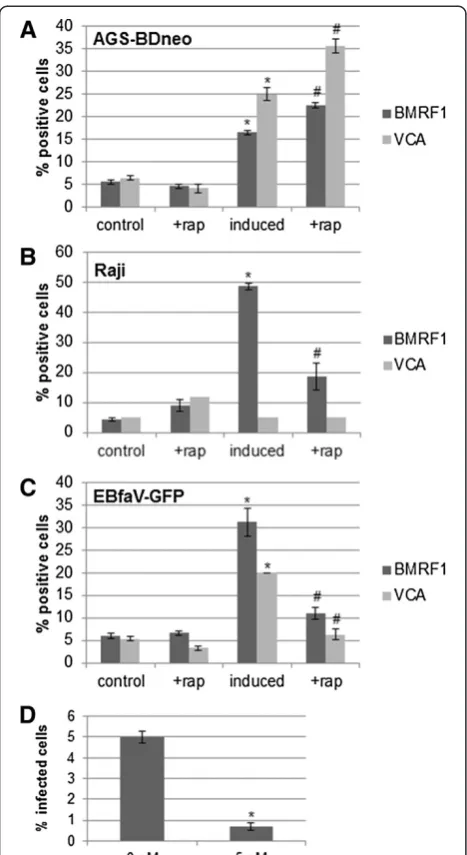
[image:6.595.307.538.85.351.2]We found that the rapamycin-mediated inhibition of mTOR had varying effects upon lytic replication amongst different EBV-positive cell lines. Inhibition of mTOR inhibited lytic replication in B cell lines, while in contrast Figure 4Inhibition of mTOR alters late lytic replication in
[image:6.595.57.291.87.515.2]EBV-positive cells.AGS-BDneo(A), Raji(B), and EBfaV-GFP(C)cells were left untreated or treated with 5 nM rapamycin for 24 hr prior to induction of lytic replication, as indicated. 48 hr post-infection cells were immunostained for BMRF1 or VCA, and the staining was analyzed by flow cytometry. The percent positive cells is presented.D. EBfaV-GFP cells were left untreated or treated with 5 nM rapamycin for 24 hr prior to induction of lytic replication, as indicated. 2 days post-induction the media from each condition was filtered and placed on Raji cells for 2 days. The number of resulting infected Raji cells was quantified, as judged by GFP, and the percent of infection presented. * = P < 0.05 relative to uninduced, untreated control cells; # = P < 0.05 relative to induced, untreated cells.
enhanced lytic replication in epithelial cell lines (Figures 2 and 4). The effects upon lytic replication were not time-dependent, as would be found if the action of rapamycin was negated by a negative feedback loop, as short-term doses of rapamycin yielded the same results as longer-term doses [i.e. in B cells rapamycin inhibited lytic replica-tion at all time points, and in epithelial cells rapamycin enhanced lytic replication at all time points (Figure 6)]. Furthermore, in an attempt to have epithelial cells mimic the B cell response to rapamycin, we treated epithelial cells with higher doses of rapamycin, yet lytic replication in these cells was still enhanced by the higher doses (Figure 3).
As the immediate-early proteins Z and R are responsible for initiating lytic replication, and lytic replication was altered upon rapamycin treatment, it follows that the in-hibition of mTOR likely altered these proteins’levels or functions. In the case of KSHV, Nichols et al. found that treatment of KSHV-positive cells with 12 nM rapamycin inhibited the KSHV immediate-early protein RTA from being translated [20]. This logically led to a loss of lytic replication in these cells [20]. However for other her-pesviruses such as human cytomegalovirus, treatment with 20 nM rapamycin or 250 nM Torin1 had little ef-fect upon immediate-early protein levels, yet caused a
decrease in the number of viral particles produced via lytic replication [21]. Therefore, it does not appear that inhib-ition of mTORC1 simply leads to an inhibinhib-ition of viral protein translation for all viruses. In our study we found that rapamycin treatment actually altered the transcript levels of Z and R, such that in B cells Z and R transcript levels were decreased when lytic replication was induced in the presence of rapamycin, while in epithelial cells Z and R transcript levels were increased when lytic replica-tion was induced in the presence of rapamycin (Figure 7A). The resulting Z and R protein levels correlated with the transcript levels (Figure 7B), and with the amount of Z protein binding to Z-response elements (ZREs; data not shown); this correlates with the levels of lytic replication that ensued in each cell type.
[image:7.595.57.539.85.359.2]activities in these different cell lines, and how such tran-scription factors are affected by loss of mTOR activity.
A working model based on our study is presented in Figure 8. Overall, we have found that B cells require ac-tive mTORC1 for efficient lytic replication. In contrast, epithelial cells do not require active mTORC1 to engage in productive lytic replication.
Conclusions
mTOR function is central to many different cellular pro-cesses, and viruses have evolved to manipulate the mTOR pathways to aid their replication [32,33]. Our investi-gations have provided evidence that EBV replication is dependent upon the mTOR pathway, at least in B cells, and that inhibiting this pathway in B cells greatly limits EBV lytic replication. However direct inhibition of mTOR in
epithelial cells has the opposite effect, and enhances EBV lytic replication. These results are important to take into account when considering the use of mTOR inhibitors as anti-viral or anti-cancer therapeutic agents.
Materials and methods SEMs
Flies were sputter coated with gold in a Pelco model 3 sputter coater 91000. Images were taken on a Hitachi S-4800 SEM microscope.
Cell lines
[image:8.595.58.539.87.345.2] [image:8.595.58.291.626.715.2]D98/HR1, a latently infected, EBV-positive epithelial cell line created by the fusion of HeLa cells with EBV-positive P3HR1 cells were maintained in Ham’s F12 medium supple-mented with 10% fetal bovine serum along with penicillin, streptomycin, and fungicide. BDneo and AGS-BX1 are EBV-positive gastric carcinoma cell lines (gifts of L. Hutt-Fletcher) and were maintained in Ham’s F12 supplemented with 10% fetal bovine serum along with penicillin, streptomycin, fungicide, and 500 μg/ml G418. Raji, Daudi, and P3HR1 (ATCC) are latently infected, EBV-positive B cell lines derived from Burkitt’s lymphoma. EBfaV-GFP is a derivative of the B958 cell line, in which the viral LMP2 gene was replaced by the EGFP gene driven by the CMV immediate-early promoter [26]. All Figure 7Z and R transcript and protein levels are altered by rapamycin treatment.Raji and AGS-BDneo cells were treated with 5 nM rapamycin for 24 hr prior to induction of lytic replication.A. Total RNA was isolated and qRT-PCR was performed with GAPDH (control)-, Z-, or R-specific primers, in triplicate. The mean fold expression over uninduced cells, standardized to GAPDH levels, is presented.B. Z and R protein levels from Western blots (in triplicate) were quantified and standardized to tubulin levels. The resulting Z and R protein levels from AGS-BDneo, Raji, and EBfaV-GFP cells are presented, relative to induced cells (with no rapamycin treatment). * = P < 0.05 relative to induced cells (with no rapamycin treatment); # = P < 0.05 relative to R levels within same cell type.
B cell lines were maintained in RPMI supplemented with 10% fetal bovine serum along with penicillin, streptomycin, and fungicide.
Cell treatments
Cells were treated with rapamycin (in DMSO, Sigma-Aldrich) for the times indicated. Cells not treated with either compound were treated with the vehicle, DMSO (Sigma-Aldrich). If cells were washed prior to induction, cells had their media removed, were washed one time with 1xPBS, then regular media added back. If un-washed, then the rapamycin or DMSO remained present in the media until cells were harvested.
Disruption of viral latency
B cells were treated with 20 ng/ml TPA and 3 mM sodium butyrate, and epithelial cells were treated with 5 ng/ml TPA and 0.75 mM sodium butyrate (higher doses of these inducing chemicals caused significant cell death of our AGS cell lines) for 24–48 hr as indicated (both from Sigma-Aldrich).
Protein preparation
Cells were collected, washed twice with 1xPBS, resus-pended in ELB lysis buffer (0.25 M NaCl, 0.1% NP40, 50 mM HEPES pH 7, 5 mM EDTA and protease inhibi-tors), and sonicated. The lysed cells were centrifuged and the supernatants quantified for protein concentra-tion prior to SDS-PAGE.
Western blotting
Equal amounts of protein (20–40μg) were loaded onto 10% SDS-PAGE gels and electrophoresed. Proteins were transferred to Immobilon (Millipore) membranes.
Immunoblotting
Blots were blocked with blocking buffer (5% nonfat dried milk, with 0.1% Tween-20, 1xPBS) for 2 hr to overnight. Primary antibodies: anti-BMRF1 (Capricorn), anti-tubulin (Developmental Hybridoma Bank), anti-R (Argene) and anti-Z (Argene or Santa Cruz) were diluted 1:200 in block-ing buffer; anti-phospho-p70S6K and anti-total p70S6K (Cell Signaling) were diluted 1:1000 in blocking buffer; all were incubated with the blots 1 hr to overnight, washed with 0.1% Tween-20 in 1xPBS 3 times for 10 min each, and incubated in secondary antibody (goat-anti-mouse HRP or goat-anti-rabbit-HRP, Jackson Immunoresearch) diluted 1:10,000 in blocking buffer, for 1 hr. Blots were washed as before and visualized with Super Signal (Pierce). Images and quantification were performed with a BioRad gel documentation apparatus.
Viability and cell density testing
Cells were treated with rapamycin for 24 hr then induced. Cells were collected and diluted in Guava ViaCount so-lution. After a five minute incubation, cell viability and cell density (total cells/ml) were determined by flow cytometry with a Guava InCyte flow cytometer.
Flow cytometry
Cells were treated as indicated, washed with PBS, and fixed with 60% acetone in PBS for 10 min at 4°. Cells were washed with PBS/0.5% BSA, incubated with anti-BMRF1 (Capricorn) or anti-VCA (Argene) antibodies [1:200 in Incubation mix (0.3% BSA, 5% goat serum, 0.1% Triton X in PBS)] for 1 hr at room temperature, washed with PBS/0.5% BSA, and incubated in donkey-anti-mouse-FITC (1:400 in Incubation mix) (Jackson Immunoresearch) for 1 hr at room temperature. Cells were washed with PBS/0.5% BSA, resuspended in PBS, and analyzed with a Guava EasyCyte flow cytometer (Millipore).
qRT-PCR
Total RNA from treated cells was isolated with the RNeasy mini kit (QIAGEN). qRT-PCR reactions (20 μL) were performed with the Power SYBR Green RNA-to-CT™ 1-Step kit (Applied Biosystems), 10 ng of total RNA, and 20 pmol of each primer, as per the manufacturer’s directions.
Primers used for Z were: 5’-ACTGCTGCAGCACTACC
GTGAGGTG-3’ (forward) and 5’-GAAATTTAAGAGA
TCCTCGTCTAA-3’(reverse) (creating a 150 bp product).
Primers for R were: 5’-ATGAGGCCTAAAAAGGATGG
CTT-3’ (forward) and 5’-TGAGGACGTTGCAGTAGT
CAG-3’ (reverse) (creating a 100 bp product). Reactions were performed and analyzed with an Applied Biosystems Step One Plus real time PCR machine.
Quantification and statistics
Western blots were quantified with ChemiDoc XRS soft-ware (BioRad) and flow cytometry data was quantified with Guava EasyCyte analysis software (Millipore). Expe-riments were done in triplicate, and the student T-test (two-tailed) used to evaluate significance. A P value <0.05 was considered significant.
Competing interests
The authors declare that they have no competing interests.
Authors’contributions
BTL carried out the quantitative RT-PCR. BDS carried out immunoassays. ALA conceived of the study, participated in its design and coordination, performed the SEMs, immunoassays, and flow cytometry, and wrote the manuscript. All authors read and approved the final manuscript.
Acknowledgments
3. Adamson AL, Kenney S:The Epstein-Barr virus BZLF1 protein interacts physically and functionally with the histone acetylase CREB-binding protein.
J Virol1999,73:6551–6558.
4. Swenson JJ, Holley-Guthrie E, Kenney SC:Epstein-Barr virus immediate-early protein BRLF1 interacts with CBP, promoting enhanced BRLF1 transactivation.J Virol2001,75:6228–6234.
5. Chang Y, Lee HH, Chen YT, Lu J, Wu SY, Chen CW, Takada K, Tsai CH:
Induction of the early growth response 1 gene by Epstein-Barr virus lytic transactivator Zta.J Virol2006,80:7748–7755.
6. Lee YH, Chiu YF, Wang WH, Chang LK, Liu ST:Activation of the ERK signal transduction pathway by Epstein-Barr virus immediate-early protein Rta.
J Gen Virol2008,89:2437–2446.
7. Adamson AL, Darr D, Holley-Guthrie E, Johnson RA, Mauser A, Swenson J, Kenney S:Epstein-Barr virus immediate-early proteins BZLF1 and BRLF1 activate the ATF2 transcription factor by increasing the levels of phosphorylated p38 and c-Jun N-terminal kinases.J Virol2000,74:1224–1233. 8. Adamson AL:Effects of SUMO-1 upon Epstein-Barr virus BZLF1 function
and BMRF1 expression.Biochem Biophys Res Commun2005,336:22–28. 9. Adamson AL, Kenney S:Epstein-barr virus immediate-early protein BZLF1
is SUMO-1 modified and disrupts promyelocytic leukemia bodies.J Virol 2001,75:2388–2399.
10. Chang LK, Lee YH, Cheng TS, Hong YR, Lu PJ, Wang JJ, Wang WH, Kuo CW, Li SS, Liu ST:Post-translational modification of Rta of Epstein-Barr virus by SUMO-1.J Biol Chem2004,279:38803–38812.
11. Liu ST, Wang WH, Hong YR, Chuang JY, Lu PJ, Chang LK:Sumoylation of Rta of Epstein-Barr virus is preferentially enhanced by PIASxbeta.Virus Res2006,119:163–170.
12. Corradetti MN, Guan KL:Upstream of the mammalian target of rapamycin: do all roads pass through mTOR?Oncogene2006,25:6347–6360. 13. Laplante M, Sabatini DM:mTOR Signaling.Cold Spring Harb Perspect Biol
2012,4:a011593.
14. Schieke SM, Finkel T:Mitochondrial signaling, TOR, and life span.Biol Chem2006,387:1357–1361.
15. Laplante M, Sabatini DM:mTOR signaling at a glance.J Cell Sci2009,
122:3589–3594.
16. Mamane Y, Petroulakis E, LeBacquer O, Sonenberg N:mTOR, translation initiation and cancer.Oncogene2006,25:6416–6422.
17. Cen O, Longnecker R:Rapamycin reverses splenomegaly and inhibits tumor development in a transgenic model of Epstein-Barr Virus-related Burkitt's lymphoma.Mol Cancer Ther2011,10(4):679–686.
18. Garber K:Rapamycin may prevent post-transplant lymphoma.J Natl Cancer Inst2001,93:1519.
19. Vaysberg M, Balatoni CE, Nepomuceno RR, Krams SM, Martinez OM:
Rapamycin inhibits proliferation of Epstein-Barr virus-positive B-cell lymphomas through modulation of cell-cycle protein expression.
Transplantation2007,83:1114–1121.
20. Nichols LA, Adang LA, Kedes DH:Rapamycin blocks production of KSHV/ HHV8: insights into the anti-tumor activity of an immunosuppressant drug.PLoS One2011,6:e14535.
21. Moorman NJ, Shenk T:Rapamycin-resistant mTORC1 kinase activity is required for herpesvirus replication.J Virol2010,84:5260–5269. 22. Adamson AL, Wright N, LaJeunesse DR:Modeling early Epstein-Barr virus
infection in Drosophila melanogaster: the BZLF1 protein.Genetics2005,
171:1125–1135.
23. Adamson AL, LaJeunesse DR:A Study of Epstein-Barr Virus BRLF1 Activity in a Drosophila Model System.Sci World J2012,2012:1–9.
29. Laplante M, Sabatini DM:Regulation of mTORC1 and its impact on gene expression at a glance.J Cell Sci2013,126:1713–1719.
30. Montalvo EA, Cottam M, Hill S, Wang YJ:YY1 binds to and regulates cis-acting negative elements in the Epstein-Barr virus BZLF1 promoter.
J Virol1995,69:4158–4165.
31. Zalani S, Coppage A, Holley-Guthrie E, Kenney S:The cellular YY1 transcription factor binds a cis-acting, negatively regulating element in the Epstein-Barr virus BRLF1 promoter.J Virol1997,71:3268–3274.
32. Spangle JM, Munger K:The human papillomavirus type 16 E6
oncoprotein activates mTORC1 signaling and increases protein synthesis.
J Virol2010,84:9398–9407.
33. O'Shea C, Klupsch K, Choi S, Bagus B, Soria C, Shen J, McCormick F, Stokoe D:Adenoviral proteins mimic nutrient/growth signals to activate the mTOR pathway for viral replication.EMBO J2005,24:1211–1221. doi:10.1186/1743-422X-11-110
Cite this article as:Adamsonet al.:Inhibition of mTORC1 inhibits lytic replication of Epstein-Barr virus in a cell-type specific manner.Virology Journal201411:110.
Submit your next manuscript to BioMed Central and take full advantage of:
• Convenient online submission
• Thorough peer review
• No space constraints or color figure charges
• Immediate publication on acceptance
• Inclusion in PubMed, CAS, Scopus and Google Scholar
• Research which is freely available for redistribution