Open Access
Research
Biological pathway analysis by ArrayUnlock and Ingenuity Pathway
Analysis
Ángeles Jiménez-Marín
†, Melania Collado-Romero
†, María Ramirez-Boo,
Cristina Arce and Juan J Garrido*
Address: Grupo de Genómica y Mejora Animal, Departamento de Genética, Facultad de Veterinaria, Universidad de Córdoba, Campus de Rabanales, Edificio C-5, 14071 Córdoba, Spain
Email: Ángeles Jiménez-Marín - [email protected]; Melania Collado-Romero - [email protected]; María Ramirez-Boo - [email protected]; Cristina Arce - [email protected]; Juan J Garrido* - [email protected]
* Corresponding author †Equal contributors
Abstract
Background: Once a list of differentially expressed genes has been identified from a microarray experiment, a subsequent post-analysis task is required in order to find the main biological processes associated to the experimental system. This paper describes two pathways analysis tools, ArrayUnlock and Ingenuity Pathways Analysis (IPA) to deal with the post-analyses of microarray data, in the context of the EADGENE and SABRE post-analysis workshop. Dataset employed in this study proceeded from an experimental chicken infection performed to study the host reactions after a homologous or heterologous secondary challenge with two species of Eimeria.
Results: Analysis of the same microarray data source employing both commercial pathway analysis tools in parallel let to identify several biological and/or molecular functions altered in the chicken Eimeria maxima infection model, including several immune system related pathways. Biological functions differentially altered in the homologous and heterologous second infection were identified. Similarly, the effect of the timing in a homologous second infection was characterized by several biological functions.
Conclusion: Functional analysis with ArrayUnlock and IPA provided information related to functional differences with the three comparisons of the chicken infection leading to similar conclusions. ArrayUnlock let an improvement of the annotations of the chicken genome adding InterPro annotations to the data set file. IPA provides two powerful tools to understand the pathway analysis results: the networks and canonical pathways that showed several pathways related to an adaptative immune response.
from EADGENE and SABRE Post-analyses Workshop Lelystad, The Netherlands. 12–14 November 2008
Published: 16 July 2009
BMC Proceedings 2009, 3(Suppl 4):S6 doi:10.1186/1753-6561-3-S4-S6
<supplement> <title> <p>EADGENE and SABRE Post-analyses Workshop</p> </title> <editor>Dirk-Jan de Koning</editor> <sponsor> <note>The publication of these proceedings was supported by the EC-funded Network of Excellence EADGENE (EC contract number FOOD-CT-2004-506416).</note> </sponsor> <note>Proceedings</note> <url>http://www.biomedcentral.com/content/pdf/1753-6561-3-S4-info.pdf</url> </supplement>
This article is available from: http://www.biomedcentral.com/1753-6561/3/S4/S6
© 2009 Jiménez-Marín et al; licensee BioMed Central Ltd.
Background
Microarray provides expression levels for thousands of genes simultaneously. The differentially expressed genes can be studied with different pathway analysis tools to connect with existing biological pathways by using public sources. Therefore, the integration of the differentially expressed genes into known biological pathways is a ver-satile tool for understand the biological complexity of gene expression. The EADGENE and SABRE post-analysis workshop evaluated different methods and software to deal with the post-analysis of microarray data [1]. In this study the analysis tools employed were Array Unlock an IPA and the data set used comes from microarrays assays performed to characterize the gene expression profile after a homologous or heterologous challenge of broilers primed with Eimeria maxima as summarised in [1].
Methods
Microarray dataset
The microarray employed in this study was the Arkge-nomics chicken 20 K oligo microarray prepared from 20,460 oligonucleotides designed against the chicken ENSEMBL transcripts [2].
Experiment
Two weeks old chicken infected with Eimeria maxima were challenged two weeks later with Eimeria maxima (MM),
Eimeria acervulina (MA), or PBS (PM). The samples were
collected at 8 hours (MM8, MA8, PM8) and 24 (MM24) hours after infection. The analysis performed allow us to obtain information about: i) differences among a homol-ogous second infection or a heterolhomol-ogous one with another specie of Eimeria (MM8_MA8); ii) how changes the response along the time after a second homologous immunization (MM8_MM24); and iii) the secondary immune response (MM8_PM8) [1].
Working file
The three lists of genes differentially expressed were previ-ously filtered by an adjusted p-value < 0.05. Three work-ing files were generated to perform both analyses uswork-ing the three datasets. These files must contain one column including all gene ID annotations identified by the two bioinformatics tools. This column was generated accord-ing to the annotations provided in the annotation file: original gene IDs (Unigene, HGNC) and mapped with human, mouse and rat homolog. Additional file 1 con-tains the 'working files' for the three comparisons.
ArrayUnlock software
ArrayUnlock (Integromics S.L., Spain) [3] was used to explore the main biological processes associated to chicken infection employing the 'Biological Enrichment' functionality. This functionality is able to find those bio-logical annotations that are highly associated to a list of
genes differentially expressed. Selected annotations were GO Biological Process, GO Molecular Function, GO Cel-lular Component KEGG pathways and INTERPRO motifs. Annotation associations were filtered by a p-value 0.01.
Ingenuity Pathways Analysis
The ''Core Analysis' function included in IPA (Ingenuity System Inc, USA) [4] was used to interpret the chicken data in the context of biological processes, pathways and networks. All Identifier Types were selected since more than one type of identifier exists in our dataset (working file). Both up- and down-regulated identifiers were defined as value parameters for the analysis. After the analysis, generated networks are ordered by a score mean-ing significance. On the other side, significance of the bio-functions and the canonical pathways were tested by the Fisher Exact test p-value. Biofunctions were grouped in: Disease and Disorders; Molecular and Cellular Functions; and, Physiological System Development and Function. In a similar way canonical pathways were grouped in Meta-bolic Pathways and Signaling Pathways. Canonical path-ways can also been ordered by the ratio value (number of molecules in a given pathway that meet cut criteria, divided by total number of molecules that make up that pathway). In contrast to ArrayUnlock, this pathway anal-ysis tool generates networks where the differentially regu-lated genes can be reregu-lated according to previously known associations between genes or proteins, but independ-ently of established canonical pathways. Moreover, net-works are associated to functions according to the molecules involves.
Results
Functional analysis and biological enrichment by ArrayUnlock
in comparison MM8_MM24, showing a clear different response to a homologous second immunization associ-ated to the time. On the other hand, the results obtained in MM8_PM8 for KEGG (Table 2) show pathways differ-entially altered among a primary and a secondary immune response. Most of these pathways were no present in the other two comparisons which shows that in both MA8 and MM24 such a typical secondary response was developed as in MM8.
Functional analysis by IPA
IPA identified significant networks, top functions and canonical pathways associated with the differentially expressed genes for each comparison analyzed (see Addi-tional file 8). The first networks scored for the MM8_MM24 and MM8_PM8 comparisons are presented in Additional file 9. A similar result to that obtained with ArrayUnlock was obtained for the comparison MM8_MA8, a lower number of genes significantly associ-ated to biological functions (a maximum of five genes per
function) compared with the other two comparisons. Similarly, in this comparison, only five canonical path-ways were significant. In the comparison MM8_MM24 seven out of the ten most significant canonical pathways were related to cellular signalling, e.g.: cAMP signalling; integrin signalling; actin cytoskeleton mediated signal-ling; and G-coupled receptor signaling. Interestingly, in this comparison the functions more significant and with higher number of genes implicated correspond to 'cell morphology', 'cellular assembly and organization', and 'cellular development' being most genes down-regulated. In the comparison MM8_PM8 the 'immune response' and 'immune and lymphatic system development and func-tion' are among the most significant functions altered. Then, most genes related to proliferation and maturation of B lymphocytes, recruitment of macrophages and anti-gen presenting cells, increasing of NK cells and T-cells were up-regulated. As an example, the T cell receptor sig-nalling canonical pathway obtained by IPA and associated Table 1: Top ten Biological Processes significantly altered in ArrayUnlock analysis. In brackets, number of genes from the input file implicated in each annotation. Significance at p < 0.05.
Biological Process
MM8_MA8 MM8_MM24 MM8_PM8
- Regulation of transcription DNA-dependent (5) - Signal transduction (34) - Signal transduction (84)
- Metabolic process (4) - Transcription (24) - Regulation of transcription, DNA-dependent
(71)
- Cell adhesion (4) - Cell adhesion (19) -Transcription (65)
- Transcription (4) -Multicellular organismal development (18) - Multicellular organismal development (44) - Actin cytoskeleton organization and biogenesis
(4)
- Ion transport (15) - Cell cycle (34)
- Cytoskeleton organization and biogenesis (2) - Protein amino acid phosphorylation (13) - Protein transport (33)
- Chromatin modification (2) - Cell differentiation (12) - Metabolic process (30)
- Small GTPase mediated signal transduction (2) - Nervous system development (12) - Apoptosis (29)
-Integrin-mediated signalling pathway (2) - Cell cycle (12) - Cell adhesion (28)
-Cation transport (2) - Protein transport (11) - Protein amino acid phosphorylation (28)
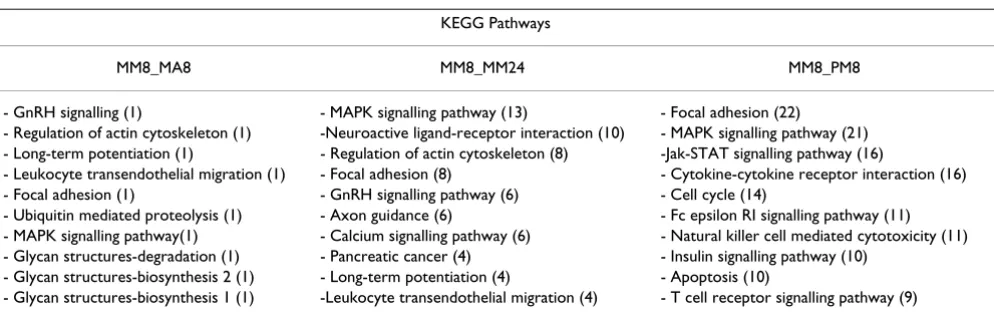
Table 2: Top ten KEGG Pathways significantly altered in ArrayUnlock analysis. In brackets, number of genes from the input file implicated in each annotation. Significance at p < 0.05.
KEGG Pathways
MM8_MA8 MM8_MM24 MM8_PM8
- GnRH signalling (1) - MAPK signalling pathway (13) - Focal adhesion (22)
- Regulation of actin cytoskeleton (1) -Neuroactive ligand-receptor interaction (10) - MAPK signalling pathway (21) - Long-term potentiation (1) - Regulation of actin cytoskeleton (8) -Jak-STAT signalling pathway (16)
- Leukocyte transendothelial migration (1) - Focal adhesion (8) - Cytokine-cytokine receptor interaction (16)
- Focal adhesion (1) - GnRH signalling pathway (6) - Cell cycle (14)
- Ubiquitin mediated proteolysis (1) - Axon guidance (6) - Fc epsilon RI signalling pathway (11)
- MAPK signalling pathway(1) - Calcium signalling pathway (6) - Natural killer cell mediated cytotoxicity (11)
- Glycan structures-degradation (1) - Pancreatic cancer (4) - Insulin signalling pathway (10)
- Glycan structures-biosynthesis 2 (1) - Long-term potentiation (4) - Apoptosis (10)
with the differentially expressed genes for the comparison MM8_PM8 is shown Figure 1.
Conclusion
The results of the analysis were highly dependent of hav-ing the most complete annotation available in the data set file. According to this, the creation of the 'working file' was critical in order to take the maximum advantage of the analysis what can be considered as a drawback of both tools.
Both tools provided, information for a global understand-ing of the underlyunderstand-ing biological processes, independently. First, homologous and heterologous second infection induces similar changes in gene expression, although some differences were found associated to several biolog-ical functions. Second, the response upon a second homologous infection varied with the time and differed significantly in a relative high number of biological func-tions. And third, a core of biological functions and path-ways associated to a secondary response were similar when the second challenge varied in the time and also in the case of a heterologous secondary infection.
T cell receptor signalling canonical pathway obtained by IPA obtained in comparison MM8_PM8
Figure 1
T cell receptor signalling canonical pathway obtained by IPA obtained in comparison MM8_PM8. Up- and
The two analytical tools provided overlapping informa-tion so as complementary informainforma-tion. Main differences were due to databases used for each tool. UrrayUnlock results are based in gene ontology terms or KEGG annota-tions widely known and used in other analytical tools and able to be consulted in free-access databases. On the other side, IPA makes use of a non public bibliographic data-base and own terminology for functions classification that not always are directly correlated with GO terms. An advantage of Ingenuity was that this tool classify the genes implicated in each function within sub-functions and pro-vide direct link of each molecule to the bibliographic ref-erence were that relationship is described. The results obtained for both tool to identify altered established pathways (canonical pathways in IPA and KEGG path-ways in ArrayUnlock) were similar, however, IPA inte-grates the information of the differentially expressed genes within the figures highlighting the up or down reg-ulation. In general, IPA provided a better presentation of the results and an easier identification of molecules impli-cated in each function within the interface of the software. Moreover, IPA generates networks where the differentially regulated genes can be related according to previously known associations between genes or proteins, but inde-pendently of established canonical pathways.
Competing interests
The authors declare that they have no competing interests.
Authors' contributions
MRB learned the management of the two tools and trained to the rest member's group. The comparisons were analyzed by MRB, CA, MCR and AJM. AJM conducted the documentation and communication related to the work-shop to the other group members. JJG coordinated and supervised the working team.
Additional material
Additional file 1
Working files. Gene annotation, fold-change, and the identifier of the original data are shown.
Click here for file
[http://www.biomedcentral.com/content/supplementary/1753-6561-3-S4-S6-S1.xls]
Additional file 2
ArrayUnlock Biological Process. File contains information about: biolog-ical function annotation; p-value and corrected p-value; number of genes of our list implicated in each annotation; number of gene from the Arra-yUnlock database implicated in this annotation; and finally, a description of each GO biological function annotation.
Click here for file
[http://www.biomedcentral.com/content/supplementary/1753-6561-3-S4-S6-S2.xls]
Additional file 3
ArrayUnlock Molecular Functions. File contains information about: bio-logical function annotation; p-Value and corrected p-Value; number of genes of our list implicated in each annotation; number of gene from the ArrayUnlock database implicated in this annotation; and finally, a description of each GO biological function annotation.
Click here for file
[http://www.biomedcentral.com/content/supplementary/1753-6561-3-S4-S6-S3.xls]
Additional file 4
ArrayUnlock Cellular Components. File contains information about: biological function annotation; p-Value and corrected p-Value; number of genes of our list implicated in each annotation; number of gene from the ArrayUnlock database implicated in this annotation; and finally, a description of each GO biological function annotation.
Click here for file
[http://www.biomedcentral.com/content/supplementary/1753-6561-3-S4-S6-S4.xls]
Additional file 5
ArrayUnlock KEGG Pathways. File contains information about: biolog-ical function annotation; p-Value and corrected p-Value; number of genes of our list implicated in each annotation; number of gene from the Arra-yUnlock database implicated in this annotation; and finally, a description of each GO biological function annotation.
Click here for file
[http://www.biomedcentral.com/content/supplementary/1753-6561-3-S4-S6-S5.xls]
Additional file 6
ArrayUnlock INTERPROMotifs. File contains information about: bio-logical function annotation; p-Value and corrected p-Value; number of genes of our list implicated in each annotation; number of gene from the ArrayUnlock database implicated in this annotation; and finally, a description of each GO biological function annotation.
Click here for file
[http://www.biomedcentral.com/content/supplementary/1753-6561-3-S4-S6-S6.xls]
Additional file 7
Graphical representation as horizontal-bar (A) and pie chart (B) of the results obtained for Biological Process using ArrayUnlock software for the comparison MM8_PM8.
Click here for file
[http://www.biomedcentral.com/content/supplementary/1753-6561-3-S4-S6-S7.doc]
Additional file 8
IPA top Networks, BioFunctions and Canonical Pathways for the three comparisons analyzed.
Click here for file
[http://www.biomedcentral.com/content/supplementary/1753-6561-3-S4-S6-S8.xls]
Additional file 9
The first network identified by IPA analysis for MM8_MM24 and MM8-PM8 analysis.
Click here for file
Publish with BioMed Central and every scientist can read your work free of charge "BioMed Central will be the most significant development for disseminating the results of biomedical researc h in our lifetime."
Sir Paul Nurse, Cancer Research UK
Your research papers will be:
available free of charge to the entire biomedical community
peer reviewed and published immediately upon acceptance
cited in PubMed and archived on PubMed Central
yours — you keep the copyright
Submit your manuscript here: BioMedcentral
Acknowledgements
Authors are grateful to anonymous reviewers and editor for their com-ments and suggestions. Acknowledgement to EADGENE and SABRE for finance the workshop. To ASG-Lelystad for host the workshop meeting. Caroline Channing and Sandrine Ayuso for the organization. Annemarie Rebel and colleagues to offer their data set for the analysis.
This article has been published as part of BMC Proceedings Volume 3 Sup-plement 4, 2009: EADGENE and SABRE Post-analyses Workshop. The full contents of the supplement are available online at http://www.biomedcen tral.com/1753-6561/3?issue=S4.
References
1. Hedegaard J, Arce C, Bicciato S, Bonnet A, Ramerez-Boo M, Buiten-huis AJ, Collado-Romero M, Conley LN, SanCristobal M, Ferrari F, et al.: Methods for interpreting lists of affected genes obtained in a DNA microarray experiment. BMC Proceedings 2009, 3(Suppl 4):S5.
2. [http://www.ark-genomics.org/microarrays/bySpecies/chicken/]. 3. ArrayUnlock software web link [http://www.integromics.com/
ArrayUnlock.php]