P R O C E E D I N G S
Open Access
A powerful statistical method identifies novel loci
associated with diastolic blood pressure triggered
by nonlinear gene-environment interaction
Honglang Wang, Tao He, Cen Wu, Ping-Shou Zhong, Yuehua Cui
*From
Genetic Analysis Workshop 18
Stevenson, WA, USA. 13-17 October 2012
Abstract
The genetic basis of blood pressure often involves multiple genetic factors and their interactions with environmental factors. Gene-environment interaction is assumed to play an important role in determining individual blood pressure variability. Older people are more prone to high blood pressure than younger ones and the risk may not display a linear trend over the life span. However, which gene shows sensitivity to aging in its effect on blood pressure is not clear. In this work, we allowed the genetic effect to vary over time and propose a varying-coefficient model to identify potential genetic players that show nonlinear response across different age stages. We detected 2 novel loci, geneMIR1263(a microRNA coding gene) on chromosome 3 and geneUNC13B
on chromosome 9, that are nonlinearly associated with diastolic blood pressure. Further experimental validation is needed to confirm this finding.
Background
The genetic basis of a complex trait often involves multi-ple genetic factors functioning in a coordinated manner. The extent to which our genetic blueprint expresses also depends on the interactions between genetic and envir-onmental factors. Increasing evidence shows the impor-tance of gene-environment (G × E) interactions in determining the risk of a variety of diseases such as respiratory diseases [1], obesity [2], and psychiatric disor-ders [3]. For a review of G × E interaction, see the work of Hunter [4]. The empirical evidence underscores the importance of developing novel statistical approaches to identify major genetic players that are sensitive to envir-onmental stimuli and to further understand how they function.
Blood pressure is a heritable trait influenced by several biological pathways sensitive to environmental stimuli. High blood pressure, or hypertension, affects more than 1 billion people worldwide. It damages an individual’s body in many ways over time, leading to heart disease,
stroke, kidney failure, and other health problems [5]. Age is known to be a risk factor for high blood pressure. Systolic blood pressure rises with age, whereas the diasto-lic blood pressure tends to fall. For people with preexist-ing high blood pressure, this age-related pattern occurs even if the blood pressure is well controlled with medica-tion [6]. The reasons why blood pressure changes with age are still poorly understood, but are a topic of intense research. Thus, age should be an important predictor when searching for genetic players responsible for hyper-tension. However, few studies have considered an age-dependent mechanism in their analysis.
The genetic response to age in blood pressure fits in well with the classical G × E interaction framework. G × E interaction typically refers to the manner in which geno-types influence phenogeno-types differently in different environ-ments [7]. From a biological point of view, G × E interaction can be better viewed as the genetic responses to environment changes or stresses [8]. Statistically, inter-action is considered as a departure from additivity when fitting a linear regression model with 1 or more product terms, for example,
* Correspondence: [email protected]
Department of Statistics & Probability, Michigan State University, 619 Red Cedar Rd. Rm C432, East Lansing, MI 48824, USA
Y=α0+α1X+β1G+β2XG+ε=(α0+α1X)+(β1+β2X)G+ (1)
whereYis a quantitative trait (diastolic blood pressure in this analysis),Gis the genetic variable, Xis the envir-onmental variable (age), and is the error term. This is a classical linear model for G × E interaction analysis. As can be seen, equation (1) automatically assumes a linear interaction mechanism between Gand X because the coefficient forGis a linear function inX. However, the contribution of the same gene to blood pressure may be quite different at different age levels. This nonlinear penetrance can be well understood by a statistical vary-ing-coefficient (VC) model [9]. VC models allow the coefficients to change smoothly and nonlinearly with other variables so that one can explore the dynamic fea-ture of a response over time with great flexibility and nice interpretability [10].
In this work, we applied VC models to detect genetic variants associated with diastolic blood pressure from the Genetic Analysis Workshop 18 (GAW18) data with 142 unrelated individuals. We allowed the contribution of genetic variants to blood pressure to vary over time via varying coefficients. We further proposed a sequence of hypothesis tests to evaluate whether the effect of a genetic variant is sensitive to aging, and if it is, is it in a linear or nonlinear fashion? Using this analysis, we identified 2 novel loci that show nonlinear effects over time to affect blood pressure.
Methods
The model
The nonlinear VC model is defined as
Y=m(X,G)+σ (X) (2)
for given(X,G)and the responseY withE(|X,G) = 0 andVar(—X,G)= 1;σ2(X) =Var(Y|X,G)is the
condi-tional variance function. The mean function is defined asm(X,G) =α(X) +β(X)G,where β (X)is a smoothing function in X. Under the VC modeling framework, the effect of a gene is allowed to vary as a function of envir-onmental factors, either linearly or nonlinearly, captured by the model itself. Thus, the VC model has the poten-tial to dissect the nonlinear penetrance of genetic var-iants. Here we also allow nonlinear function of XwithY
modeled byα (X). This nonlinear term adjusts the non-linear effect of X when estimating the nonlinear effect ofβ(X). If we takeα (X)=α0+α1X,equation (1) is just
a special case of the VC model whenβ(X) =β1+β2X.
Hypothesis testing
The following list shows all 4 mean models involved in our analysis.
•Model 1:m(X,G) =α(X),no genetic effect at all;
•Model 2:m(X,G) =α(X) +βG,linear genetic effect without interaction;
• Model 3: m(X,G) =α(X) + (β0+β1X)G, linear
genetic effect with interaction; and
• Model 4: m(X,G) =α(X) +β(X)G, nonlinear genetic effect.
We first assess whether the genetic coefficients vary with × by formulating the following hypotheses,
H10:β (X)=βfor some constantβvs.Ha1:β (X)=βfor anyβ
Rejecting the null indicates that potential gene-age (G × age) interaction may exist. Otherwise, we conclude there is no G × age effect and we fit mean model 2 to test for association. Because the traditional linear interaction model given in equation (1) is a special case of the pro-posed VC model, we next test significance of a linear effect if the above null is rejected, by formulating the following hypotheses,
H20:β (X)=β0+β1Xfor some constants β0,β1
H2a:β (X)=β0+β1X for anyβ0,β1
Failure to reject the null indicates that there is a linear G × age effect, so we fit mean model 3 to assess associa-tion. Otherwise, we conclude that the G × age interac-tion is nonlinear. We then assess the nonlinear genetic effect over age by formulating the hypotheses,
H30:β (X)= 0, vsH3a:β (X)= 0
The rejection of the null indicates that the genetic effect is sensitive to age in a nonlinear fashion. The sequence of hypothesis tests stated above was suggested by Ma et al [9] for optimal power to detect association.
Model implementation
We fit the varying coefficients with a B-spline technique for bothα(·)andβ(·)functions. TheXvariable was first transformed to make it more evenly distributed on each subinterval used in the B-spline smoothing technique. The great advantages of B-spline estimation over other nonparametric techniques are simple implementation and fast computing [9]. For each single-nucleotide poly-morphism (SNP),α(X)in mean model 1 was estimated by considering the following least square problem,
argmin{λs}N+p+1
whereNis the number of interior knots,pis the degree of B-splines, andGp={Bs}s=1,2,...,N+p+1is the set of basis
and the degreepof the B-splines, we used the Bayesian number of knotsNαand degreepαwere applied to esti-mate functionα(X)when fitting mean models 2 to 4.
For mean model 4, the coefficient functionsα(x)and β(x)were estimated by,
selected following the above BIC criterion.
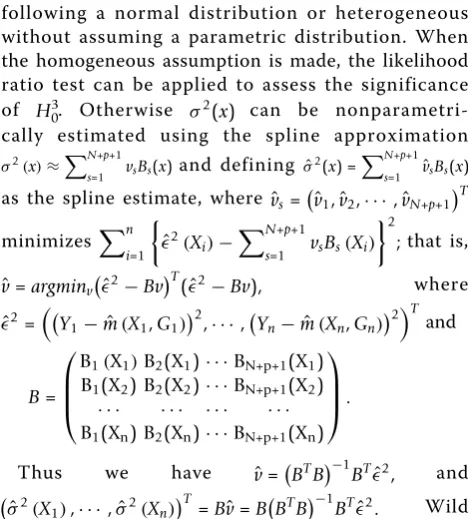
The error termσ(X)can be assumed homogeneous following a normal distribution or heterogeneous without assuming a parametric distribution. When the homogeneous assumption is made, the likelihood ratio test can be applied to assess the significance of H30. Otherwise σ2(x) can be nonparametri-cally estimated using the spline approximation σ2(
bootstrap can be applied to assess the significance ofH30
[11].
Results
We applied the above models to the GAW18 genome-wide association data. We focused our analysis on dia-stolic blood pressure (DBP) to identify any genetic players that can explain the variability of DBP triggered by nonlinear genetic penetrance over time. We treated DBP as the response Yand age as the X variable. The genetic variableGis coded following an additive model, that is,G= 1, 0,−1, corresponding to genotypeAA, Aa, aa, respectively. In total, 142 individuals and 388,099
SNPs were left after removing SNPs with a minor allele frequency less than 0.05. These SNPs are distributed on odd-numbered chromosomes from chromosome 1 to chromosome 21.
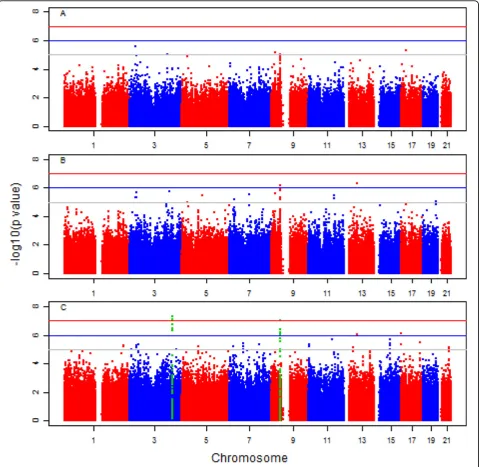
Figure 1 shows the Manhattan plots ofpvalues when assessing significance by fitting different models. The overallpvalue patterns for the 3 models are quite similar. Two known and 1 unknown gene show strong nonlinear genetic effects (indicated by smallpvalues in columns 7 and 8 in Table 1). A strong signal was detected in chro-mosome 3 containing a microRNA coding gene, MIR1263, and in chromosome 9 containing the gene UNC13B. MIR1263may play a regulatory role. The sig-nals at geneUNC13Bare quite consistent for the 3 mod-els. This gene was reported to be related with increased risk of nephropathy in patients with type 1 diabetes. Nephropathy accounts for 40% of end-stage renal disease and is associated with high cardiovascular morbidity and mortality [12].
Table 1 lists SNPs withpvalues less than 5 × 10⁻⁷. These SNPs show strong nonlinear effects over time to affect DBP, especially for SNPs in chromosome 3 (indi-cated by smallp42andp43in Table 1). These SNPs can
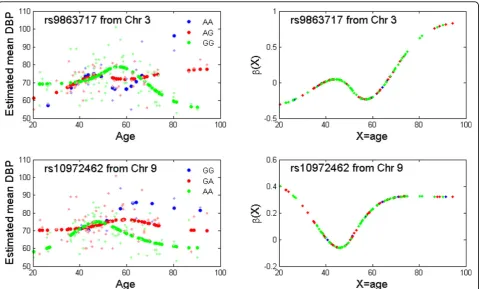
be easily missed by fitting traditional linear models. For illustration purposes, Figure 2 shows the fitted mean DBP function and the genetic effects of 2 SNPs in genes
MIR1263 and UNC13B. For SNP rs9863717 in gene
MIR1263, DBP decreases after age 55 years for indivi-duals carrying genotype GG, whereas it increases for individuals carrying genotype AA. Thus, for a senior per-son who carries genotype AA at this locus, the chance to develop hypertension is higher than for others. For SNP rs10972462 in gene UNC13B, large DBP variability among the 3 genotype groups is observed after age 50 years, and a decreasing pattern is observed roughly after age 65 years. Among the 3 genotype groups, DBP is higher in the GG group, followed by the GA and AA groups. From the prevention and therapeutic point of view, people carrying genotype GG at rs10972462 locus should pay special attention after age 50 years, and so should those carrying AA genotype at rs9863717 locus after age 65 years.
Discussion and conclusions
mutations in genesHES7andMESP2are sensitive to differ-ent degrees of hypoxia, which is responsible for a nonlinear increase in the severity and penetrance of vertebral defects. Our analysis identified 2 novel loci associated with DBP with nonlinear genetic effects. They can be missed by the traditional linear interaction model. However, because statis-tical significance does not necessarily imply causality, further experimental validation is needed to confirm the finding.
As shown in Ma et al [9], the VC model loses power because of high degrees of freedom in the test in cases
where the genetic effect is not very complex, such as in a linear form. Thus one should assess constant or linear effects first, followed by fitting the corresponding model suggested by the results of the tests. In this analysis, we found that the coefficients are constant for most SNPs.
Note that the functionα(X)models the overall mean of DBP over time when there is no genetic effect. When a linear structure for α (X)(=α0+α1X)is forced, we
observe inflated signals for testingH0:β (X)= 0. Thus,
the incorporation of this nonlinear function can largely
Figure 1Manhattan plots of thepvalues for assessing significance of:.A,H0:β= 0by fitting mean model 2; (B)H0:β0=β1= 0 by fitting mean model 3; and (C)H0:β(X) = 0by fitting mean model 4. Solid red, blue, and gray lines correspond to significance levels of 10−6,10−6, and10−5, respectively.
Table 1 List of SNPs withpvalue <5 × 10⁻⁷
rs ID Gene name Chr p41 p31 p21 p42 p43
rs1086097 MIR1263 3 1.9 × 10⁻⁷ 0.009 0.90 4.97 × 10⁻⁸ 1.08 × 10⁻⁶
rs686697 MIR1263 3 3.4 × 10⁻⁷ 0.005 0.76 9.24 × 10⁻⁸ 3.41 × 10⁻⁶
rs483558 unknown 3 4.7 × 10⁻⁷ 0.007 0.76 1.30 × 10⁻⁷ 3.72 × 10⁻⁶
rs9863717* unknown 3 4.96 × 10⁻⁸ 0.009 0.95 1.23 × 10⁻⁸ 2.55 × 10⁻⁷
rs1575160* unknown 3 8.7 × 10⁻⁸ 0.011 0.70 2.33 × 10⁻⁸ 3.76 × 10⁻⁷
rs723877 UNC13B 9 4.3 × 10⁻⁷ 1.25 × 10⁻⁶ 2.37 × 10⁻⁵ 6.1 × 10⁻⁴ 0.02
rs10972462* UNC13B 9 9.5 × 10⁻⁸ 6.96 × 10⁻⁷ 1.31 × 10⁻⁵ 2.3 × 10⁻⁴ 0.007
*Indicates significant SNPs after Bonferroni correction.p41,p31,andp21arepvalues for testingH3
0:β(X) = 0(mean model 4 vs. mean model 1),
H02:β0=β1= 0(mean model 3 vs. mean model 1), andH01:β = 0(mean model 2 vs. mean model 1), respectively;p42andp43arepvalues for
reduce false positives. In this analysis we coded the genetic variable G in an additive fashion, although other disease models such as dominant or recessive can also be assumed, while the optimal one can be selected based on a model selection criterion such as BIC.
Competing interests
The authors declare that they have no competing interests.
Authors’contributions
HLW conducted the analysis and drafted the manuscript; TH, CW, and PSZ participated the discussion and helped with the analysis; YHC conceived the
idea and wrote the manuscript. All authors read and approved the final manuscript.
Acknowledgements
We greatly appreciate the GAW18 data provider and the National Institutes of Health grant that supports GAW18. We also wish to thank the anonymous reviewer for the insightful comments that greatly improved the manuscript. This work was partially supported by National Science Foundation grants DMS-1209112 and IOS-1237969. The GAW18 whole genome sequence data were provided by the T2D-GENES Consortium, which is supported by NIH grants U01 DK085524, U01 DK085584, U01 DK085501, U01 DK085526, and U01 DK085545. The other genetic and phenotypic data for GAW18 were provided by the San Antonio Family Heart Study and San Antonio Family Diabetes/Gallbladder Study, which are supported by NIH grants P01 HL045222, R01 DK047482, and R01
DK053889. The Genetic Analysis Workshop is supported by NIH grant R01 GM031575.
This article has been published as part ofBMC ProceedingsVolume 8 Supplement 1, 2014: Genetic Analysis Workshop 18. The full contents of the supplement are available online at http://www.biomedcentral.com/ bmcproc/supplements/8/S1. Publication charges for this supplement were funded by the Texas Biomedical Research Institute.
Published: 17 June 2014
References
1. Kleeberger SR, Peden D:Gene-environment interactions in asthma and other respiratory diseases.Annu Rev Med2005,56:383-400.
2. Qi L, Cho YA:Gene-environment interaction and obesity.Nutr Rev2008, 66:684-694.
3. Caspi A, Moffitt TE:Gene-environment interactions in psychiatry: joining forces with neuroscience.Nat Rev Neurosci2006,7:583-590.
4. Hunter DJ:Gene-environment interactions in human diseases.Nat Rev Genet2005,6:287-298.
5. The International Consortium for Blood Pressure Genome-Wide Association Studies:Genetic variants in novel pathways influence blood pressure and cardiovascular disease risk.Nature2011,478:103-109.
6. Kannel WB:Blood pressure as a cardiovascular risk factor: prevention and treatment.JAMA1996,275:1571-1576.
7. Falconer DS:The problem of environment and selection.Am Nat1952, 86:293-298.
8. Hoffman AA, Parsons PA:Evolutionary Genetics and Environmental Stress. New York, Oxford University Press; 1991.
9. Ma S, Yang L, Romero R, Cui Y:Varying coefficient model for gene-environment interaction: a non-linear look.Bioinformatics2011, 27:2119-2126.
10. Fan J, Zhang W:Statistical methods with varying coefficient models.Stat Interface2008,1:179-195.
11. Härdle W, Mammen E:Comparing nonparametric versus parametric regression fits.Ann Stat1993,21:1926-1947.
12. EURAGEDIC Consortium: G/T Substitution in intron 1 of the UNC13B gene is associated with increased risk of nephropathy in patients with type 1 diabetes. Diabetes2008,57:2843-2850.
13. Laitala VS, Kaprio J, Silventoinen K:Genetics of coffee consumption and its stability.Addiction2008,103:2054-2061.
14. Sparrow DB, Chapman G, Smith AJ, Mattar MZ, Major JA, O’Reilly VC, Saga Y, Zackai EH, Dormans JP, Alman BA,et al:A mechanism for gene-environment interaction in the etiology of congenital scoliosis.Cell2012, 149:295-306.
doi:10.1186/1753-6561-8-S1-S61
Cite this article as:Wanget al.:A powerful statistical method identifies novel loci associated with diastolic blood pressure triggered by nonlinear gene-environment interaction.BMC Proceedings2014 8(Suppl 1):S61.
Submit your next manuscript to BioMed Central and take full advantage of:
• Convenient online submission
• Thorough peer review
• No space constraints or color figure charges
• Immediate publication on acceptance
• Inclusion in PubMed, CAS, Scopus and Google Scholar
• Research which is freely available for redistribution