P R O C E E D I N G S
Open Access
An aggregating
U-Test for a genetic association
study of quantitative traits
Ming Li, Wenjiang Fu, Qing Lu
*From
Genetic Analysis Workshop 17
Boston, MA, USA. 13-16 October 2010
Abstract
We propose a novel aggregatingU-test for gene-based association analysis. The method considers both rare and common variants. It adaptively searches for potential disease-susceptibility rare variants and collapses them into a single“supervariant.”A forwardU-test is then used to assess the joint association of the supervariant and other common variants with quantitative traits. Using 200 simulated replicates from the Genetic Analysis Workshop 17 mini-exome data, we compare the performance of the proposed method with that of a commonly used approach, QuTie. We find that our method has an equivalent or greater power than QuTie to detect nine genes that
influence the quantitative trait Q1. This new approach provides a powerful tool for detecting both common and rare variants associated with quantitative traits.
Background
In the past decade, extensive genome-wide association stu-dies (GWAS) have been conducted to understand the genetic etiology of complex diseases. However, the com-mon variants identified so far explain only a small fraction of the variations of complex diseases [1]. It now seems clear that the genetic etiology of complex diseases is highly heterogeneous. Some genetic mutations, although indivi-dually rare, may impose a high risk for the development of diseases [2]. These rare variants have been the recipients of growing attention by investigators. With the fast devel-opment of biotechnology, it is now feasible to genotype rare sequence variations in the general population with unprecedented speed [3]. Meanwhile, statistical methods are greatly needed to detect the association between these genetic variants and common complex diseases.
The most commonly used approach for detecting the association between rare variants and disease outcome is to collapse multiple rare variants into a single“supervariant,” which is tested further as a common variant. Based on this idea, Li and Leal developed a combined multivariate and collapsing (CMC) method for rare variant analysis [4].
This method was further extended for quantitative traits and was implemented in the software package QuTie [5]. In the past two years, a number of collapsing methods that use various strategies have been proposed, and they pro-vide alternatives to the CMC method [6]. Compared to the multivariate analysis of multiple rare variants, these collap-sing methods could reduce the degrees of freedom by creating a single supervariant composed of multiple indivi-dual rare variants, thus improving the testing power. In addition, testing on a single supervariant could reduce the burden of multiple testing. However, the existing methods also have a few limitations that may affect their perfor-mance. Collapsing all the rare variants in the same gene or genomic region, although biologically meaningful, can also introduce nonfunctional variants into the supervariant, which may diminish the signal that the functional variants carry. Intuitively, this limitation can be addressed by collap-sing only a subset of the disease-susceptibility rare variants. In what follows, we refer to the collapsing process using trait information as aggregation.
In this paper, we propose an aggregating U-test to examine the association between the quantitative traits and multiple genetic variants, including both rare and common variants. First, the method adaptively collapses the disease-susceptibility rare variants into a supervariant; it then searches the supervariant and the remaining * Correspondence: [email protected]
1
Department of Epidemiology, Michigan State University, B601 West Fee Hall, East Lansing, MI 48824, USA
common variants for the best multi-SNP (single-nucleo-tide polymorphism) combination, using a forward selec-tion. We have applied our method to the Genetic Analysis Workshop 17 (GAW17) mini-exome data and compared its performance with QuTie.
Methods
We have recently developed a forwardU-test to detect gene-gene interactions using general multisampleU sta-tistics [7]. Here, we first describe the definition ofU sta-tistics and then explain the aggregation of rare variants and the forward selection of multi-SNP combinations usingUstatistics.
Suppose that we have a study population ofN sub-jects. LetYi denote the observed value of the quantita-tive trait for the ith individual (i = 1, 2, …, N); and let
Xi=Xi1, Xi2,…, XiK, denote the genotypes ofK SNPs for theith individual, each taking its value from one of the three possible genotypes, XijÎ {AA, Aa,aa}, j= 1, 2,…, K. Without loss of generality, we assume thatais the minor allele, and the first r SNPs (Xi1, Xi2, …,Xir) are rare variants.
Ustatistics
Suppose that we haveLmulti-SNP genotypes formed by
kSNPs of interest, denoted as G1, G2, …,GL. A multi-SNP genotype Gl is defined here as a vector of the k genotypes that an individual carries (e.g.,g1, g2, …, gk). The k SNPs and L multi-SNP genotypes are selected sequentially out of a total ofKgenotyped SNPs (see the
“ForwardU-test”section for details). Let:
Sl=
{
i X: i =Gl}
, l=1 2, , ..., ,L (1)be the set of subjects carrying multi-SNP genotypeGl, and let ml = |Sl| be the number of subjects in Sl. We measure the trait difference between two sets of subjects
SlandSl′as:
where the kernel function is chosen as:
j
(
Y Yi, j)
=Yi−Yj. (3)Ul,l′, is the summation of all possible pairwise trait com-parisons for any two subjects fromSlandSl′. In the pre-sence of an association, we would expect individuals carrying different multi-SNP genotypes to have different trait values (e.g., those carrying a high-risk multi-SNP gen-otype would have higher trait values than those carrying a low-risk multi-SNP genotype). Based onUl,l′, we can form the global U statistic. We assume that the expected
quantitative trait value of theL multi-SNP genotypes decreases withl(i.e., E Y( S1)≥E Y( S2)≥≥E Y( SL)). Prac-tically, we sort the multi-SNP genotypes according to their average trait values (i.e., YS YS YS
L
1 ≥ 2 ≥≥ ). We define the globalUstatistic forLsets of subjects with different multi-SNP genotypes as:
Here, the weight parameterωl,l′ is chosen to account for the number of subjects in each genotype group. This globalU statistic measures the overall trait differences among individuals from a total number of Lmulti-SNP genotype groups. It is equivalent to Eq. (2) whenL= 2.
Aggregation of the rare variants
When dealing with a large number of rare variants, it is likely that a significant proportion of the rare variants will not be associated with a disease; thus collapsing on a selected subset of rare variants will be necessary. Each rare variant can form two single-SNP genotypes, {g1 = Aa|aa,g2=AA}, for which aUstatistic can be
calcu-lated by using Eq. (2). We rank the U statistics in decreasing order asU(1),U(2),…,U(r). Assume that V(1), V(2), …, V(r) are the corresponding rare variants in a
candidate gene and that Xi(1), Xi(2), …, Xi(r)are their
observed genotypes for individuali. We start from var-iantV(1), and define a supervariant as:
R X aa Aa
At each step of the aggregation process, we add a rare variant with the largest Ustatistic to the supervariant. Accordingly, we redefine the supervariant as:
Rij=⎧⎨⎪ Ri j = Xi j =aa Aa ≤ ≤j r
The supervariant in Eq. (7) always forms two different genotypes, {Rij = 1,Rij = 0}, for which a Ustatistic can be calculated using Eq. (2). The collapsing procedure stops at stept, where the Ustatistics start to decrease
(i.e., UR UR UR UR
t t
1 ≤ 2 ≤≤ > +1).
ForwardU-test
with the trait [7]. We start the process by treating all individuals as a single group. In the first step, each common SNP j can form two single-SNP
geno-types,
{
g1j,g2j}
, in three possible ways, denotedg1j=Aa g2j =AA aa
{
, |}
,{
g1j =Aa g, 2j =AA aa|}
, andg1j =aa g2j =AA Aa
{
, |}
. As a special case, thesupervar-iant can form only two single-SNP genotypes,
g1R=1 gR2 =0
{
,}
. This leads to a total of 3(K − r) + 1 possible grouping strategies, which can be representedby
{
G1( )1 =g1j,G( )21 =g2j}
, where Gl s( ) denotes the lth
multi-SNP genotype at steps. AU statistic can be
cal-culated for two sets of subjects grouped by G1 G
1
The SNP with the largest Ustatistic value is selected, and the corresponding grouping is recorded.
In the second step, based on the first selected SNP, a second SNP j′ is chosen to form four two-SNP geno-types, denoted by {G1( )2 =G1( )1 ∧g1j′, G2( )2 =G1( )1 ∧g2j′,
G4( )2 =G2( )1 ∧g2j′, G( )42 =G2( )1 ∧g2j′}. We calculate the globalUstatistics for each of these grouping strategies using Eq. (4) and choose the one with the largestU sta-tistics. It should be noted that, if the same SNP from step 1 is chosen in step 2, then only three single-SNP genotypes will be formed, denoted by {G1( )2 =AA,
G3( )2 =aa, G3( )2 =aa}. As the algorithm moves forward, theUstatistic is expected to increase until groups can-not be split further. This results in a series of models with different numbers of groups. The best model, with the appropriate number of groups, can be determined by using a 10-fold cross-validation procedure. The U statistic of the best model is calculated using the whole data set, and the significance of its association can be obtained using permutation. For each permutation repli-cate, the same procedure (including the aggregation pro-cess and model selection) is applied to calculate the U statistics. An empirical p-value, which accounts for inflated type I error resulting from model selection, can be calculated by using a large number of permutations.
Results
We applied the proposed method to analyze the quantita-tive trait Q1 in the GAW17 mini-exome data. Thirty-nine SNPs, located in nine genes, were associated with trait Q1. The minor alleles of these SNPs were associated with the higher mean of Q1, and their frequencies ranged from 0.07% to 16.5%. We first adjusted the trait by age, using a linear regression model. The residual scores were then used for our association studies. Based on 200 replicates, we conducted a gene-based association study for each of
the nine causal genes. For each gene, the traits were per-mutated 1,000 times, to generate the empirical null distri-bution of theUstatistics. We then evaluated the power of our method by counting the number of replicates whose
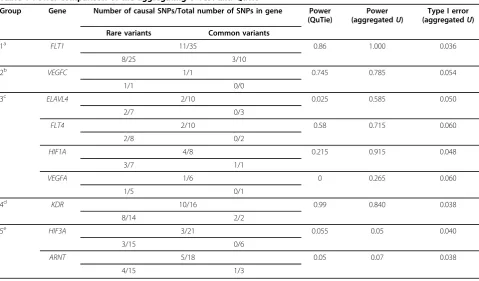
Ustatistics exceeded the 95th percentile of the null distri-bution. A similar analysis was also conducted using QuTie, version 0.2. The threshold for rare variants was chosen as a minor allele frequency (MAF) less than 0.01. The performance of the two methods varied according to the number of SNPs within the genes, the number of cau-sal SNPs, and their effect sizes. We divided the nine genes into five groups accordingly (Table 1).
We found that both methods had a high power to detect the association for genes in group 1 and group 2. As a spe-cial case, gene VEGFChad only one rare variant, and therefore no selection was necessary. Both methods were able to detect this SNP because of its large effect size. The aggregatingU-test showed a significant power improve-ment over QuTie for genes in group 3. For example, gene
ELAVL4was composed of seven rare variants and three common variants, among which only two rare variants were causal. The individual effects of these variants, though relatively high (0.769 and 0.304), were mitigated by collapsing them with other SNPs, which led to low power by QuTie. In addition, both methods had high power to detect the association for genes in group 4, whereas QuTie attained higher power than the aggregating U-test. Because most of the rare variants in the gene were causal and their effects were relatively large, it would be ideal to collapse all the variants. In such a case, the aggregation would have a smaller advantage because the selection pro-cess would introduce additional variations. However, we believe that this is not a common scenario in a real data application. Finally, both methods had low power to detect the association for genes in group 5. For both genes, the selection of rare variants did not show any advantage because of the low effect of each functional rare variant.
Discussion
comparable or even higher power over our method when most (or all) of the variants within a gene are trait related. Moreover, because existing methods do not adopt a model selection algorithm to eliminate the noise loci, they are computationally faster than the proposed method. How-ever, if we make the same assumption as existing methods (i.e., that all the variants are associated with disease), then we could also use the asymptotic result of the proposed method to test for association without model selection and permutation [7]. Under the null hypothesis, asympto-tically the globalUstatistic has a mean of zero and follows a normal distribution.
We also note that the aggregation of rare variants is different from the forward selection of multi-SNP geno-types. During the aggregation process, the supervariant always forms two genotype groups: one with all rare alleles and the other without any rare allele. The corre-spondingUstatistic first increases by adding the risk rare alleles and then decreases when nonrisk rare alleles are added. On the contrary, the number of genotype groups in the forward selection process keeps increasing as the algorithm moves forward, which results in an increasing globalUstatistic (i.e., the model with the largest number of genotype groups has the highest globalUstatistic).
Therefore the cross-validation procedure is necessary for forward selection to avoid overfitting the data. The cross-validation procedure, however, is not practical for the aggregation of rare variants, because their low MAFs may cause the absence of rare alleles in the testing set.
Conclusions
The proposed aggregating U-test provides a powerful tool for genetic association studies with both common and rare variants. Our method could also be useful for identifying disease-susceptibility variants underlying quantitative traits.
Acknowledgments
The Genetic Analysis Workshop is supported by National Institutes of Health grant R01 GM031575. This work is supported by start-up funds from Michigan State University. We wish to thank the two editors and the two anonymous referees for their helpful comments, which improved the manuscript. This article has been published as part ofBMC ProceedingsVolume 5 Supplement 9, 2011: Genetic Analysis Workshop 17. The full contents of the supplement are available online at http://www.biomedcentral.com/1753-6561/ 5?issue=S9.
Authors’contributions
ML developed the method, carried out the analysis and drafted the manuscript. WF participated in the design and helped to draft the manuscript. QL conceived of the study, developed the method, participated
Table 1 Power comparison of the aggregatingU-Test and QuTie
Group Gene Number of causal SNPs/Total number of SNPs in gene Power
(QuTie)
Power (aggregatedU)
Type I error (aggregatedU)
Rare variants Common variants
1a FLT1 11/35 0.86 1.000 0.036
8/25 3/10
2b VEGFC 1/1 0.745 0.785 0.054
1/1 0/0
3c ELAVL4 2/10 0.025 0.585 0.050
2/7 0/3
FLT4 2/10 0.58 0.715 0.060
2/8 0/2
HIF1A 4/8 0.215 0.915 0.048
3/7 1/1
VEGFA 1/6 0 0.265 0.060
1/5 0/1
4d KDR 10/16 0.99 0.840 0.038
8/14 2/2
5e HIF3A 3/21 0.055 0.05 0.040
3/15 0/6
ARNT 5/18 0.05 0.07 0.038
4/15 1/3
a
Common SNPs within a gene are causal with large effect. b
All rare SNPs within a gene are causal with large effect. c
A small proportion of rare variants are causal. d
A majority of rare variants are causal. e
in its design and coordination and helped to draft the manuscript. All authors read and approved the final manuscript.
Competing interests
The authors declare that there are no competing interests.
Published: 29 November 2011
References
1. Schork N, Murray S, Frazer K, Topol KE:Common vs. rare allele hypotheses for complex diseases.Curr Opin Genet Dev2009,19:212-219.
2. McClellan J, King M:Genetic heterogeneity in human disease.Cell2010,
141:210-217.
3. Schuster S:Next-generation sequencing transforms today’s biology.Nat Meth2008,5:16-18.
4. Li B, Leal S:Methods for detecting associations with rare variants for common diseases: application to analysis of sequence data.Am J Hum Genet2008,83:311-321.
5. Lawrence R, Day-Williams A, Elliott K, Morris A, Zeggini E:CCRaVAT and QuTie-enabling analysis of rare variants in large-scale case-control and quantitative trait association studies.BMC Bioinformatics2010,11:527-534. 6. Dering C, Pugh E, Ziegler A:Statistical analysis of rare sequence variants: An overview of collapsing methods.Genet Epidemiol2011,X(suppl X):X-X. 7. Li M, Ye C, Fu W, Elston R, Lu Q:Detecting genetic interactions for
quantitative trait with U statistics.Genet Epidemiol2011,35:1-12.
doi:10.1186/1753-6561-5-S9-S23
Cite this article as:Liet al.:An aggregatingU-Test for a genetic association study of quantitative traits.BMC Proceedings20115(Suppl 9): S23.
Submit your next manuscript to BioMed Central and take full advantage of:
• Convenient online submission
• Thorough peer review
• No space constraints or color figure charges
• Immediate publication on acceptance
• Inclusion in PubMed, CAS, Scopus and Google Scholar
• Research which is freely available for redistribution