Precision of the paleomagnetic method: An example from the Quaternary Eifel
volcanics (Germany)
Harald B¨ohnel1and Elisabeth Schnepp2
1UNICIT-Instituto de Geof´ısica, Universidad Nacional Aut´onoma de M´exico, Campus Juriquilla, Quer´etaro 76226, Mexico 2NLfB-GGA, Arbeitsbereich Grubenhagen, OT Rotenkirchen, D-37574 Einbeck, Germany
(Received October 3, 1998; Revised June 7, 1999; Accepted June 14, 1999)
The total within-site dispersion of paleomagnetic data results from natural misalignment processes and exper-imentally produced dispersion. Although some of the sources of dispersion may be determined by experiments, this is not possible for others. The total accuracy of the paleomagnetic method so far has been determined only on historic lava flows. Thirty-seven Quaternary basaltic lava flows from the Eifel, Germany, have been re-sampled using the same outcrops as before. The new site-mean directions do not differ significantly from those of the original study. The angular distance between pairs of site-mean directions may be approximated by a Fisher distribution. Assuming that both studies are affected by the same natural dispersion processes, we obtain as the best value for the experimental dispersionsexp=4.33◦. The total within-site dispersion shows a log-normal distribution with a mean
ofstot =5.39◦. From these values we calculate that the dispersion due to natural processes in the Eifel volcanic
field issnat=3.21◦.
1.
Introduction
The paleomagnetic method has made important contribu-tions to many fields of the geosciences, including, for ex-ample, plate tectonics, studies of the Earth’s magnetic field, and magnetostratigraphy. Application of the paleomagnetic method generally involves the determination of individual magnetic directions for multiple samples collected at one site, from which a site-mean direction is calculated. This method averages out a number of errors, which are thought to contribute randomly to the site-mean direction. Such er-rors are generated by natural variations of the magnetization directions at the scale of the site, and by experimental proce-dures during field and laboratory work. The total dispersion of the directions may be expressed by Fisher’s (1953) pre-cision parameter,k, and the angular standard deviation, s, which are interrelated bys=81/√k.
Under normal circumstances it is not possible to distin-guish between the dispersion produced by natural directional variations of the magnetization and the dispersion due to ex-perimental errors. For the case of historical lava flows, only a total accuracy of paleomagnetic data (rather than the pa-leomagnetic method) has been reported by Doell and Cox (1963) and by Holcombet al.(1986). The knowledge of pa-leomagnetic data dispersion is important for applications like paleomagnetic dating, correlation, and paleosecular variation studies. In such applications observed site-mean directions are compared with reference data. For dating purposes for instance, the dispersion inherent in the site-mean directions imposes a lower limit on the resolution in time which may
Copy right cThe Society of Geomagnetism and Earth, Planetary and Space Sciences (SGEPSS); The Seismological Society of Japan; The Volcanological Society of Japan; The Geodetic Society of Japan; The Japanese Society for Planetary Sciences.
be achieved by the paleomagnetic method.
In this paper we evaluate paleomagnetic data which were obtained from repeatedly studied rocks, with the aim of de-termining the contribution of experimental errors and thus to obtain a quantitative measure for the precision of the pale-omagnetic method. At the same time, we can estimate the contribution of the natural directional variations of magne-tization to the total dispersion of paleomagnetic data for the Eifel volcanic field, which should be characteristic of other volcanic fields in similar geological environments and with similar magnetic properties.
2.
Errors and Dispersion of Paleomagnetic Data
The question of paleomagnetic data dispersion has re-cently been addressed by Hagstrum and Champion (1994), who studied 10 historic lava flows of Kilauea Volcano (Hawaii), each at 5 to 12 sites. Angular distances between site-mean directions varied from 0.2◦ to 6.6◦, with an aver-age around 3◦. In part, this was due to the detailed sampling with 12 cores, which reduced the 95% confidence circle and may have resulted in larger angular distances. Nevertheless, often this over sampling was not the true reason for that dif-ference, as about 40% of the site-mean directions from the same lava flow were different at the 95% probability level (McFadden and Lowes, 1981). These differences were at-tributed to magnetic anomalies and flow deformation after remanence acquisition, resulting in a varying natural disper-sion for different sites of the same flow. These data do not allow separation of the natural and experimental dispersion inherent in the site-mean directions, as both may have con-tributed by an unknown degree to the total dispersion. Of course, they present a very useful qualitative measure of the possible differences which may be found studying the same
404 H. BOHNEL AND E. SCHNEPP: PRECISION OF THE PALEOMAGNETIC METHOD¨
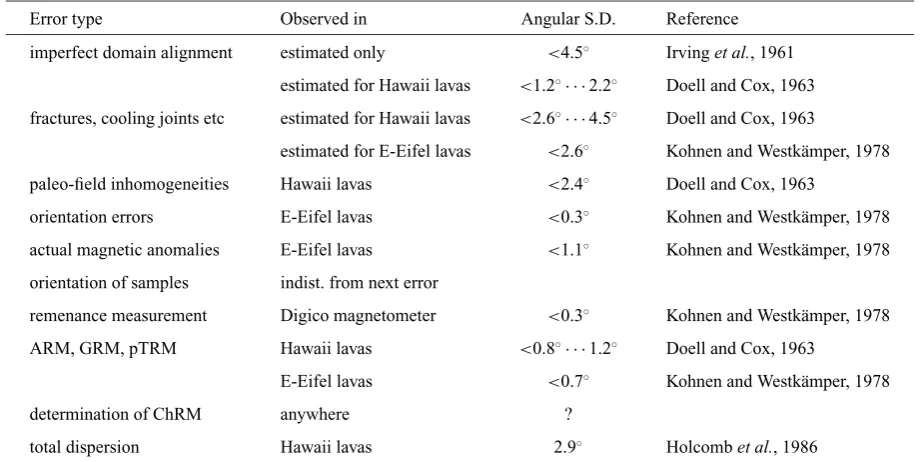
Table 1. Dispersion sources of paleomagnetic data, the circumstances where the dispersion has been observed, and the estimated or measured value for the dispersion, in terms of the angular standard deviations.
Error type Observed in Angular S.D. Reference
imperfect domain alignment estimated only <4.5◦ Irvinget al., 1961
estimated for Hawaii lavas <1.2◦· · ·2.2◦ Doell and Cox, 1963
fractures, cooling joints etc estimated for Hawaii lavas <2.6◦· · ·4.5◦ Doell and Cox, 1963
estimated for E-Eifel lavas <2.6◦ Kohnen and Westkamper, 1978¨
paleo-field inhomogeneities Hawaii lavas <2.4◦ Doell and Cox, 1963
orientation errors E-Eifel lavas <0.3◦ Kohnen and Westkamper, 1978¨
actual magnetic anomalies E-Eifel lavas <1.1◦ Kohnen and Westkamper, 1978¨
orientation of samples indist. from next error
remenance measurement Digico magnetometer <0.3◦ Kohnen and Westkamper, 1978¨
ARM, GRM, pTRM Hawaii lavas <0.8◦· · ·1.2◦ Doell and Cox, 1963
E-Eifel lavas <0.7◦ Kohnen and Westkamper, 1978¨
determination of ChRM anywhere ?
total dispersion Hawaii lavas 2.9◦ Holcombet al., 1986
lavaflow in different outcrops.
Paleomagnetic data are dispersed because of natural pro-cesses producing directional variations of the remanence vec-tor within the sampled rock unit (called natural dispersion), and because of experimental errors from the sampling and laboratory studies. Some of the contributing error sources have been studied for part of the data used here (Kohnen and Westkamper, 1978) or for other places (e.g., Doell and Cox,¨
1963) and are given in Table 1 in terms of angular standard deviationss. Other error sources so far have not been deter-mined experimentally and only an estimated value is given. Nature contributes to the dispersion of paleomagnetic data by imperfect alignment of magnetic domains (<1.2◦to 4.5◦), local displacement of rock units along fractures, cooling joints or deformation after remanence acquisition (<2.6◦ to 4.5◦). Additionally, local anomalies present during the NRM-acquisition may deflect the remanence direction from the ambientfield direction. Such anomalies depend on the magnetization of the underlying terrain and the topography of the sampled outcrop. For the East-Eifel volcanic field, Kohnen and Westk¨amper (1978) estimated thats ≤ 2.6◦, although Baaget al.(1995) demonstrated that an error of as much as 20◦may be produced in extreme situations.
Many of the above contributions are expected to be random over a typical sampling site, and distributing the individual samples will reduce or eliminate them. Combining the above values results in a natural dispersion ofs<3.7◦, if the lower values are used for each contribution (Table 1).
Experimental errors occur during field and laboratory work. The orientation of the drilled core is affected by read-ing errors (s=0.3◦) and the transfer of the orientation mark on the core (no quantitative value available, but certainly much larger than 0.3◦). The magnetic anomaly of the rock unit may deflect the magnetic compass used for orientation, contributing less than 1.1◦for the case of the East Eifel. The
use of a sun compass eliminates this error but orientation is less precise that way. During the remanence measurement of samples, a positioning error occurs in the magnetometer which depends on the sensitivity and resolution of the in-strument (s <0.3◦ in a Digico magnetometer). During the demagnetization of rock samples, laboratory induced mag-netizations may be produced, contributings<0.7◦to 1.2◦. Other errors are introduced during the determination of the characteristic remanence direction (ChRM) from the demag-netization data, and for this again no quantitative data are available.
Non-random errors may also occur, for example by mis-orientation of samples during thefield or laboratory work, or erroneous data analysis. Generally, such errors may be rec-ognized as outliers using statistical methods and eliminated before the calculation of a site-mean direction. Otherwise they would produce a systematic error.
The combined contribution of the above experimental er-rors results ins<0.8◦, again using the lower value for each contribution in Table 1.
Holcombet al.(1986) applied a similar analysis to pale-omagnetic data from Hawaiian lavaflows as did Doell and Cox (1963), to estimate the minimum resolution attainable for dating lavaflows using paleomagnetic secular variation. Based on the study of 135flows, and by combining estimates for the different contributing error sources, they estimated a total dispersion of 2.9◦. As these data come from different lavaflows, the total dispersion can not be split up into natural and experimental contributions. It should also be mentioned here that this value is already larger than the natural dis-persion derived from Table 1, which could indicate that this method of determining a mean total dispersion underesti-mates the real value.
Fig. 1. Distribution of volcanic eruption centers in the Quaternary Eifel volcanicfield, Germany (after Buchel and Mertes, 1982) shown as gray and black¨
dots. Black dots indicate eruption centers used for the present study.
outcrops. They observed significantly differing site-mean directions for the same lavaflow and attributed this to
intra-flow deformation and differing magnetic anomalies. Due to these varying conditions, the actual magnetic record may not be used to separate the total dispersion into its natural and experimental components.
The data present in this paper were obtained from exactly the same outcrops, so that the paleomagnetic record should be the same. This allows us to deduce the experimental and natural dispersion from the site-mean directions.
3.
The Data Sets
The paleomagnetic data used for this study come from the Quaternary Eifel volcanic province in Germany (Fig. 1). More than 300 monogenetic volcanic centers of Quaternary age are known, distributed in the East- and West-Eifelfields with different eruption histories and paleomagnetic records (e.g. Bohnel¨ et al., 1982, 1987; Fuhrmann and Lippolt, 1987; Bogaard and Schmincke, 1988; Schnepp and Hradetzky, 1994; Schnepp, 1996). The East-Eifel is characterized by basanitic, leucititic, nepelinitic, tephritic and phonolitic rocks spanning half of the Brunhes Chron. In the West-Eifel, rocks of leucitite and nephelinite composition dominate, fol-lowed by melilite-bearing foidites and other mafic rocks. The ages also cover a part of the Brunhes Chron, with a large percentage of volcanoes originating during afield-excursion about 510 ka ago.
3.1 Data from the first East-Eifel study
The East-Eifel data define a paleopole close to the geo-graphical north pole. The VGP-dispersion is consistent with commonly used models for the paleo secular variation of
the earth’s magneticfield (Kohnen and Westkamper, 1978).¨
Samples were taken with a gasoline powered drill and ori-ented“in situ”with an inclinometer and a magnetic compass. The samples always were distributed all over the outcrop, to reduce as far as possible systematic errors as discussed above. About 30% of all samples were demagnetized in detail with alternatingfields (AF), and their characteristic remanent magnetization (ChRM) was determined using Zijderveld di-agrams and stability indices. Based on the behavior of these pilot samples, the rest of the samples were then treated with one demagnetization step only, to obtain the correspond-ing site-mean direction. It should be mentioned here that only minor secondary remanence components were present in the samples, justifying such a procedure. Demagnetiza-tion curves always tended straight towards the origin of the Zijderveld diagrams. The high quality of the paleomagnetic data is clearly reflected by low within-site dispersion, high precision parametersk, and small confidence anglesα95(see Table 2). Field and laboratory work was done by Bohnel¨
(1977) and by Westkamper (1977).¨
3.2 Data from the first West-Eifel study
408 H. BOHNEL AND E. SCHNEPP: PRECISION OF THE PALEOMAGNETIC METHOD¨
as described above, and the remaining two thirds with elec-trical drill equipment. Besides the magnetic compass, a sun compass was also used, although no systematic difference between the two orienting methods was found. The sam-ples were mainly AF-demagnetized, but a small number were also subjected to thermal demagnetization. ChRM directions were obtained using Zijderveld diagrams, stability indices, difference-vector diagrams, and principal component anal-ysis. Field and laboratory work were done by Haverkamp (1980), Jager (1982), and Reismann (1985).¨
3.3 Data from the second West-Eifel study
Schnepp (1991, 1994) extended the work in the West-Eifel to obtain paleointensities of the Earth’s magneticfield. For the paleointensity experiments some untreated samples left by the previous workers could be used, but all sites had to be re-sampled at least partly. This was done in exactly the same outcrops as before, using the field notes of the previous workers. Several new sites have been studied as well, but these are excluded from the present study. Cores again were collected from different parts of the outcrop with an electrical drill, and magnetic and sun compasses were used for orientation. ChRM directions were obtained from thermal demagnetization experiments, which were carried out as part of the paleointensity determinations, using the double heating method of Coe (1967). ChRM directions are based mainly on Zijderveld- and difference-vector diagrams. 3.4 Data from the second East-Eifel study
Recently, the East-Eifel rocks have been re-studied to ob-tain paleointensities for comparison with the results from the western part (Schnepp, 1995, 1996). Only a few specimens were available from the former studies, so that all of the East-Eifel sites had to be re-sampled. Again, this was done in exactly the same outcrops sampled before. The samefield
Fig. 2. Sum of confidence limits (α95) of site-mean directions as obtained
from repeated study of the same outcrop versus angular distance between the two observed site-mean directions. The dashed line indicates equality of both parameters. Larger symbols correspond to sites with significantly different mean directions and their labels correspond to Table 2.
and laboratory procedures were applied as in the West-Eifel paleointensity study (see above).
Table 2 lists the two data sets, indicating the common statistical parameters for paleomagnetic results, and the dif-ference vector and angular distance (δ) between the corre-sponding site-mean directions. The number of samples per site is larger for the new study in the case of the West Eifel, and smaller for the new study in the East Eifel, which is a consequence of the focus of the paleointensity work. Cor-responding site-mean directions generally are in excellent agreement, with small, overlapping confidence circles, as demonstrated in Fig. 2. Here, the sum of the two error-circle radii (α95) is plotted versus the angular distance between the two site-mean directions. Only one site from the East-Eifel has an angular distance slightly larger than the sum of error-radii. Application of the McFadden and Lowes (1981) test shows that the site-mean directions of entries KP, DLO, HB, HS+TH1, and PK are different at the 95% probability level. The significance level for these sites varies between 99.9% and 97.3%. This indicates that even when the same outcrop is resampled, the site-mean directions may differ significantly. Obviously this represents a problem for correlation or dating applications using paleomagnetism.
4.
Analysis of the Dispersion of Paleomagnetic
Data
The relation of the within-site dispersion and angular dis-tance between corresponding site-mean directions with the rock magnetic parameters (NRM-intensity, median destruc-tivefield, Konigsberger factor Q) was analyzed, and no sig-¨
nificant differences were observed for the different studies. Apparently, these parameters have no influence on the dis-persion of paleomagnetic data.
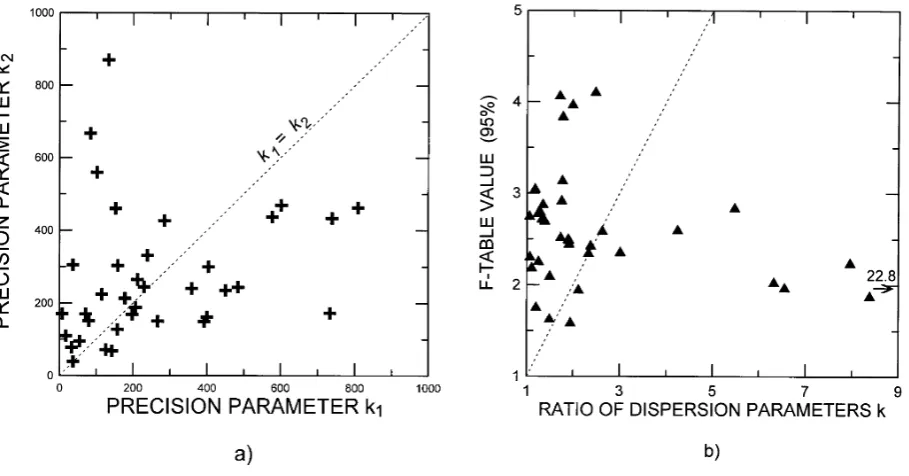
Every pair of site-mean directions in Table 2 corresponds to exactly the same outcrop and therefore the two precision parameters (k) should not differ significantly, assuming that both data sets belong to the same population. In Fig. 3(a) the k values are compared, and very large differences are observed which in part may be due to the varying number of samples. Applying the F-test (McFadden and Lowes, 1981, equation 24a) the significance of these differences is evalu-ated, and there is a considerable number of sites where the precision parameter k differs at the 95% probability level (Fig. 3(b)). We conclude from this observation, that the sta-tistical requirement of coincidingkparameters for the same rock unit may be too strict in some real cases.
Now we evaluate if systematic differences exist between site-mean directions from the same site, which is done by looking at the corresponding unit-length difference vectors (Fig. 4). Most difference vectors have shallow inclinations and random declinations, as would be expected for site-mean directions which are almost parallel. The precision param-eter of the resulting mean of difference vectors is k < 1, indicating that there is no systematic difference between the directions of the two data sets.
neg-Fig. 3. (a) Comparison of dispersion parametersk1andk2fromfirst and second study, respectively. (b) Significance test (McFadden and Lowes, 1981) for
dispersion parametersk: If data lie below the dashed line, the correspondingkparameters are different at the 95% probability level.
Fig. 4. Unit-length difference vectors between corresponding site-mean directions in equal area projection. The approximate overall mean di-rection of the Eifel paleomagnetic data is shown by a star and the great circle around that direction by a thick line (dotted where inclination is negative).
ative (positive) and increasingly steeper difference vectors in north (south) direction, if compared with the shallower difference vectors in east and west directions. Inverting the site-mean directions used for the difference vector calcula-tion, the observed great circle would change its inclination from south to north.
Based on the combined evidence of above observations,
we conclude that the directional differences between each pairs of site mean directions are random with no significant bias due to experimental procedures.
As corresponding site-mean directions differ randomly, the dispersion of the difference vectors may be described by directional statistics. The angular distancesδwhich describe the radial component of the difference vectors should follow a Fisher (1953) distribution, which is a spherical analogue to the Gaußdistribution of random one-dimensional variables. This angular distance is assumed to represent the contribution of the experimental errors, as each site mean direction on its own represents a sample of a data population which is disturbed by the same natural dispersion, but by differing experimental dispersions (different conditions during field and laboratory work, different operators, etc).
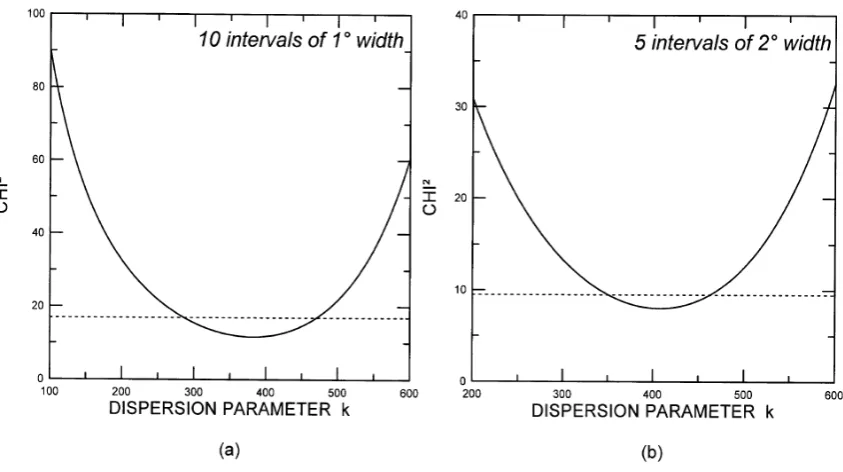
Figure 5 shows histograms of observed angular distances, using 1◦and 2◦class widths, respectively. A Fisher distribu-tion was adjusted to the data, and by means of the Chi2-test the statistical significance of this approximation was tested. The continuous lines in Fig. 5 represent the best-fit Fisher distribution to the data which was determined by variation of the precision parameterk, taking thek-value where Chi2 achieved a minimum as shown in the curves of Fig. 6. The minima are well defined and significant at the 95% confi -dence level, and the observed distribution therefore is in-distinguishable from a Fisher distribution with precision pa-rametersk=350 andk=368, for the chosen class-widths (Fig. 5). For a 1.4◦ class width (not shown) the best-fit is defined byk=347. The difference between these approx-imations is small, demonstrating that the obtained value for
kis stable and rather independent of the chosen class width ofδ. The standard angular deviation may be estimated ac-cording tos =81/√k(Fisher, 1953), giving a value fors
410 H. BOHNEL AND E. SCHNEPP: PRECISION OF THE PALEOMAGNETIC METHOD¨
Fig. 5. Histogram of observed angular distancesδbetween corresponding site-mean directions for of (a) 1◦, and (b) 2◦class-widths ofδ. The curves in both histograms indicate the best-fit Fisher distribution to the histograms, with the corresponding value of dispersion parameterkindicated along the curve.
Fig. 6. Variation of dispersion parameterkas a function of the value of Chi2-test, for (a) 1◦, and (b) 2◦class widths of angular distancesδ. Horizontal dashed lines indicate the 95% significance level.
direction in the Quaternary Eifel volcanic field, assuming that the natural dispersion is the same for the two studies because exactly the same outcrops were re-sampled.
5.
Discussion
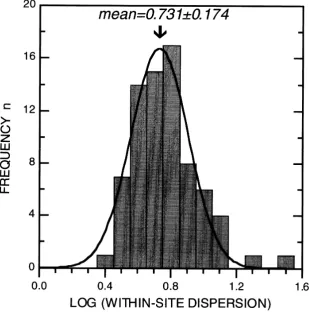
By analyzing the within-site dispersion (s=81/√k) of all site-mean directions (first and second studies), we observe a log-normal distribution of s (Fig. 7) which is expected because there are no negative or very small values ofs.
Al-though we would like to mention that no theoretical argument is available to prove such a distribution for a data set like ours. The distribution is centered at log(s)=0.731, ors=5.39◦. As the total within-site dispersion (stot) is the sum of contri-butions from natural processes and experimental factors, we can separate them according to:
Fig. 7. Histogram of within-site angular standard deviations, using logarithmic class-width subdivision ofs.
wheresnatandsexpdenote the dispersions due to natural pro-cesses and experimental procedures, respectively. Using the above values, we then obtainsnat =3.25◦. This is the dis-persion present in the Eifel volcanic rocks as a consequence of natural processes, which were mentioned above: imper-fect alignment of magnetic domains, minor movement of the rocks after TRM acquisition, and deflection of the TRM because of the presence of local anomalies of the ambient
field. As this kind of contribution to the total within-site dis-persion may not be reduced experimentally, it presents the
“back-ground noise”inherent to a paleomagnetic study in similar geological environments as the Eifel. Even with so-phisticatedfield and laboratory equipment, the experimental methods only will add to that dispersion. Comparing the nat-ural and experimental contributions to the dispersion, large efforts to improve paleomagnetic instruments and methods will not have much effect, at least for the study of volcanic rocks: reducing the experimental dispersion to 2◦would still give a total dispersion ofs=3.8◦. The situation of course may change for rocks of low remanence intensity, where mea-surement errors and natural processes disturbing the align-ment of remanence within the rock increase considerably, and it would be very interesting to perform a similar com-parative study on such rocks. In most sedimentary rocks the secular variation of the earth’s magneticfield will also contribute to the natural dispersion.
The obtained value of 3.21◦for the natural dispersion com-pares well with data listed in Table 1, which give a combined
value ofs <3.7◦ (see above), indicating that the estimated error values are indeed reasonable. On the other hand, this value is already larger than the total dispersion of 2.9◦ es-timated by Holcombet al.(1986) for Hawaiian lavaflows. This difference could be due to varying geological condi-tions, but we believe that it is due to the different methods used to determine the dispersion of the paleomagnetic data. The value of 4.33◦derived for experimental errors is much larger than the combined value ofs<1.6◦from Table 1. We believe that this is mainly due to the unknown contribution of errors in marking and orienting the samples. It is easy to imagine that the mark scribed on the sample during the orien-tation in thefield and later transferred to the whole cylinder may have errors of several degrees, in terms of an azimuthal angle with respect to the cylinder axis. A similar error occurs while registering this mark in the magnetometer during the remanence measurements. The determination of the ChRM direction from the demagnetization data by any method may increase the dispersion additionally. Using the minimum val-ues from Table 1 and the experimental dispersion calculated in the present paper, these errors together contribute∼4◦to the total dispersion.
6.
Conclusions
412 H. BOHNEL AND E. SCHNEPP: PRECISION OF THE PALEOMAGNETIC METHOD¨
only estimated numerical values are available. Based on the repetition of paleomagnetic studies of 37 Quaternary lava
flows in the Eifel volcanicfield (Germany) we analyzed the differences of the mean directions obtained. These site-mean directions differ randomly and in most cases insignif-icantly, and the angular distances between corresponding direction-pairs may be described by Fisher statistics. As the natural dispersion is assumed to be the same for both studies, the differences must be due to the experimental procedures. The Fisher statistics give a best value for the angular standard deviation ofsexp=4.33◦, which we interpret to represent the mean experimental dispersion of the paleomagnetic studies in the Eifel. Most of this dispersion is likely (or most likely) due to errors during the orientation of the samples in thefield and during the measurements.
By analyzing the total within-site dispersion, we obtain a mean value ofstot = 5.39◦, assuming that it is log-normal distributed. Using these data wefind a value ofsnat=3.25◦ for the natural dispersion. The natural dispersion represents an important contribution to the total within-site dispersion, and it is impossible to improve the experimental methods such that the total dispersion will be reduced significantly.
This should be different for paleomagnetic studies of low-remanence rocks like limestone, where, apart of the differ-ences in remanence acquisition, the experimental errors are much higher than in volcanic rocks.
Acknowledgments. The continuous support of the Eifel studies by Jurgen Untietd is acknowledged. These studies were supported¨ by funds of the Deutsche Forschungs Gesellschaft. Reviews of Laurie Brown (previous version) and the journal referees (Jonathan Hagstrum and one anonymous reviewer) enhanced the manuscript and are appreciated.
References
Baag, C., C. E. Helsely, S. Z. Xu, and B. R. Lienert, Deflection of paleomag-netic directions due to magnetization of underlying terrain,J. Geophys. Res.,100, 10013–10027, 1995.
Bogaard, P. van den and H.-U. Schmincke, Aschenlagen als quartäre Zeit-marken in Mitteleuropa,Die Geowissenschaften,30, 75–84, 1988. Bohnel, H., Pal¨ äomagnetische Untersuchungen an quartären Vulkaniten der
Osteifel, Diplom. thesis, Inst. Geophys. Munster, 1977.¨
Bohnel, H., H. Kohnen, J. Negendank, and H.-U. Schmincke, Paleomag-¨
netism of Quaternary volcanics of the East-Eifel, Germany,J. Geophys.,
51, 29–37, 1982.
Bohnel, H., N. Reismann, G. J¨ ager, U. Haverkamp, J. F. W. Negendank, and¨
H.-U. Schmincke, Paleomagnetic investigation of Quaternary West Eifel volcanics (Germany): indication for increased volcanic activity during geomagnetic excursion/event?,J. Geophys.,62, 50–61, 1987.
Buchel, G. and H. Mertes, Die Eruptionszentren des Westeifeler Vulkan-¨
feldes,Z. dt. geol. Ges.,133, 409–429, 1982.
Coe, R. S., The determination of paleointensities of the earth’s magneticfield with emphasis on mechanisms which could cause non-ideal behaviour in Thellier’s method,J. Geomag. Geoelectr.,19, 157–179, 1967. Doell, R. R. and A. Cox, The accuracy of the paleomagnetic method as
evaluated from historic Hawaiian lavaflows,J. Geophys. Res.,68, 1997–
2009, 1963.
Fisher, R. A., Dispersion on a sphere,Proc. R. Soc. London,A127, 295–305, 1953.
Fuhrmann, U. and H. J. Lippolt, Excess argon and dating of Quaternary Eifel volcanism: III. Alkali basaltic rocks of the Central West Eifel/FR Germany,Neues Jg. Geol. Pal¨aont. Mh.,H4, 213–216, 1987.
Hagstrum, J. T. and D. E. Champion, Paleomagnetic correlation of late Quaternary lavaflows in the lower east rift of Kilauea volcano, Hawaii, J. Geophys. Res.,99, 21679–21690, 1994.
Haverkamp, U., Palaomagnetische Untersuchungen an quart¨ ären Vulkaniten der Westeifel, Diplom. thesis, Inst. Geophys. Munster, 1980.¨
Holcomb, R., D. Champion, and M. McWilliams, Dating recent Hawaiian lavaflows using paleomagnetic secular variation,Geol. Soc. Am. Bull.,
97, 829–839, 1986.
Irving, E., P. M. Stott, and M. A. Ward, Demagnetization of igneous rocks by alternating magneticfields,Phil. Mag.,6, 225–241, 1961.
Jager, G., Pal¨ aomagnetische Untersuchungen im quart¨ aren Vulkanfeld der¨
Westeifel, Diplom. thesis, Inst. Geophys. Munster, 1982.¨
Kohnen, H. and H. Westkamper, Paleosecular variation studies of the Brun-¨
hes epoch in the volcanic province of the East-Eifel, Germany,J. Geo-phys.,44, 545–555, 1978.
McFadden, P. L. and F. J. Lowes, The discrimination of mean directions drawn from Fisher distributions,Geophys. J. R. astr. Soc.,67, 19–33, 1981.
Reismann, N., Abschließende palaomagnetische Untersuchungen zur¨
Verteilung der virtuellen geomagnetischen Pole fur das quart¨ are Vulkan-¨
feld der Westeifel, Diplom. thesis, Inst. Geophys. Munster, 1985.¨
Schnepp, E., Die erdmagnetische Palaointensit¨ at im quart¨ aren Vulkanfeld¨
der Westeifel, Ph.D. thesis, Inst. Geophys. Munster, 1991.¨
Schnepp, E., Determination of geomagnetic palaeointensities from the Qua-ternary West Eifel volcanicfield,Geophys. J. Int.,116, 688–714, 1994 Schnepp, E., Paleointensity study of Quaternary East Eifel phonolithic rocks
(Germany),Geophys. J. Int.,121, 627–633, 1995
Schnepp, E., Geomagnetic paleointensities derived from volcanic rocks of the Quaternary East Eifelfield, Germany,Phys. Earth Planet. Int.,94, 23–41, 1996.
Schnepp, E. and H. Hradetzky, Combined paleointensity and40Ar/39Ar age
spectrum data from volcanic rocks of the West Eifelfield (Germany): Evidence for an early Brunhes geomagnetic excursion,J. Geophys. Res.,
99, 9061–9076, 1994.
Watson, G. S., Analysis of dispersion on a sphere,Mon. Not. R. astr. Soc., Geophys. Suppl.,7, 153–159, 1956.
Westkamper, H., Untersuchungen zur Pal¨ aos¨ akularvariation des Pleistoz¨ ¨ans in der quartaren Vulkanregion der Osteifel, Diplom. thesis, Inst. Geophys.¨
Munster, 1977.¨
H. Bohnel (e-mail: [email protected]) and E. Schnepp¨